Downtrend

US30 30 30 let's go baby !I reckon price will still push up in the coming days to resistance level but no doubt on the daily time frame US30 is still in a downtrend. Trade with the trend folks !

✅EUR_USD SHORT FROM RESISTANCE🔥
✅EUR_USD is trading along the falling resistance
And as the pair will hit it soon
I am expecting the price to go down
To retest the demand levels below
SHORT🔥
✅Like and subscribe to never miss a new idea!✅

AUD-CHF Bearish Bias! Sell!
Hello,Traders!
AUD-CHF is trading in a downtrend
Below the falling resistance line
And the pair has formed
A bearish flag pattern so I think
That IF we see a bearish breakout
From the flag then the pair
Will fall even further down
Towards the target below
Sell!
Like, comment and subscribe to boost your trading!
See other ideas below too!

A big challenge for BITCOINPrice keeps bouncing from the downtrend and now it seems harder to regain 20k level.
On last week Dollar Index drop (DXY), Bitcoin managed to bounce off the $18,600 but at the very last moment of weekly candle close price shoot up to be stopped right above 2017 all time highs $19,666.
Starting the weekly trading period DXY is recovering for another attempt to break resistance giving weakness to Bitcoin. We will see what price action tells us during the week but crypto bulls need to step up if not the flush down on BTC will be imminent.. 16k first 13,8k later.. in case of a breakout 20k must be held then 25k likely for end of November for a double local top.

CSCO daily bearish hammer can run into weekly downtrend support Order SELL CSCO NASDAQ.NMS Stop 41.28 LMT 41.28 will be automatically canceled at 20230401 01:00:00 EST
CSCO daily bearish hammer can run into weekly downtrend support line if break below. Probably chop of the wave 4 downtrend, be quick. Looks like nothing in our way for quick 1.2R.

EURUSD Bearish but Caution Ahead of PMI News
Welcome back! Let me know your thoughts in the comments!
**EURUSD - Listen to video!
We recommend that you keep this pair on your watchlist and enter when the entry criteria of your strategy is met.
Please support this idea with a LIKE and COMMENT if you find it useful and Click "Follow" on our profile if you'd like these trade ideas delivered straight to your email in the future.
Thanks for your continued support!
Brian & Kenya Horton, BK Forex Academy

Will BTC continue the downward movement?The yellow trend line usually stops BTC to go higher as it did before. And I noticed if everyone talks about a breakout, it usually doesn't happen. Just keeps falling.
Not financial advise, it is only my speculation.

✅TESLA WAIT FOR BREAKOUT|SHORT🔥
✅TESLA is trading in a downtrend
And the pair is etching on the verge
Of collapsing through the support
So IF it happens then we can short
On the pullback, and IF
There is no breakout then
The setup is invalid
SHORT🔥
✅Like and subscribe to never miss a new idea!✅

AUD-CAD Wait For Breakout! Sell!
Hello,Traders!
AUD-CAD is trading in a downtrend
And the pair has formed a range
So we are waiting for the breakout
To determine the direction
Of the next move and because
Of the downtrend, the more likely
Direction of the breakout is
To the downside, but as I said
We will follow the direction
Of the breakout when
Entering the trade.
For now the bias is bearish tho
Sell!
Like, comment and subscribe to boost your trading!
See other ideas below too!

AMD Stuck in a Severe DowntrendPrimary Chart: Linear Regression Channel and Two Long-Term Anchored VWAPs
No matter what method is used to analyze and define the trend, AMD has been stuck in a severe downtrend since its all-time high on November 30, 2021. Like other growth and technology stocks (except for FAANG stocks and Microsoft), AMD's November 2021 peak occurred a month before the S&P 500 ( SP:SPX ) topped on January 4, 2021.
The linear regression channel, set a two-standard deviations from the linear regression line, evidences the downtrend as of today, October 6, 2022. Price is hovering just under the linear regression channel's midline, which is the linear regression "line of best fit."
Two anchored VWAPs also confirm the validity of the downtrend as well. The first anchored VWAP is anchored to the all-time high in November 2021. That VWAP is well overhead at $102.38 as of today, and it slopes downward. Note how it has been resistance at major swing highs after sharp bear rallies over the past year. The second anchored VWAP is anchored to the pandemic-crash lows in March 2020. That VWAP also lies well overhead at $92.16 as of today. These VWAPs show that sellers remain in control despite the impressive bear rallies that have repeatedly occurred since the all-time high.
Until the structure changes materially, and that could take a fair amount of time to unfold, the downtrend remains in effect. Bounces should be sold at proper resistance levels preferably with confirmation that price has begun to reverse back lower in the short term.
If readers are interested, SquishTrade may post a shorter-term view that includes key resistance levels where the current bear rally may find strong resistance. These levels could be watched for reversals where price in the short-term rejoins the larger-degree downtrend.
________________________________________
Author's Comments:
(1) Thank you for reviewing this post and considering its charts and analysis. The author welcomes comments, discussion and debate in the comment section. Shared charts are especially helpful to support any opposing or alternative view.
(2) This technical-analysis view does not constitute a trade recommendation or trade setup. Instead, it attempts to offer technical commentary that describes and analyzes price levels, trends, price action, or the broader technical environment as of the publication date. Technical-analysis commentary does not equate to trade setups or recommendations. Within a given price environment, traders bear responsibility for their own trading strategy, risk tolerance, and time frame, and for any due diligence associated with such trades.
(3) This technical-analysis viewpoint could change at a moment's notice, e.g., when price violates a key level of invalidation for a particular view. Further, proper risk-management techniques are vital to trading success.
(4) To the extent countertrend price moves are discussed, consider that countertrend or mean-reversion trading, e.g., trading a rally in a bear market, remains higher risk and lower probability even for the most experienced traders and investors.
DISCLAIMER: This post contains commentary published solely for educational and informational purposes. This post's content (and any content available through links in this post) and its views do not constitute financial advice or an investment or trading recommendation, and they do not account for readers' personal financial circumstances, or their investing or trading objectives, time frame, and risk tolerance. Readers should perform their own due diligence, and consult a qualified / licensed financial adviser or other financial or investment professional before entering any trade, investment or other transaction.

XAUUSD BEARISH DOWNTREND GOLD DOWNTREND ON WEEKLY TIMEFRAME.
Weekly timeframe shows strong bearish pressure to the downside.
Will 1620 support break?

GOLD TECHNICAL ANALYSISHi everyone,
Looking at this chart, we can see that the last 4 times RSI was dipping below 50 and we had a red candle, gold price went down significantly. According to the price just now we can see that we had a double top on price which is a bearish signal, RSI is pointing down but is is not below 50 yet. Price is in a good support now, i think its fair to assume that if the price of gold breaks this support and RSI dips below 50 there is a big probability we can see gold prices going down and a continuation of the downtrend.
Let me know your thoughts on this.

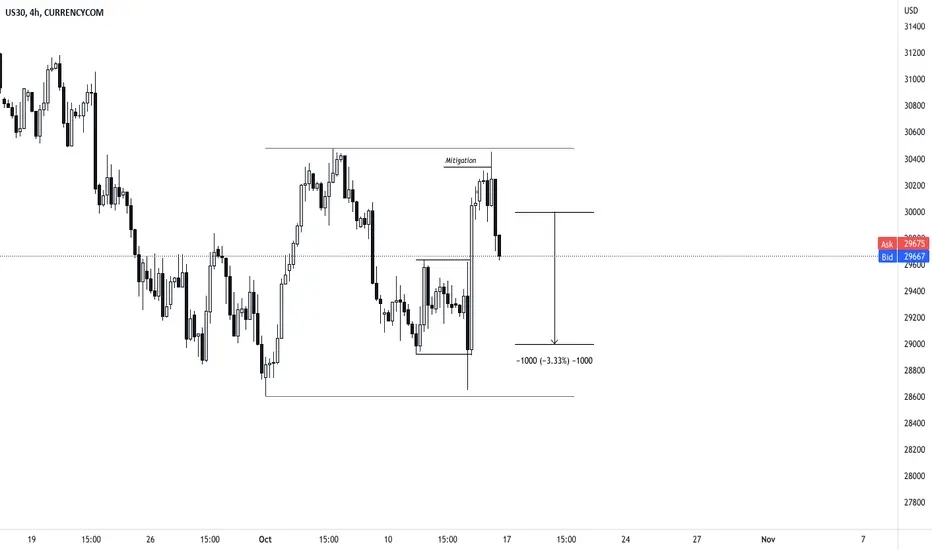
US30 4h Trading RangeUS30 Consolidation in Intraday Trading Range
Formed mitigation at top to fuel push downwards
Price should go to 29000 within the range
AMD's False Breakout above Short-Term TrendlinePrimary Chart: Down Trendline from November 2021 to Present and Several Anchored VWAPs
Recent False Breakout above Short-Term Trendline
After hitting a new low on September 29, 2022, AMD had a brief a rally off the lows . This led to a brief break above a shorter down trendline from August 4, 2022 peaks (light blue down trendline) Now, AMD looks to have faked out the bulls and bottom pickers again. Before the close, AMD's price sunk all the way back to the trendline, perhaps just below depending on how exactly it is drawn, after seeming to push decisively above it. After hours it sunk well below that trendline again with preliminary earnings results that were well under expectations.
Notice the daily candle from October 6, 2022. Some technicians call this a Pinocchio candle or bar. It has a long upper shadow that pushes above a key level, but the shadow being the only part of the candle above the key level by the close of the price bar.
For another example for purposes of comparison, consider AMC's most recent short squeeze (which was smaller than many others in the series of short squeezes it has seen). Here, AMC formed a extremely large Pinocchio bar that effectively signaled the exhaustion and reversal that ensued. That one worked exactly as expected.
A Pinocchio price bar shows up when the bar breaks temporarily above a level of resistance and then falls back below it. It also can appear when the bar breaks temporarily below a key support level, and then reclaims that level by the close of the bar. Essentially, a Pinocchio bar is a failed breakdown or failed breakout that occurs within a single price bar.
Some basics of Pinocchio bars follow below for those unfamiliar with the term:
Martin Pring, a technical expert, writes that these bars "give a false sense of what is really going on."
Pinocchio bars tend to create bull or bear traps depending on the direction the long upper shadow points.
Failed upside breakouts, such as the one shown here on AMD's chart, lock in unwary bulls with a loss by the close of the bar.
Shorts similarly get stopped when intraday bars pierce well below support and then whipsaw back above that support by the close.
In Martin Pring's technical-analysis reference books, he explains that the "false break" that develops is "indicative of exhaustion since the price cannot hold above the strong resistance reflected by the line ." In short, like the character Pinocchio's nose that grows when he lies, the price move beyond the resistance / support ends up being a false move, and the bigger the false move, the bigger the lie.
Just because price is in a severe downtrend does not mean that prices can behave irrationally. How many sharp and powerful bear rallies have occurred so far in this market, especially in beaten down laggards?
For example, price could go down and retest the lows and then rally up to high $70s. Or it could make new lows, and then rally hard back up to a key Fibonacci level, such as the .382 or .618. Until price can start exceeding major swing highs and lows, and its down trendline, it's not a great candidate for bull-trend trading or investing.
Additional Comments and Considerations
Not long ago, stocks like AMD and NVDA were some of the hottest technology stocks traded in the world. They had become veritable market leaders not just in their innovative technology products but also in price leadership. In terms of relative strength, AMD and NVDA both spent plenty of time at the forefront of one of the most powerful bull markets in history (funded by extra liquidity and easy-money policies of central banks) from 2020-2021. But then the cracks started to appear in what otherwise appeared to be some of the most formidable stocks on the planet. Major indices began to roll over not long afterwards.
AMD has not gone unscathed. Its downtrend is not difficult to see with the clearly demarcated lower highs and lower lows. On the Primary Chart, note the orange down trendline that has contained price since November 2021 peaks. VWAPs confirm the view. The dark blue VWAP is anchored to the all-time high from November 30, 2021. It's hard to imagine that there was quite a lot of liquidity on that day, with a number of buyers paying that price at the very top, at $164.46. It can be a viable strategy to strategically buy stocks that have been hitting new 52-week highs showing extraordinary relative strength, but this time, buying at the all time high didn't work out so well for some.
How many times have traders and investors started eagerly buying the dip in this bear? The chart tells the tale. Quite a few major swing lows, with candles having a nice long lower shadow, appear AMD's YTD chart. Each rally may have made a nice trade for nimble countertrend traders, but for investors hoping they caught the low of a pullback, or even better a multi-year low, disappointment ensued.
AMD's days of heroic market leadership along with NVDA continue to be a distant memory as continues to fall to new lows. Should anyone be a knife catcher and hope to have a multi-bagger in 10 years? That's a question for your financial advisor or your own due diligence if you're fundamentally oriented. But from a technical perspective, a lot has to change with regard to the structure before it's safe to buy. Jesse Livermore had a fantastic adage that applies well to this situation, which was recently published by @InvestMate in an Editor's Pick here on TV:
“Don’t take action with a trade until the market, itself, confirms your opinion. Being a little late in a trade is insurance that your opinion is correct. In other words, don’t be an impatient trader.”
Credit and thanks to @InvestMate for reminding everyone of these timeless truths to help in trading and understanding markets.

EUR-USD Resistance Cluster! Sell!
Hello,Traders!
EUR-USD is trading in a downtrend
And the pair is approaching
A resistance cluster of the falling
And horizontal resistance levels
So as we are bearish biased
We will be expecting a bearish
Reaction and a move down
After the pair retests the cluster
Sell!
Like, comment and subscribe to boost your trading!
See other ideas below too!

AR - ShortAR broke the 3 ascending trendline it formed recently in its bullish movement and its poised for more downward pressure.
1 support is the descending line in $9.7 area, second support support is the demand area below $9.6.

BA daily evening star reversal with RSI divergenceSell Stop 127.27 LMT 127.27 GTC
Buy Limit 115.27 GTC
Buy Stop 137.06 GTC
BA daily evening star reversal with RSI divergence wave 5 of downtrend


Shooting Star Formed on Weekly Basis
Good Day ,
Hello Traders,
Chalet Hotels formed a Shooting Start on Weekly Basis and it able to cross a major resistance. As of now, it may come down and test the levels for 355 and 333.
Chart Self explanatory
Time Frame : Weekly
Disclaimer : I am not SEBI registered analyst, this is for educational purposes.
Please trade as per your risk and do consult with your financial advisor before taking any
trading decisions..
If you really like the analysis , please do comments, LIKE and Follow me.

NZD-CAD Bearish Setup! Sell!
Hello,Traders!
NZD-CAD has retested the falling resistance
And went down reinforcing our bearish bias
And I think that the price
Will go further down
Sell!
Like, comment and subscribe to boost your trading!
See other ideas below too!

S&P500 INDEX (SPY) Technical Outlook
Hey traders,
S&P500 index is currently approaching 3515 - 3680 horizontal weekly structure support.
I believe that the next bearish wave will initiate after its breakout.
Patiently wait for a weekly candle close below the underlined area.
A bearish continuation will be expected to 3300 then.
Good luck next week!
❤️If you have any questions, please, ask me in the comment section.
Please, support my work with like, thank you!❤️

BTC MAY BREAK DOWN ANY TIME SOONHello Traders,
Looking at my BTC Chart very closely right now only from a daily perspective, all i see is possible breakdown and I get the chart speaks for itself.
I will be paying close attention to the rectangular down trend (Orange) just to watch out for any breakout above it but for as long as the down trend is not invalidated and the we see a closure below the supply zone... i will look for a good entry to short BTC to to Between $13,745 - $14,000 in the immediate.
Trade carefully and with proper risk management.
Regards
