AUD-CHF Will Keep Falling! Sell!
Hello,Traders!
AUD-CHF is trading in a downtrend
In a falling wedge pattern
So I think that we will see
A bearish continuation
In the coming week
Sell!
Like, comment and subscribe to boost your trading!
See other ideas below too!
Downtrend

Short the RussellThe market is perpetuating low risk taking which makes the Russell a better broad index short than the S&P500. There's more room to the downside for this one to play out. We suggest a smaller position to which one can add incrementally after it makes it's move. The stop loss can also be moved closer to Breakeven to improve on the Ratio.

TSLA - Short on a big name in a bear market retrace Many of the big names in Tech, Industrials and Financials are going to be shorted as part of the strategy. We just want ensure a decent Reward/Risk ratio, 1.69 in this case, as the Macroeconomic situation remains gloomy for the next few quarters at least.

MCD daily bearish hammerOrder SELL MCD NYSE Stop 235.32 LMT 235.32 will be automatically canceled at 20230401 01:00:00 EST
MCD daily bearish hammer nice close below MA 10 beginning of wave 5 downtrend.

HLT daily bearish hammer at Fibonacci 50% retracementOrder SELL HLT NYSE Stop 123.74 LMT 123.74 will be automatically canceled at 20230401 01:00:00 EST
HLT daily bearish hammer at Fibonacci 50% retracement begining of wave 5 wave 3 downtrend.

SPY daily second bearish hammer in a rowOrder SELL SPY ARCA Stop 356.01 LMT 356.01 will be automatically canceled at 20230401 01:00:00 EST
SPY daily second bearish hammer in a row continuation wave 5 downtrend.

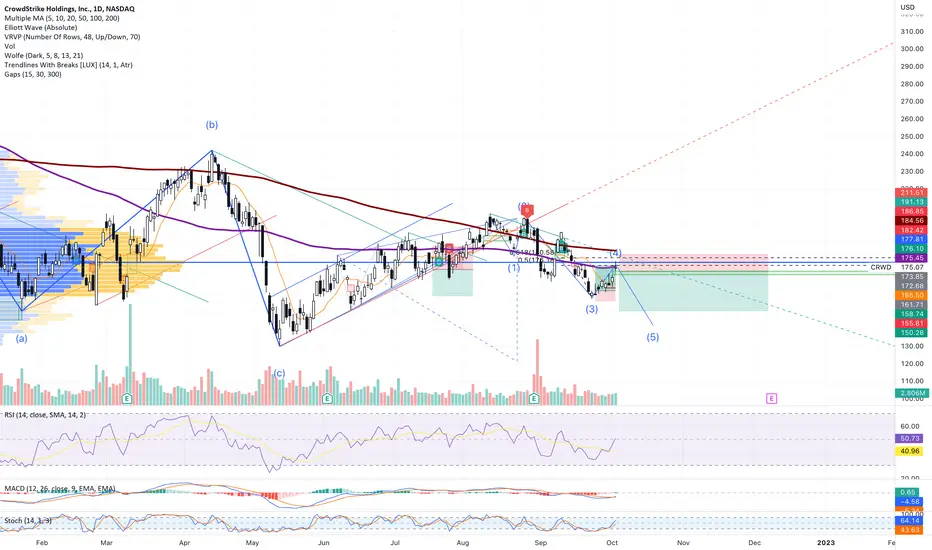
CRWD daily bearish hammer at 50% Fibonacci retracementOrder SELL CRWD NASDAQ.NMS Stop 172.68 LMT 172.68 will be automatically canceled at 20230401 01:00:00 EST
CRWD daily bearish hammer at 50% Fibonacci retracement beginning of wave 5 downtrend.
EUR-USDThe EUR-USD is currently traded at 0.9700. And at 11 pm the FOMO news is coming, but the dollar is in a strong position they also give a downtrend to euro currency.

GBPJPY: Asscending Broadening WedgeWe will be looking for a 3rd, possibly 4th tap of the resistance. Appying the 1% rule to this trade, i will split my overall into 2 trades. ...
1st trade will be the 3rd tap with a 35-40pip S/L.> as GBPJPY you will want a bigger S/L as it moves faster and most spreads reach for S/L's....
2nd trade will be the possible 4th tap of the resistance, to hopefully get adn even better entry, Presuming the price will break out of the wedge to the downside.
Another thing to consider is GBPJPY's impulses. Ive been noticing 90-110 pip impulses. the most recent impulse was 260 pips.
Although the impulses have been this big, this next impulse to the downside will be the length of the LOWEST point near entry of the ascending broadening wedge, and will go as far as the HIGHEST point within the wedge.
I will set my T/P the distance FROM the breakout of the wedge equal to whatever length the wedge ends up being. I expect the wedge to ascend around 100pips from the ENTRY point LOW. . Therefore, i will hope to pick up 100Pips before closing out all of my positions. Of course closing half of each position at 50pips wihtin that move.
This is NOT financial advice! This is my OWN Speculation of GBPJPY at this given moment.
Hope you enjoy!~

CRM weekly bearish hammerOrder SELL 6 CRM NYSE Stop 142.46 LMT 142.46 will be automatically canceled at 20230401 01:00:00 EST
CRM weekly bearish hammer into wave 5 downtrend

✅AUD_JPY SELLING OPPORTUNITY|SHORT🔥
✅AUD_JPY is going down currently
As the pair broke the key structure level
Which is now a resistance, and has made a pullback
And the retest, so I think the price will keep going down now
SHORT🔥
✅Like and subscribe to never miss a new idea!✅


CCO daily bearish hammer at all time highs A or wave 1 downtrendSell Stop 36.32 LMT 36.32 GTC
Buy Limit 30.70 GTC
Buy Stop 39.22 GTC
CCO daily bearish hammer at all time highs A or wave 1 downtrend

✅AUD_CHF WILL KEEP FALLING|SHORT🔥
✅AUD_CHF s going down currently
And the pair broke the key structure level
Which is now a resistance, and has made a pullback
And the retest, so I think the price will go lower now
SHORT🔥
✅Like and subscribe to never miss a new idea!✅

EUR/USD - outlining the near term supports and resistancesHighlights:
1. EUR/USD remains in a downtrend
2. The chart is dominated by the 2022 downtrend at 1.0035 - while capped here the bear trend remains intact
3. The recent low at .9536 is exposed and below here we have to refer all the way back to 2001 to find the next support at .9332.
Disclaimer:
The information posted on Trading View is for informative purposes and is not intended to constitute advice in any form, including but not limited to investment, accounting, tax, legal or regulatory advice. The information therefore has no regard to the specific investment objectives, financial situation or particular needs of any specific recipient. Opinions expressed are our current opinions as of the date appearing on Trading View only. All illustrations, forecasts or hypothetical data are for illustrative purposes only. The Society of Technical Analysts Ltd does not make representation that the information provided is appropriate for use in all jurisdictions or by all Investors or other potential Investors. Parties are therefore responsible for compliance with applicable local laws and regulations. The Society of Technical Analysts will not be held liable for any loss or damage resulting directly or indirectly from the use of any information on this site.

EUR-USD Will Keep Falling! Sell!
Hello,Traders!
EUR-USD is trading in a downtrend
And the pair has bounced off
The resistance cluster
Just as I predicted in my previous analysis
Which reinforces our bearish bias
And makes me expect a further move down
Towards the support level below
Sell!
Like, comment and subscribe to boost your trading!
See other ideas below too!

TRADE OF THE WEEK | Classic Price Action Trade💰
Hey traders,
This week, we caught a great short trade with my students on US30 index.
We spotted a nice horizontal key level where the market formed a double top formation.
Our trigger was a breakout of its neckline,
the position was opened on a retest.
Then the market dropped sharply giving us a very nice winner.
Did you catch this move?
❤️If you have any questions, please, ask me in the comment section.
Please, support my work with like, thank you!❤️

✅DOW JONES WILL KEEP FALLING|SHORT🔥
✅DOW JONES is going down currently
As the index broke the key structure level
Which is now a resistance, and has made a pullback
And the retest, so I think the price will keep going down now
SHORT🔥
✅Like and subscribe to never miss a new idea!✅

AUD-JPY Bearish Flag! Sell!
Hello,Traders!
AUD-JPY is trading in a local downtrend
And is now breaking out of the
Bearish wedge pattern
So I think that pair will keep falling
Sell!
Like, comment and subscribe to boost your trading!
See other ideas below too!

EURUSD - Fundamentals to shape next move!Sometimes its best to just stay away when we have news events, data releases or any other big fundamentals that can cause havoc in the market. I like to find a position and be in profit before any other influential impacts hit the market, if you siting in a trade near entry and something dramatically changes you can be left in huge drawdown or in a big loss, even slippage! Trying to open trades off the back of a data release is almost impossible to get any sort of consistency.. I still haven't got my short entry on EURUSD and I'm not just going to open a position for the sack of it, I trade off a strict plan and also encourage you guys to do the same! the market is risky and can eat your account up with a few mistakes, stay safe guys and good luck! ill be back on Sunday and hopefully have my voice back lol.

NZD-USD Will Keep Falling! Sell!
Hello,Traders!
NZD-USD is trading in a downtrend
And the pair has formed a bearish flag pattern
So we are bearish biased on the pair
And after the breakout
A further move down
Is to be expected
Sell!
Like, comment and subscribe to boost your trading!
See other ideas below too!

Dow Looking Week On The Chart Follow Lower Low PatternDow Jones Industrial Average Index View Spot Cmp - 29941
Dow Looking Week On The Chart Follow Lower Low Pattern In The Chart
Important Levels
Above 30572 Go Long For Target 32000 ++
Below 30428 Go Short For Target 28000 ++

OXY daily bearish hammer at Fibonacci 50% retracementSell Stop 64.36 LMT 64.36 GTC
Buy Limit 48.07 GTC
Buy Stop 71.24 GTC
OXY daily bearish hammer at Fibonacci 50% retracement beginning if wave 3 downtrend.
