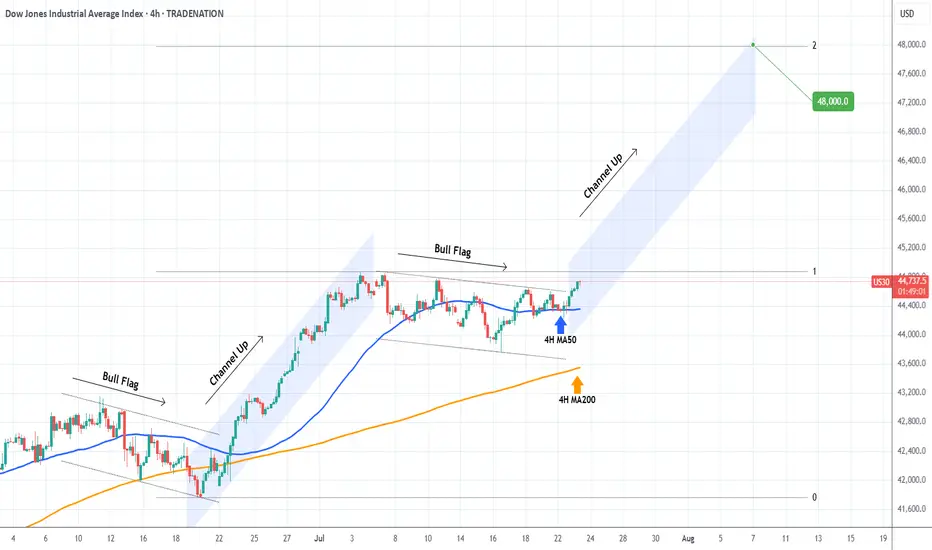
DOW JONES Strong rebound on its 4H MA50.Dow Jones (DJI) is having a strong rebound exactly on its 4H MA50 (blue trend-line). This is taking place just after the price broke above the Bull Flag that served as the accumulation pattern following the previous Channel Up.
This is a repetitive pattern and most likely we will now see the new Channel Up starting. The technical Target on such formations is the 2.0 Fibonacci extension at 48000.
-------------------------------------------------------------------------------
** Please LIKE 👍, FOLLOW ✅, SHARE 🙌 and COMMENT ✍ if you enjoy this idea! Also share your ideas and charts in the comments section below! This is best way to keep it relevant, support us, keep the content here free and allow the idea to reach as many people as possible. **
-------------------------------------------------------------------------------
Disclosure: I am part of Trade Nation's Influencer program and receive a monthly fee for using their TradingView charts in my analysis.
💸💸💸💸💸💸
👇 👇 👇 👇 👇 👇
Dowsignals
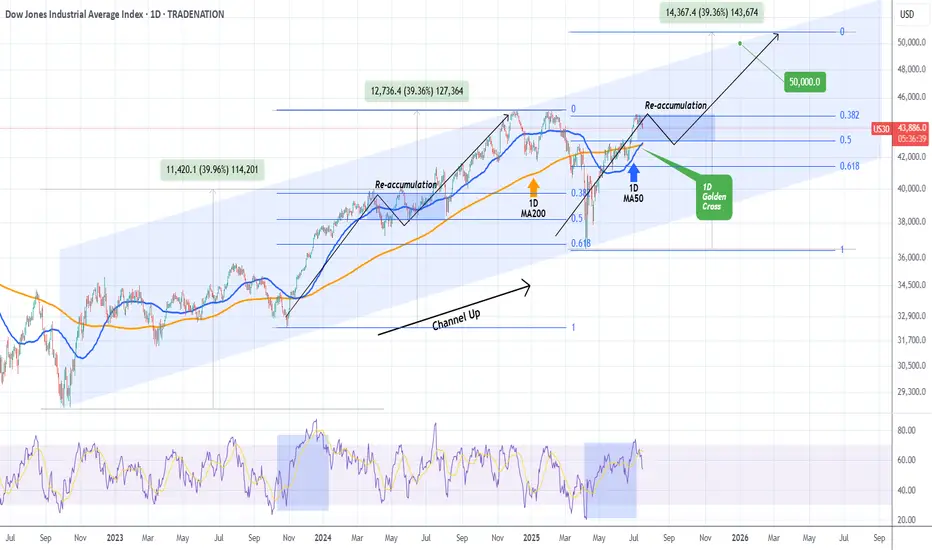
DOW JONES formed 1st 1D Golden Cross since 2022!Dow Jones (DJIA) completed on Monday its 1st Golden Cross on the 1D time-frame since December 12 2022! This powerful bullish pattern comes with the price close to its All Time High (ATH).
Being inside almost a 3-year Channel Up, the current rise is the pattern's latest Bullish Leg following the April 07 2025 bottom (Higher Low). Both previous Bullish Legs rose by +39.96% before forming a Higher High.
Based on the Fibonacci retracement levels, last time the previous Bullish Leg was within the 0.382 - 0.5 Fibonacci Zone, it formed a Re-accumulation Phase for 3 months. As a result, we shouldn't dismiss the fact of trading sideways for the rest of the Summer and then picking up the pace. Our end-of-year Target remains 50000.
-------------------------------------------------------------------------------
** Please LIKE 👍, FOLLOW ✅, SHARE 🙌 and COMMENT ✍ if you enjoy this idea! Also share your ideas and charts in the comments section below! This is best way to keep it relevant, support us, keep the content here free and allow the idea to reach as many people as possible. **
-------------------------------------------------------------------------------
Disclosure: I am part of Trade Nation's Influencer program and receive a monthly fee for using their TradingView charts in my analysis.
💸💸💸💸💸💸
👇 👇 👇 👇 👇 👇
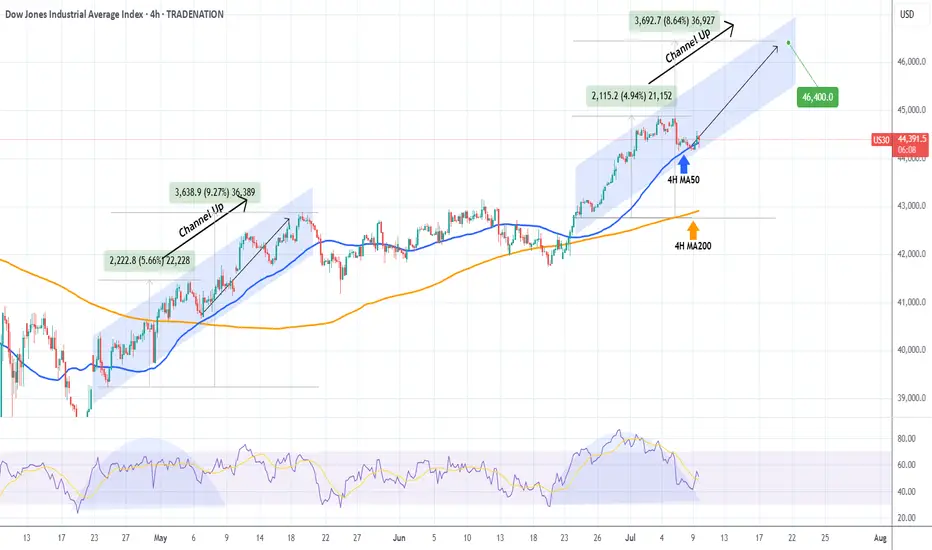
DOW JONES repeating May's pattern.Dow Jones (DJI) has been testing its 4H MA50 (blue trend-line) since yesterday, following 2 straight weeks of trading strongly above it.
If it holds and rebounds, the pattern will draw even more similarities with May's Channel Up, which after the May 06 Low, it resumed the uptrend to peak on a +9.27% rise from the bottom, before breaking below the 4H MA50.
Since the current rise is -0.70% weaker (+4.94% against +5.66%) from May's fractal, we can assume that as long as the 4H MA50 holds, we can expect a peak at 46400.
-------------------------------------------------------------------------------
** Please LIKE 👍, FOLLOW ✅, SHARE 🙌 and COMMENT ✍ if you enjoy this idea! Also share your ideas and charts in the comments section below! This is best way to keep it relevant, support us, keep the content here free and allow the idea to reach as many people as possible. **
-------------------------------------------------------------------------------
Disclosure: I am part of Trade Nation's Influencer program and receive a monthly fee for using their TradingView charts in my analysis.
💸💸💸💸💸💸
👇 👇 👇 👇 👇 👇
DOW JONES This is how it hits 50000 by the end of the year.Dow Jones (DJI) has been trading within a Channel Up pattern since the October 03 2022 market bottom and since the April 07 2025 Low, it's been unfolding the pattern's new Bullish Leg.
Ahead of an emerging 1D Golden Cross, the first since December 13 2022, the price action looks more bullish than ever strongly supported by the 1D MA50 (blue trend-line).
In fact, it is not that different from the fractal of that last 1D Golden Cross, which traded inside a neckline before the Bullish Leg broke upwards and completed eventually a +39.96% rise.
We expect a 50000 test towards the end of the year at the top of the Channel Up, which is still marginally below the tolerance levels of a +39.36% rise.
-------------------------------------------------------------------------------
** Please LIKE 👍, FOLLOW ✅, SHARE 🙌 and COMMENT ✍ if you enjoy this idea! Also share your ideas and charts in the comments section below! This is best way to keep it relevant, support us, keep the content here free and allow the idea to reach as many people as possible. **
-------------------------------------------------------------------------------
Disclosure: I am part of Trade Nation's Influencer program and receive a monthly fee for using their TradingView charts in my analysis.
💸💸💸💸💸💸
👇 👇 👇 👇 👇 👇

DOW JONES about to skyrocket based on the Gold/Silver ratio!Dow Jones (DJI) has been basically consolidating for the past month or so, following the massive April 7th bottom rebound but there is a very distinct indicator that shows it is about to skyrocket.
That is the Gold/ Silver ratio (blue trend-line). Gold (XAUUSD) as a safe haven, attracts capital in times of market uncertainty. Silver (XAGUSD), as a metal of industrial use, attracts capital in times of economic boom and prosperity.
In the past 6 years more particularly, every time the Gold/ Silver ratio declined, Dow started rising aggressively (exception July-Aug 2019, when the market rose straight after), as investors clearly showed their risk-on appetite by buying Silver (optimism) at the expense of Gold (fear).
Dow's current consolidation indicates that there may be high accumulation in the past month and the ratios extended decline suggests a skyrocket move is up next.
-------------------------------------------------------------------------------
** Please LIKE 👍, FOLLOW ✅, SHARE 🙌 and COMMENT ✍ if you enjoy this idea! Also share your ideas and charts in the comments section below! This is best way to keep it relevant, support us, keep the content here free and allow the idea to reach as many people as possible. **
-------------------------------------------------------------------------------
💸💸💸💸💸💸
👇 👇 👇 👇 👇 👇

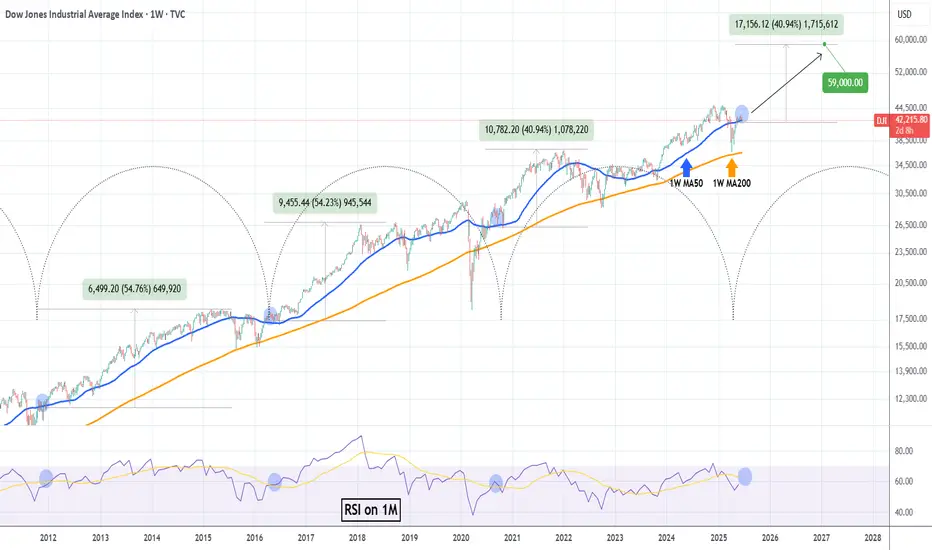
DOW JONES 15 year Cycles are coming to play.Dow Jones (DJI) is consolidating on its 1W MA50 (blue trend-line) for the past month. Based on a remarkable cyclical frequency as the Time Cycles show, every time this 1W MA50 consolidation takes place since October 2011, it turned into the long-term Support that supported rallies of at least +40.94%.
As their 1M RSI readings also sync, we can expect the current consolidation to end soon and drive the market to at least a +40.94% rise from the 1W MA50. Our long-term Target on this is 59000.
-------------------------------------------------------------------------------
** Please LIKE 👍, FOLLOW ✅, SHARE 🙌 and COMMENT ✍ if you enjoy this idea! Also share your ideas and charts in the comments section below! This is best way to keep it relevant, support us, keep the content here free and allow the idea to reach as many people as possible. **
-------------------------------------------------------------------------------
💸💸💸💸💸💸
👇 👇 👇 👇 👇 👇
DOW JONES Inverse Head and Shoulders close to a bullish breakoutDow Jones (DJI) has completed an Inverse Head and Shoulders (IH&S) pattern, having formed the Right Shoulder supported by the 1D MA50 (blue trend-line).
The price is now slowly rising to test the upper neckline and if broken, expect a strong movement upwards. Technically, such patterns target their 2.0 Fibonacci extensions. The current one is at 49200 and that's our long-term Target. If you seek lower risk, you may target the 1.5 Fib extension.
-------------------------------------------------------------------------------
** Please LIKE 👍, FOLLOW ✅, SHARE 🙌 and COMMENT ✍ if you enjoy this idea! Also share your ideas and charts in the comments section below! This is best way to keep it relevant, support us, keep the content here free and allow the idea to reach as many people as possible. **
-------------------------------------------------------------------------------
Disclosure: I am part of Trade Nation's Influencer program and receive a monthly fee for using their TradingView charts in my analysis.
💸💸💸💸💸💸
👇 👇 👇 👇 👇 👇

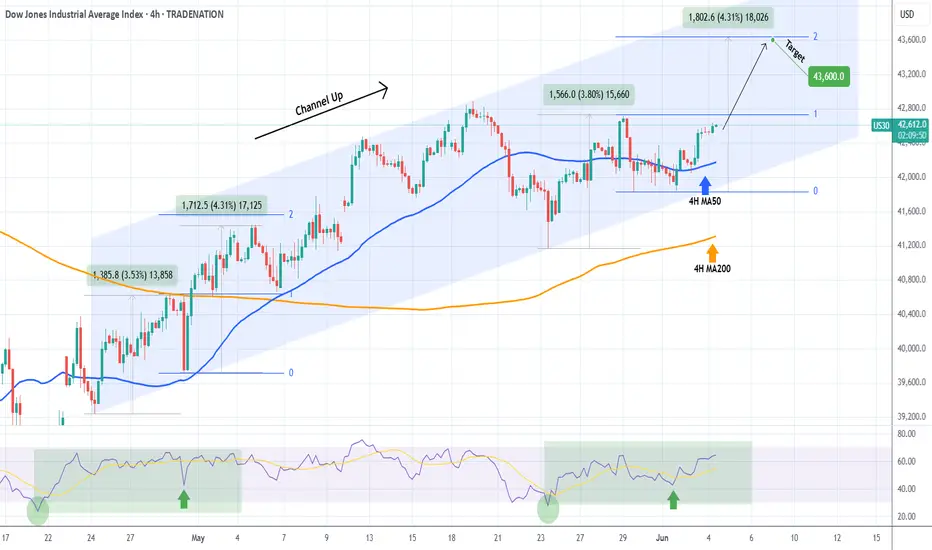
DOW JONES starting the new Bullish Leg.Dow Jones (DJI) is rallying off its 4H MA50 (blue trend-line), shortly after making a new Higher Low on its 6-week Channel Up. Technically that is the start of its new Bullish Leg.
With the 4H RSI being identical to the Bullish Leg at the start of the Channel Up, we expect it to again rise by +4.30% and touch the 2.0 Fibonacci extension. Target 43600.
-------------------------------------------------------------------------------
** Please LIKE 👍, FOLLOW ✅, SHARE 🙌 and COMMENT ✍ if you enjoy this idea! Also share your ideas and charts in the comments section below! This is best way to keep it relevant, support us, keep the content here free and allow the idea to reach as many people as possible. **
-------------------------------------------------------------------------------
Disclosure: I am part of Trade Nation's Influencer program and receive a monthly fee for using their TradingView charts in my analysis.
💸💸💸💸💸💸
👇 👇 👇 👇 👇 👇
DOW JONES Holding the 1D MA50 can propel it to 45000.Dow Jones (DJI) contained Friday's Trump-led pull-back just above its 1D MA50 (blue trend-line), marking the strongest correction since April 21. So far that is purely a technical reaction to the Resistance 1 (42855) rejection a day earlier.
This is forming an Inverse Head and Shoulders (IH&S) but above all, as long as the 1D MA50 holds, it is a bullish continuation of April's rebound/ Bullish Leg at the bottom of the long-term Bullish Megaphone pattern and on the 1W MA200 (red trend-line).
As you can see, the 1W MA200 has been the ultimate Support of this pattern and last time it started a rebound that broke above the 1D MA50 and retested it, was on the first Bullish on November 09 2023.
That pull-back held the 1D MA50 and the price action continued the bullish trend until it completed a +23.69% rise, before the next 1D MA50 break.
As a result, as long as the 1D MA50 holds, we expect at least another +23.69% rise on the medium-term, which this times falls on the Resistance 2 level (45100), aligning perfectly for a technical test. Our Target will be a little lower at 45000.
-------------------------------------------------------------------------------
** Please LIKE 👍, FOLLOW ✅, SHARE 🙌 and COMMENT ✍ if you enjoy this idea! Also share your ideas and charts in the comments section below! This is best way to keep it relevant, support us, keep the content here free and allow the idea to reach as many people as possible. **
-------------------------------------------------------------------------------
Disclosure: I am part of Trade Nation's Influencer program and receive a monthly fee for using their TradingView charts in my analysis.
💸💸💸💸💸💸
👇 👇 👇 👇 👇 👇

DOW JONES Can this Channel Up hold after the Fed Rate Decision?Dow Jones (DJIA) has been trading within a Channel Up since the April 24 Low and yesterday's correction (technically its Bearish Leg) stopped on the 4H MA50 (blue trend-line). Having formed already a Golden Cross, as long as this 4H MA50 holds, it should technically fuel the pattern's new Bullish Leg.
The 'weakest' Bullish Leg within this Channel Up has been +3.58%, so we expect a minimum repeat of that, giving a Target at 42100 on the short-term. This falls perfectly at the bottom of the 5 week Resistance Zone.
If this Channel Up doesn't get invalidated after today's Fed Rate Decision, it will most likely push the price there.
-------------------------------------------------------------------------------
** Please LIKE 👍, FOLLOW ✅, SHARE 🙌 and COMMENT ✍ if you enjoy this idea! Also share your ideas and charts in the comments section below! This is best way to keep it relevant, support us, keep the content here free and allow the idea to reach as many people as possible. **
-------------------------------------------------------------------------------
💸💸💸💸💸💸
👇 👇 👇 👇 👇 👇

DOW JONES Are you willing to bet against a 15 year pattern?Dow Jones (DJI) will close the month today with a massive rebound 1M candle after almost touching its 1M MA50 (blue trend-line). Since the October 2010 break above the 1M MA50, after the market recovered from the 2008 Housing Crisis, the 1M MA50 has been the ultimate long-term Buy Entry as it has always signaled rallies that ranged from +58% to +67%.
The 1M MA50 has also kept the index mostly within the 0.382 - 0.786 Fibonacci range (blue zone) of the multi-year Channel Up. Given also that the 1W RSI also reached in April its ultimate Buy Zone (green), we view this as the best long-term Buy Signal the index handed to us since the September 2022 bottom of the Inflation Crisis.
Since the Bullish Legs that followed have been fairly consistent on average, we expect another 58% rise minimum. Assuming a 'bad-case' scenario of being contained within the 0.786 Fib, then a 56000 long-term Target seems more than fair.
Are you willing to go against this pattern?
-------------------------------------------------------------------------------
** Please LIKE 👍, FOLLOW ✅, SHARE 🙌 and COMMENT ✍ if you enjoy this idea! Also share your ideas and charts in the comments section below! This is best way to keep it relevant, support us, keep the content here free and allow the idea to reach as many people as possible. **
-------------------------------------------------------------------------------
💸💸💸💸💸💸
👇 👇 👇 👇 👇 👇

DOW JONES New long-term bottom being formed on the 1W MA200.Dow Jones (DJI) hasn't yet broken above its 1D MA50 (blue trend-line) following the April 07 Low, but is nonetheless consolidating and holding the 1W MA200 (red trend-line), which hasn't broken as Support since October 17 2022.
That was a few days after the bottom of the 2022 Inflation Crisis was formed and the current Channel Up started. In fact, the rallies that started on both Channel Up bottoms since, have been almost identical in range (+22.60% and +23.80% respectively) so technically we should be expecting at least 44800 (+22.60% from April's Low) on the medium-term.
-------------------------------------------------------------------------------
** Please LIKE 👍, FOLLOW ✅, SHARE 🙌 and COMMENT ✍ if you enjoy this idea! Also share your ideas and charts in the comments section below! This is best way to keep it relevant, support us, keep the content here free and allow the idea to reach as many people as possible. **
-------------------------------------------------------------------------------
Disclosure: I am part of Trade Nation's Influencer program and receive a monthly fee for using their TradingView charts in my analysis.
💸💸💸💸💸💸
👇 👇 👇 👇 👇 👇

DOW fulfilled all Market Bottom conditions. 2year rally started!Dow Jones (DJI) has cemented a strong Support zone last week. Not only did it almost test its 1W MA200 (orange trend-line) and successfully held but also the former All Time High (ATH) Resistance trend-line that started from the previous Cycle Top and now turned into Support.
This previous ATH trend-line held and offered its Support on the previous 2 major market bottoms as well (October 03 2022 and March 23 2020). Actually on all 3 previous Cycle bottoms that turned out to be the best level to buy long-term, the 1W RSI was oversold on the 30.00 limit.
All the above conditions were fulfilled on last week's (April 07 2025) Low. Even though Dow is expected to reach 53000 on its next Top in around 2 years, the most optimal Sell Signal has been given by the 1W RSI. After the 1W RSI breaks for the first time above the 70.00 overbought limit again, the best Sell Signal would be after it drops and re-tests again 70.00 for the 2nd time.
-------------------------------------------------------------------------------
** Please LIKE 👍, FOLLOW ✅, SHARE 🙌 and COMMENT ✍ if you enjoy this idea! Also share your ideas and charts in the comments section below! This is best way to keep it relevant, support us, keep the content here free and allow the idea to reach as many people as possible. **
-------------------------------------------------------------------------------
Disclosure: I am part of Trade Nation's Influencer program and receive a monthly fee for using their TradingView charts in my analysis.
💸💸💸💸💸💸
👇 👇 👇 👇 👇 👇

DOW 104% TARIFFS on China activated. Can the market be saved?Dow Jones (DJIA) is almost on its 1W MA200 (orange trend-line) and earlier today President Trump activated 104% duties on Chinese imports. This is far from being an encouraging development especially after Monday's attempt for the market to recover.
Most of the gains were lost yesterday and today it is a wait-and-see game in anticipation of the market reaction on the opening bell of Wall Street.
From a long-term technical perspective however, Dow is on a huge buy level that we've only seen another 4 times since the Housing Bubble bottom in March 2009. That buy level consists of two conditions: price touching the 1W MA200 and the 1W RSI hits (or comes extremely close to) the 30.00 oversold limit.
As you can see that has happened last time on September 19 2022 (Inflation Crisis bottom), March 09 2020 (COVID crash), August 24 2015 (China slowdown, Grexit) and August 08 2011 (first correction since 2009 Housing Crisis). The situation most similar to the current, is the COVID crash as it was the fastest drop to the 1W MA200 and 1W RSI to 30.00.
Despite the brutal correction, it took the market 'only' 43 weeks (301 days) to reach again the 0.786 Fibonacci retracement level. That is the top of the Blue Zone of the Fibonacci Channel Up that started on the March 2009 Housing bottom. The Blue Zone, consisting of the 0.786 - 0.382 Fib range, is important as it has dominated the multi-year bullish trend and contained the price action inside it, with only a few occasions diverging outside of it.
The longest it took Dow to reach the 0.786 Fib again after such correction was 110 weeks (770 days) and that interestingly enough happened two out of the four times. Practically reaching the 0.786 Fib constitutes a Cycle Top.
So essentially, despite the uncertainty and panic, the market is technically on a Support level that in 16 years we've only seen another 4 times, that's once every 4 years, which is a fair sample of a Cycle size. As a result, assuming stability comes to the world through trade deals (and why not Rate Cut announcements), we may see Dow reaching its 0.786 Fib again (and make new ATH) the fastest by February 02 2026, hitting 49000 and the longest by May 17 2027, hitting 56000 roughly.
-------------------------------------------------------------------------------
** Please LIKE 👍, FOLLOW ✅, SHARE 🙌 and COMMENT ✍ if you enjoy this idea! Also share your ideas and charts in the comments section below! This is best way to keep it relevant, support us, keep the content here free and allow the idea to reach as many people as possible. **
-------------------------------------------------------------------------------
💸💸💸💸💸💸
👇 👇 👇 👇 👇 👇

DOW JONES One break away from a rally back to 45000.Dow Jones (DJIA) got stopped on the 4H MA50 (blue trend-line) as the market paused ahead of today's tariffs implementation. This is the 2nd technical rejection since the March 13 bottom, the first being n the 4H MA200 (orange trend-line) last Wednesday.
This bottom is technically the start of the new Bullish Leg of the 1-year Bullish Megaphone pattern, and is very similar, both in 1D RSI and price terms, to the first one (April 19 - May 20 2024). As you can see, we are currently within the sane 0.5 - 0.786 Fib range, where the price consolidated before the eventual 4H MA200 bullish break-out.
If it continues to replicate the 2024 Bullish Leg, then be ready for a straight Resistance test once the 4H MA200 breaks. Our Target is 45000.
-------------------------------------------------------------------------------
** Please LIKE 👍, FOLLOW ✅, SHARE 🙌 and COMMENT ✍ if you enjoy this idea! Also share your ideas and charts in the comments section below! This is best way to keep it relevant, support us, keep the content here free and allow the idea to reach as many people as possible. **
-------------------------------------------------------------------------------
💸💸💸💸💸💸
👇 👇 👇 👇 👇 👇

DOW JONES Last chance to buy before it breaks the 1D MA50.Dow Jones (DJIA) has been trading within a 1.5 year Channel Up pattern since the July 2023 High. The market found itself under heavy pressure recently as the Channel unfolded its Bearish Leg which found Support right below the 1D MA200 (orange trend-line).
As the 1D RSI got oversold (<30.00) and rebounded, this is perhaps the last opportunity to buy low, before it breaks above its 1D MA50 (blue trend-line) on what is technically the new Bullish Leg.
The previous Bullish Leg (November 2023 - March 2024) hit the 2.0 Fibonacci extension on a +23.94% rise, before it broke below its 1D MA50 again. As a result, it is possible for Dow not to break again below its 1D MA50 once broken, before it reaches the 2.0 Fib which sits at 50000. Our Target is a little lower than that at 49000.
-------------------------------------------------------------------------------
** Please LIKE 👍, FOLLOW ✅, SHARE 🙌 and COMMENT ✍ if you enjoy this idea! Also share your ideas and charts in the comments section below! This is best way to keep it relevant, support us, keep the content here free and allow the idea to reach as many people as possible. **
-------------------------------------------------------------------------------
Disclosure: I am part of Trade Nation's Influencer program and receive a monthly fee for using their TradingView charts in my analysis.
💸💸💸💸💸💸
👇 👇 👇 👇 👇 👇

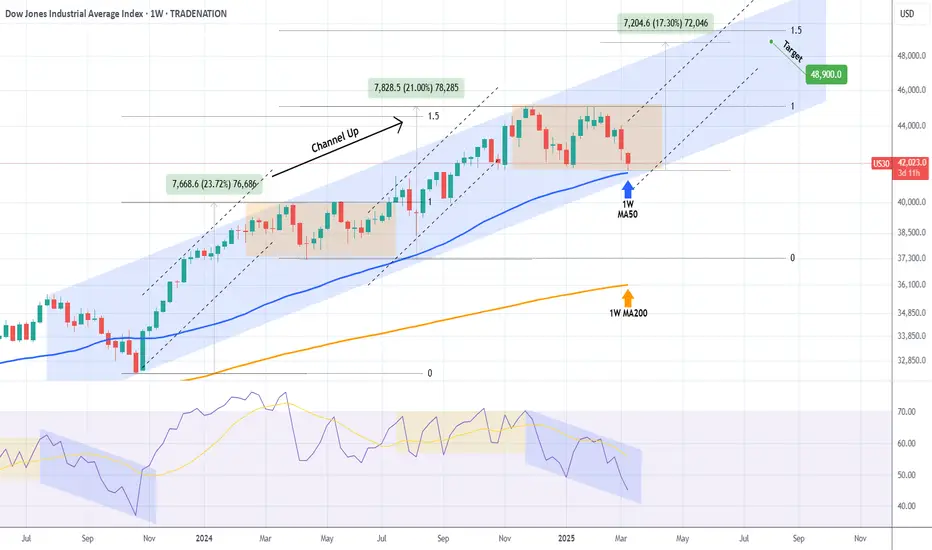
DOW JONES Can the 1W MA50 hold and spark an end-of-year rally?Dow Jones (DJIA) has been trading within a Channel Up pattern since the late July 2023 High. The decline of the last 30 days can be technically seen as the Bearish Leg that will price its new Higher Low bottom.
The price isn't only close to the Channel's bottom but also the 1W MA50 (blue trend-line), a level that has been supporting since the October 30 2023 bullish break-out. As a result, a 1W MA50 hit will be a potential double support test, with the 1W RSI also printing a Bearish Leg similar to the one that led to the October 2023 bottom.
On the other hand, the ranged price action since the late November 2024 High, resembles the sideways volatility of the first half of 2024. Both were initiated after Higher High pricings at the top of the Channel Up. The rallies that led to those tops have been +21.00% and +23.72% respectively.
If there is a decreasing rate on each Bullish Leg, then the new one should be +17.30% (i.e. -3.30% less than the previous one), which falls marginally below the 1.5 Fibonacci extension, which is where the November 2024 High was priced.
As a result, as long as Dow is closing its 1W candles above the 1W MA50, the 2-year Channel Up is more likely to push upwards again for its new Bullish Leg, potentially targeting 48900 (+17.30%).
-------------------------------------------------------------------------------
** Please LIKE 👍, FOLLOW ✅, SHARE 🙌 and COMMENT ✍ if you enjoy this idea! Also share your ideas and charts in the comments section below! This is best way to keep it relevant, support us, keep the content here free and allow the idea to reach as many people as possible. **
-------------------------------------------------------------------------------
Disclosure: I am part of Trade Nation's Influencer program and receive a monthly fee for using their TradingView charts in my analysis.
💸💸💸💸💸💸
👇 👇 👇 👇 👇 👇
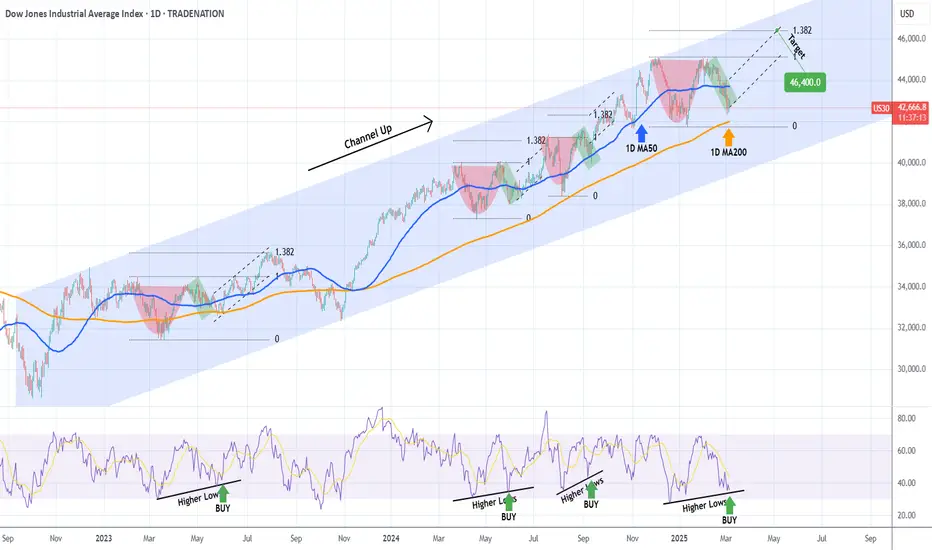
DOW JONES Massive 1D MA200 reversal for Cup and Handle?Dow Jones (DJIA) has been trading within a Channel Up since the September 2022 market bottom. Throughout this long-term structure, Cup and Handle (C&H) patterns have emerged that were always contained above the 1D MA200 (orange trend-line) and subsequently initiated a rebound to at least the 1.382 Fibonacci extension before the next pull-back.
The 1D MA200 is right below us at the moment and the current C&H seems to be on the verge of completing its Handle. Moreover, the 1D RSI is on its usual Higher Lows trend-line that prompts to a the most optimal buy entry. We're bullish, targeting 46400 (the 1.382 Fibonacci extension).
-------------------------------------------------------------------------------
** Please LIKE 👍, FOLLOW ✅, SHARE 🙌 and COMMENT ✍ if you enjoy this idea! Also share your ideas and charts in the comments section below! This is best way to keep it relevant, support us, keep the content here free and allow the idea to reach as many people as possible. **
-------------------------------------------------------------------------------
Disclosure: I am part of Trade Nation's Influencer program and receive a monthly fee for using their TradingView charts in my analysis.
💸💸💸💸💸💸
👇 👇 👇 👇 👇 👇
DOW JONES Cup and Handle completed and eyes a new ATH.Dow Jones (DJIA) has been trading within a Channel Up since the October 2022 market bottom of the Inflation Crisis. Inside this pattern, four Cup and Handle (C&H) formations have occurred with the most recent one, about to complete its Handle this week.
All such C&H patterns, rebounded to at least the 1.382 Fibonacci extension before the next pull-back. As a result, our Target before May remains 46400.
-------------------------------------------------------------------------------
** Please LIKE 👍, FOLLOW ✅, SHARE 🙌 and COMMENT ✍ if you enjoy this idea! Also share your ideas and charts in the comments section below! This is best way to keep it relevant, support us, keep the content here free and allow the idea to reach as many people as possible. **
-------------------------------------------------------------------------------
💸💸💸💸💸💸
👇 👇 👇 👇 👇 👇

DOW JONES 1D MA50 supporting huge Inverse H&S push!Dow Jones (DJIA) has been trading within a Channel Up for the past 15 months. The pattern that could be the strongest driving force however in the coming weeks is an Inverse Head and Shoulders (IH&S), which is about to complete its Right Shoulder.
As you can see this is being strongly supported by the 1D MA50 (blue trend-line) in the past 30 days and every such IH&S pattern in the last 2 years broke to the upside and hit at least its 1.382 Fibonacci extension.
The 1D RSI sequences between those IH&S fractals are identical and the current RSI Bearish Divergence matches perfectly all previous Right Shoulder formations that preceded the 1.382 Fib push.
As a result, a 46400 Target would be an ideal technical Higher High for the Channel Up.
-------------------------------------------------------------------------------
** Please LIKE 👍, FOLLOW ✅, SHARE 🙌 and COMMENT ✍ if you enjoy this idea! Also share your ideas and charts in the comments section below! This is best way to keep it relevant, support us, keep the content here free and allow the idea to reach as many people as possible. **
-------------------------------------------------------------------------------
Disclosure: I am part of Trade Nation's Influencer program and receive a monthly fee for using their TradingView charts in my analysis.
💸💸💸💸💸💸
👇 👇 👇 👇 👇 👇

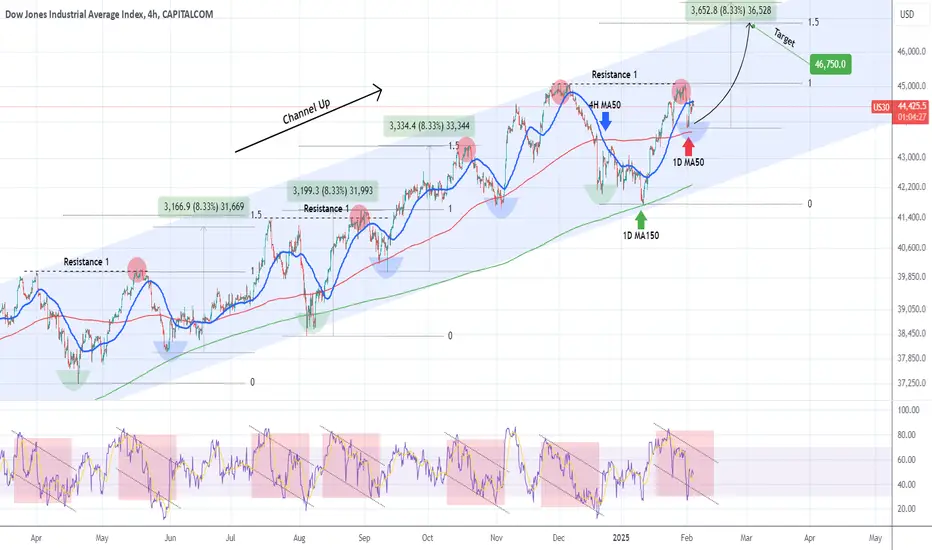
DOW JONES Can the 1D MA50 save the day once more?Dow Jones (DJIA) has been trading within a year long Channel Up and this week's pull-back has so far found Support just above the 1D MA50 (red trend-line). As this chart shows, every 1D MA50 contact that was made after a Channel Up bottom (Higher Low), was a buy opportunity as the blue arc patterns highlight.
The green arcs are the Channel bottoms and technically the strongest buy opportunities and in the past 10 months we've only had 3 of those. This is the 4th blue arc however, the medium-term buy opportunity.
Regardless of colour, the 4H RSI pattern on each of those buy opportunities, has been the same. And the resulting rally has either hit the 1.5 Fibonacci extension or made a +8.33% rise.
This time the 1.5 Fib is a bit closer to the price, so that will be our medium-term Target at 46750.
-------------------------------------------------------------------------------
** Please LIKE 👍, FOLLOW ✅, SHARE 🙌 and COMMENT ✍ if you enjoy this idea! Also share your ideas and charts in the comments section below! This is best way to keep it relevant, support us, keep the content here free and allow the idea to reach as many people as possible. **
-------------------------------------------------------------------------------
💸💸💸💸💸💸
👇 👇 👇 👇 👇 👇
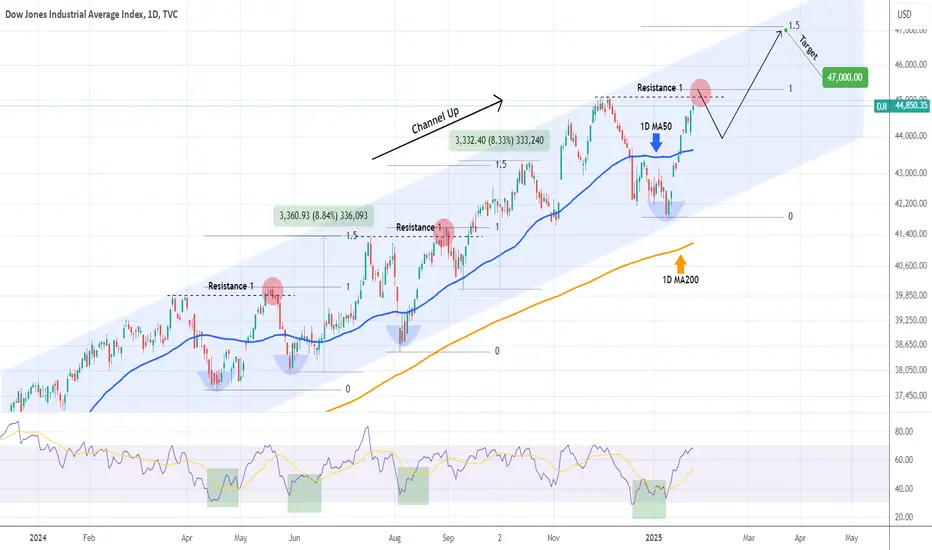
DOW JONES close to a rejection. See where to buy & target 47000.Dow Jones (DJI) gave us the most optimal buy entry on our previous call (January 09 2025, see chart below), as we bought right below the 4H MA200, which was the bottom of the 1-year Channel Up, and on minimum risk it hit our 45000 Target:
The price is currently about to break above Resistance 1. As this chart shows, every time a sub-1D MA50 (blue trend-line) rebound broke above a Resistance 1 level, it was only on a marginal note and then corrected back to the 1D MA50.
The two notable examples where August 30 2024 and May 20 2024. After the correction bottomed and the bullish trend was resumed, the rebound that followed reached the 1.5 Fibonacci extension, making a roughly +8.50% rise from the Low.
This indicates that the next Higher High of the Channel Up should be a little over 47000 and that will be our Target after we catch that 1D MA50 pull-back entry.
-------------------------------------------------------------------------------
** Please LIKE 👍, FOLLOW ✅, SHARE 🙌 and COMMENT ✍ if you enjoy this idea! Also share your ideas and charts in the comments section below! This is best way to keep it relevant, support us, keep the content here free and allow the idea to reach as many people as possible. **
-------------------------------------------------------------------------------
💸💸💸💸💸💸
👇 👇 👇 👇 👇 👇
DOW has a full Bull year ahead based on PRESIDENT'S CHEATSHEETDow Jones (DJI) has started the year on a positive note and that is anything but a coincidence. On this 1W chart you can see Dow's price action since the early 2009 bottom of the U.S. Housing Crisis.
That happened to be Obama's 1st year of Presidency. As you can see, 2009 was an incredibly bullish year with the index rising more than +60% from the year's bottom.
Four years later in 2013, which was the 1st year of Obama's 2nd term in office, Dow had again a strong year, rising by +25% (naturally the previous term was more aggressive as the market had tremendous upside potential to recover from one of the worst economic crises in history).
Moving forward again 4 years (2017), we can see yet another bullish (+35%) 1st year of Presidency, this time Trump's first term.
Biden also had his fair share of bullish 1st year of Presidency in 2021 (+23%).
The pattern is evident and shows the euphoria the market has when the U.S. President assumes his duties on his 1st year. It also shows that (excluding as mentioned 2009, which was natural to see a stronger recovery) on average it is fair to expect a price increase during the 1st year of around +25% to +30%.
In fact, the price action that led to the current 1st year of Presidency that has just started (Trump's 2nd term), is very similar to the one that preceded Obama's 2nd term (2013). Both formed a Channel Up after the 1W MA200 (orange trend-line) was tested and held. That pattern pushed the price higher until the 1st year of Presidency, that found the index on the 1W MA50 (blue trend-line). Even the 1W MACD sequences that preceded this, are similar between the two fractals.
As a result, investors have a strong reason to be bullish in 2025 and if pattern achieves the bear minimum of 2021 (+23%), we can expect to see 51000 by the end of the year.
-------------------------------------------------------------------------------
** Please LIKE 👍, FOLLOW ✅, SHARE 🙌 and COMMENT ✍ if you enjoy this idea! Also share your ideas and charts in the comments section below! This is best way to keep it relevant, support us, keep the content here free and allow the idea to reach as many people as possible. **
-------------------------------------------------------------------------------
💸💸💸💸💸💸
👇 👇 👇 👇 👇 👇
