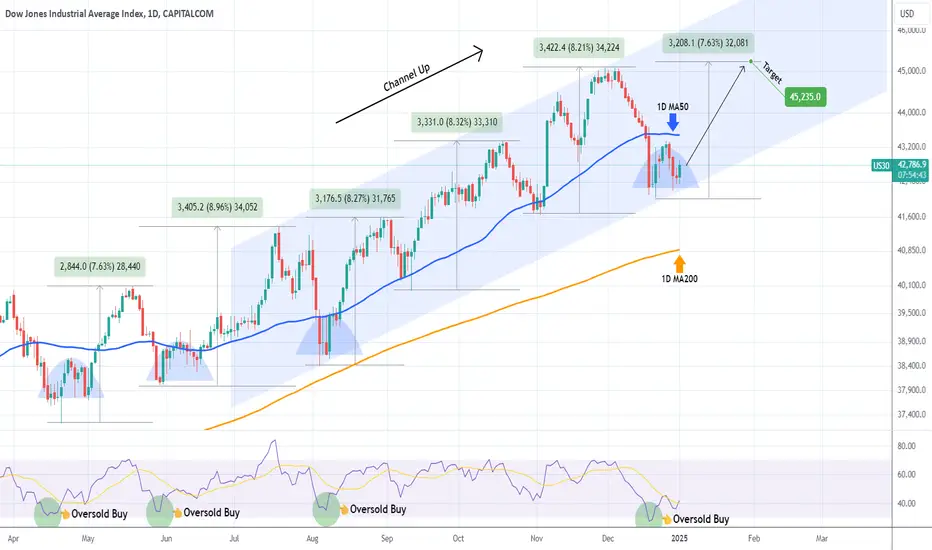
DOW JONES Bullish accumulation below the 1D MA50.Dow Jones (DJI) has been trading within a Channel Up since the July 18 High. Right now the price is consolidating between its bottom (Higher Lows trend-line) and the 1D MA50 (blue trend-line). At the same time, the 1D RSI breached the oversold barrier (30.00) and rebounded.
This trading sequence has presented the most efficient buy opportunity since April 19 2024 and the even though all Bullish Legs that followed have been a little over +8.00%, the weakest one has been +7.63%. As a result, our current Bullish Leg Target of 45235 is formulated out of that minimum.
-------------------------------------------------------------------------------
** Please LIKE 👍, FOLLOW ✅, SHARE 🙌 and COMMENT ✍ if you enjoy this idea! Also share your ideas and charts in the comments section below! This is best way to keep it relevant, support us, keep the content here free and allow the idea to reach as many people as possible. **
-------------------------------------------------------------------------------
💸💸💸💸💸💸
👇 👇 👇 👇 👇 👇
Dowsignals
DOW JONES What signals the top of this Cycle?Dow Jones (DJI) has been on a highly systematic pattern ever since the 2009 bottom of the U.S. Housing Crisis and this chart on the 3W time-frame depicts very accurately the symmetrical nature of the Cycles that the index is going through in the past 15 years.
As you see, ever since the October 2011 bounce on both the 3W MA50 (blue trend-line) and 3W MA200 (orange trend-line), Dow started a hyper aggressive Bull Cycle, which after making a Top on each phase, it broke below the 3W MA50 to become a buy opportunity again but has never yet broken below the 3W MA200.
So far we have completed three such phases and we are currently on the 4th. In the three that have already been completed, the Top of the Phase was signaled by the RSI. At a certain point that it broke above the 70.00 overbought barrier, it started a Channel Down comprised of 4 legs (a through d). On the (d) leg, it gave a signal that Dow had (or is very close to) topped. That was the ultimate long-term Sell Signal. Similarly, when the index broke below its MA50 and the RSI double bottomed, it has been the ultimate signal to buy.
Right now it appears that the RSI has completed Leg (a) and is starting the rise to Leg (b) of its newly emerged Channel Down. That means that the market has around another 12 months before it Tops again.
-------------------------------------------------------------------------------
** Please LIKE 👍, FOLLOW ✅, SHARE 🙌 and COMMENT ✍ if you enjoy this idea! Also share your ideas and charts in the comments section below! This is best way to keep it relevant, support us, keep the content here free and allow the idea to reach as many people as possible. **
-------------------------------------------------------------------------------
💸💸💸💸💸💸
👇 👇 👇 👇 👇 👇

DOW JONES 13-year pattern that never failed eyes $48000.Dow Jones (DJI) gave us the best bullish break-out signal exactly 1 year ago (December 13 2023, see chart below), as our buy entry at 36577 hit our 42900 long-term Target last October:
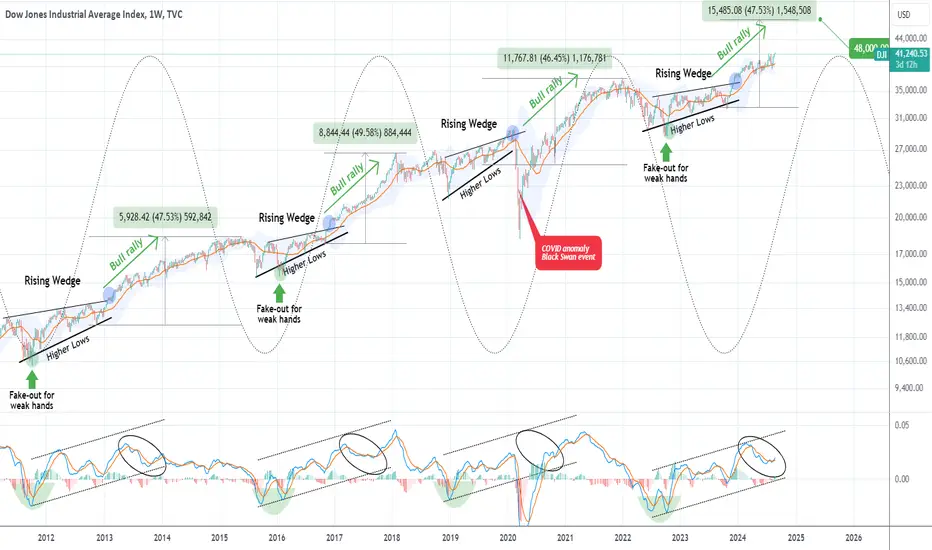
At that time we made a clear point why that rally 'shouldn't surprise you' and it is because of this pattern's consistency for so many years. This 1W time-frame chart shows the cyclical behavior of the index, which peaks (Sine Wave top), then pulls back and starts forming a Rising Wedge (Sine Wave bottom) and when it breaks above the Rising Wedge, is where it flashed the bullish break-out signal we got a year ago.
As you can see it then starts a gradual rise on the BB20 and completes the Cycle again (Sine Wave top) after roughly a +47% rally. The title mentions that this pattern 'never failed', practically it only broke during the COVID flash crash, which was a non-technical event than occurs once every 100 years. As you can see even the 1W MACD sequences between the cyclical patterns are identical.
As a result, our Target towards the Sine Wave peak is 48000. If this is achieved in Q2 2025, based on Dow's current Channel Up (dashed), then we expect the index to remain on those high levels but turn more neutral sideways towards the end of 2025 and then eventual start of the new Bear Phase.
-------------------------------------------------------------------------------
** Please LIKE 👍, FOLLOW ✅, SHARE 🙌 and COMMENT ✍ if you enjoy this idea! Also share your ideas and charts in the comments section below! This is best way to keep it relevant, support us, keep the content here free and allow the idea to reach as many people as possible. **
-------------------------------------------------------------------------------
💸💸💸💸💸💸
👇 👇 👇 👇 👇 👇

DOW JONES 25-year Cycles show the clear picture you should know.Almost 8 months ago (April 12, see chart below), just when Dow Jones (DJI) was recovering from April's correction, we sent a clear message not to lose sight of the greater picture and to stay bullish:
The reason was the index' clear cyclical pattern since the February 2009 bottom of the U.S. Housing Crisis. The index has grown by +17% since that analysis (from 38459 to 45080) and we can't see a reason not to complete the pattern and hit our 48850 Target, which is our projection for this Cycle's Top.
On this updated chart is on the 1W time-frame, in contrast with April's which was on the 1M, we have added to key elements. The Channel Up that is dictating the pace of the Bull Cycle since the Feb 2009 bottom and the Fibonacci retracement levels, which show that after the Bull Cycle topped, the subsequent Bear Cycle corrected within the 0.236 - 0.382 Fibonacci Zone at least before the bottom was formed.
In fact, all Cycles hit the 1M MA50 (blue trend-line) upon the Bear corrections and those didn't start before the 1W MA50 (red trend-line) was broken (1M candle close below). Our 48850 Target is technically the minimum estimate as that was the % rise of the previous one (Cycle 4), which was the least aggressive compared to others (Cycle 3 = +77.19%, Cycle 2 = +75.09%, Cycle 1 = +99.62%). If Cycle 5 peaks higher, we will draw the Fibonacci retracement levels from that top and re-adjust our expected 0.382 Fibonacci bottom for the Bear Cycle (or if the 1M MA50 gets hit first).
As far as timing of the Cycle 5 Top is concerned, we expect that to be on December 2025 the earliest, again based on the Cycle with the minimum time length (Cycle 3), excluding Cycle 1 which was the most aggressive as it was the first after the U.S. Housing Crisis bottom.
-------------------------------------------------------------------------------
** Please LIKE 👍, FOLLOW ✅, SHARE 🙌 and COMMENT ✍ if you enjoy this idea! Also share your ideas and charts in the comments section below! This is best way to keep it relevant, support us, keep the content here free and allow the idea to reach as many people as possible. **
-------------------------------------------------------------------------------
💸💸💸💸💸💸
👇 👇 👇 👇 👇 👇

DOW JONES High Channel Up symmetry points to 46000.Dow Jones (DJI) easily hit our 45000 Target as suggested on our November 20 idea (see chart below), and immediately turned sideways, consolidating basically for the past 6 days:
This is not the first time that we've come across this consolidation within the 4-month Channel Up as the exact same sequence was last seen during September 20 - October 08. As with today's price action, the consolidation also took place above the 1.0 Fibonacci level and once completed, it gave one final push to the 1.5 Fibonacci extension before correcting back to the 1D MA50 (blue trend-line).
As a result, we now set a new Target for the end of the year at 46000.
-------------------------------------------------------------------------------
** Please LIKE 👍, FOLLOW ✅, SHARE 🙌 and COMMENT ✍ if you enjoy this idea! Also share your ideas and charts in the comments section below! This is best way to keep it relevant, support us, keep the content here free and allow the idea to reach as many people as possible. **
-------------------------------------------------------------------------------
💸💸💸💸💸💸
👇 👇 👇 👇 👇 👇

DOW JONES is respecting our major August buy call beautifully.Dow Jones (DJI) is about to hit the 45000 Target on our last buy call (November 20, see chart below) and complete a +8.30% Bullish Leg rise within the Channel Up that started on the August 05 Low:
We are very pleased also to see the index making enormous progress after our big August buy (Aug 07 idea, see below) which was exactly on the last major Low of Dow:
As you can see, we successfully formulated that trade based on the extremely symmetric price action of 2016 - 2017. We've explained the notion on the previous idea, but we will refresh your memory if you read this analysis for the first time.
Dow was already trading within a Rising Wedge pattern in 2016, which towards its end broke upwards and first completed a +19.50% rally. The second Leg of the Bull rally was completed on a +30.70% rise from the pull-back Low and then the markets entered the multi-month volatile period of the U.S. - China trade wars. Key Lows of the Bull Rally were made in October 2016, April 2017 and the last in August 2017. It is important to note that after the August 2017 Low, the index had the most aggressive part of the rally, attached to the top band of the Bollinger Bands range, which is what we've called before "riding the BB wave".
Back to more recently and the Rising Wedge that started in 2022, it broke upwards in identical fashion as 2017 (first Leg +23.40%, Lows in October 2023, April 2024 and the most recent August 2024, which as you saw was our last major buy). Even the 1W RSI sequences between the two fractals are similar. What's left now is for Dow to complete a +30.70% rise from the August 2024 Low, in order to conclude the pattern from 2017.
Our long-term Target since August remains thus intact at 49000. Keep in mind that this is the essence of long-term investing/ trading and this is the strategy with the highest winning rate. Note also that if it takes the same time to conclude as the 2017 Leg did from the August 2017 Low (green Rectangle, 168 days), then the peak should be formed end of January/ early February 2025.
-------------------------------------------------------------------------------
** Please LIKE 👍, FOLLOW ✅, SHARE 🙌 and COMMENT ✍ if you enjoy this idea! Also share your ideas and charts in the comments section below! This is best way to keep it relevant, support us, keep the content here free and allow the idea to reach as many people as possible. **
-------------------------------------------------------------------------------
💸💸💸💸💸💸
👇 👇 👇 👇 👇 👇

DOW JONES 4H Golden Cross extending the rally.Dow Jones (DJI) gave us an excellent pre-election buy signal (October 29, see chart below) as it bottomed on the 0.5 Fibonacci retracement level and just below the 1D MA50 (red trend-line), in similar fashion as the September 11 Low, which then rallied to the 1.236 Fib extension:
As you can see, we hit our 44000 Target, which was again the 1.236 Fib ext, but a new bullish possibility emerges. The 4H RSI is about to turn bearish (below 45.00) after being overbought (above 70.00) for 7 days. Last time this happened was on August 22, the fractals are virtually identical. During that time, the price made a Higher Low and continued to peak after a +8.30% rise in total.
After another 0.5 Fib correction, the next Bullish Leg if the 3-month Channel Up was also +8.30%, indicating that there is high symmetry between the Legs of this pattern. Notice also the presence of a 4H Golden Cross both on the current as well as on the August Leg.
As a result, since we still have some distance before completing a +8.30% Bullish Leg increase, we go long again as long as the 4H MA50 (blue trend-line) holds, targeting 45000.
-------------------------------------------------------------------------------
** Please LIKE 👍, FOLLOW ✅, SHARE 🙌 and COMMENT ✍ if you enjoy this idea! Also share your ideas and charts in the comments section below! This is best way to keep it relevant, support us, keep the content here free and allow the idea to reach as many people as possible. **
-------------------------------------------------------------------------------
💸💸💸💸💸💸
👇 👇 👇 👇 👇 👇

DOW JONES Bottom is being formed. Buy for 44000 immediate TargetDow Jones (DJI) eventually made a bullish break-out on our last analysis (October 08, see chart below) and hit our 43200 invalidation Target:
The 3-month Channel Up is still holding and the price is now on the 4H MA200 (orange trend-line) and near the bottom (Higher Lows trend-line) of the pattern. The 4H RSI has completed a bottoming sequence similar to the September 11 Higher Low.
As long as the 1D MA50 (red trend-line) supports (closes 1D candles above), this will be a buy opportunity. Our Target is 44000, which is the 1.236 Fibonacci extension, similar with the previous Higher High.
-------------------------------------------------------------------------------
** Please LIKE 👍, FOLLOW ✅, SHARE 🙌 and COMMENT ✍ if you enjoy this idea! Also share your ideas and charts in the comments section below! This is best way to keep it relevant, support us, keep the content here free and allow the idea to reach as many people as possible. **
-------------------------------------------------------------------------------
💸💸💸💸💸💸
👇 👇 👇 👇 👇 👇

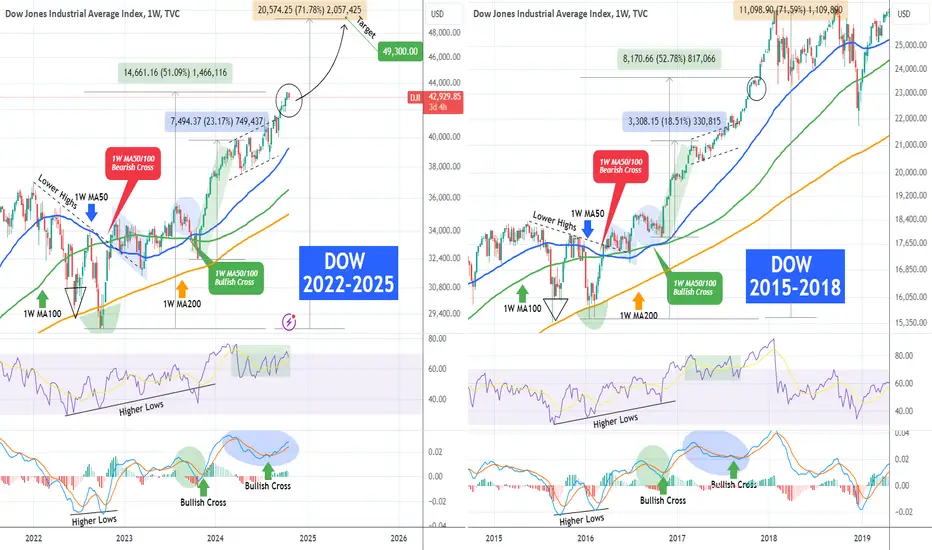
DOW JONES ahead of an huge rally based on the 2017 fractal.More than a year ago (September 13 2023, see chart below), we posted a long-term fractal comparison for Dow Jones (DJI) between the 2022 - 2025 and 2015 - 2018 periods:
As you can see the 1W MA50/100 Bullish Cross eventually placed the index on a huge rally (even though it had to go lower for a month) that hit Target 1 at 42000. The 1W RSI and MACD sequences in 2024 however evolved in such a how that we have to re-adjust the patterns in order to fit the 2017 price action.
The charts now display very symmetric fractals and it appears that we are now on a short-term consolidation (circle) after a +50% rise from the September 2022 bottom. In November 2017, that was the final consolidation before the most aggressive rally of the Bull Cycle that made Dow top and then pull back to test its 1W MA50 (blue trend-line).
As a result, we move our final target even higher at 49300, which represents a +71% rise from the 2022 bottom, similar to the rise that priced the January 2018 High.
-------------------------------------------------------------------------------
** Please LIKE 👍, FOLLOW ✅, SHARE 🙌 and COMMENT ✍ if you enjoy this idea! Also share your ideas and charts in the comments section below! This is best way to keep it relevant, support us, keep the content here free and allow the idea to reach as many people as possible. **
-------------------------------------------------------------------------------
💸💸💸💸💸💸
👇 👇 👇 👇 👇 👇
DOW JONES 15 year cheat-sheet that can make you rich!Dow Jones (DJI) is extending what seems a relentless rally since the August 05 Low, which was the most recent short-term correction, but in reality the index has been rallying very aggressively since the October 23 2023 Low.
That was when after a 3-month correction, it found Support above the 1W MA200 (orange trend-line) and 2 weeks later it reclaimed the 1W MA50 (blue trend-line), which has been supporting ever since. So basically the index has been on a 1W MA50 Support for 1 whole year!
What's more striking however and what short-term traders/ investors tend to ignore are the long-term Cycles of a financial asset. And Dow being one, is no exception. As mentioned, the 1W MA200 supported the October 23 2023 Low and in effect has been holding since October 10 2022 (so for 2 full years!), two weeks after the Inflation Crisis bottom. Since then we have been inside a Bull Phase.
This is part of a greater trading Cycle for Dow, one that started 1 year after the March 2009 market bottom of the historic Housing Crisis. As you can see, the pattern is recurring and the phases have a high symmetry and frequency among them.
First and foremost, they tend to do two Lows within a 1 year span, which is essentially the Bear Phase, which finds Support on the 1W MA200 (exception was of course the Black Swan of the COVID flash crash but it is of course a non-technical irregularity event) and then rebounds, effectively starting the Bull Phase.
The first 2 Bull Phases rose by +75.80%, while the most recent by +70.80%, so we are roughly around the same strength levels. Also as far as duration is concerned, the 1st Bull Phase lasted for 1239 days (177 weeks), the 2nd for 1134 days (162 weeks) and the 3rd for 1106 days (158 weeks). Again the time element is quite similar. Notice also the similar pattern that the 1W MACD prints every time Dow enters the final part of the Bull Phase.
As a result, if we apply those dynamic conditions on the current Bull Phase, we can see that a minimum rise of +70.80% from the bottom, should peak a little over 48000, and if it last a minimum of 1106 days (158 weeks) it should come to an end and price the top by October 06 2025.
This indicates that we have at least another full year of bullish trend ahead of us and a fair Target could be 48000.
As you realize, investors who are methodically following this 15 year old cheat-sheet, know where and when to buy/ sell and that achieves investing's two main principles: Profit Maximization and Risk Management. Patience and proper management within such Cycles are what "can make you rich" indeed.
-------------------------------------------------------------------------------
** Please LIKE 👍, FOLLOW ✅, SHARE 🙌 and COMMENT ✍ if you enjoy this idea! Also share your ideas and charts in the comments section below! This is best way to keep it relevant, support us, keep the content here free and allow the idea to reach as many people as possible. **
-------------------------------------------------------------------------------
💸💸💸💸💸💸
👇 👇 👇 👇 👇 👇

DOW JONES Short-term correction or invalidation?Dow Jones (DJI) has been trading within a Channel Up ever since the August 05 bottom and right now finds itself below the 4H MA50 (blue trend-line). This is because based on the Higher Highs sequence, the pattern has topped and is potentially looking for the new Higher Low.
As long as the 42400 Resistance is holding, we will be expecting a short-term correction towards the 4H MA200 (orange trend-line), with a projected Low around 41600. Note that it will be above the 0.5 Fibonacci retracement level, where the September 11 Higher Low was priced.
If the 42400 Resistance, which we call the invalidation level for shorts, breaks first then we will take the loss on the short and turn bullish instead. The last Higher High was priced marginally above the 1.236 Fibonacci level, so that will be our Target (43200).
-------------------------------------------------------------------------------
** Please LIKE 👍, FOLLOW ✅, SHARE 🙌 and COMMENT ✍ if you enjoy this idea! Also share your ideas and charts in the comments section below! This is best way to keep it relevant, support us, keep the content here free and allow the idea to reach as many people as possible. **
-------------------------------------------------------------------------------
💸💸💸💸💸💸
👇 👇 👇 👇 👇 👇

DOW JONES Pull-back possible but maintain long-term perspectiveA little more than 2 months ago (July 25, see chart below) we argued that Dow Jones' (DJI) correction wasn't over and called for a deeper buy, setting then a long-term Target of 42400:
The Target got finally hit on Friday, giving us an excellent risk/ reward ratio on our investment. As however the price almost reached the top of the 2-year Channel Up, we have to issue a warning for a potential short-term correction.
The 1D MA50 (blue trend-line) has successfully supported on September 11 last time and won't be odd to see another re-test after almost a month. The similarities after all between the first part of the 2-year Channel Up and the second (the one we're currently in) are still noticeable and on 1D RSI terms we may be symmetrically around the November 20 2023 level.
However, we may see this time the Channel Up break to the upside for the first time after the elections. Regardless of the short-term volatility, our medium-term Target as we will be heading into December is 44500. That is the 2.5 Fibonacci extension, similar to where the April 01 High was priced.
-------------------------------------------------------------------------------
** Please LIKE 👍, FOLLOW ✅, SHARE 🙌 and COMMENT ✍ if you enjoy this idea! Also share your ideas and charts in the comments section below! This is best way to keep it relevant, support us, keep the content here free and allow the idea to reach as many people as possible. **
-------------------------------------------------------------------------------
💸💸💸💸💸💸
👇 👇 👇 👇 👇 👇

DOW JONES shows no signs of slowing down.Those of you who are worried if the upcoming November U.S. Presidential Elections or medium-term pull-backs (such as those of July and April 2024 or August - October 2023), pose a threat to your investments, you have a strong reason to relax and feel safe and that is the current chart.
On this 1M time-frame analysis, we see Dow Jones (DJI) in almost the past 30 years (since late 1997) and the Cycles that have defined its Tops and Bottoms. As you can see, initially there is a clear (green) Channel Up that is always trading above the 1M MA50 (blue trend-line), leading to the eventual Top, which in turn initiates the Bear Cycle (red Arc).
The use of the Sine Waves make a great fit for the bottoms in particular. It is interesting to mention that the time period between the end of each (green) Channel Up and the start of the next one is approximately 40 months (3.3 years). Also since the 2008 Housing Crisis, we can see that a wide Channel Up has been the dominant pattern driving the expansion of Dow.
With the above information in mind, we can reach the conclusion that the index is only now entering that aggressive green Channel Up of the Bull Cycle, meaning that the Cycle is far from over and if anything, we are approaching its middle. In fact, the 3.3 year (40 month) time gap has just been completed, so there is a full Channel Up expansion ahead of us.
Now, how high can that get? Well if each Bullish Leg of the 2008 emerged Channel Up is 40% less than the previous, then we are looking for at least a +100% rise from the September 2022 bottom, giving us a rough 57000 Target on a 5-year horizon. Again that doesn't mean that we won't have medium-term pull-backs (like those mentioned in the opening paragraph) along the way, they are necessary and they reset the prices in order to attract more liquidity and investors, but on the long run you can feel comfortable holding your stocks.
-------------------------------------------------------------------------------
** Please LIKE 👍, FOLLOW ✅, SHARE 🙌 and COMMENT ✍ if you enjoy this idea! Also share your ideas and charts in the comments section below! This is best way to keep it relevant, support us, keep the content here free and allow the idea to reach as many people as possible. **
-------------------------------------------------------------------------------
💸💸💸💸💸💸
👇 👇 👇 👇 👇 👇

DOW JONES Is a post Fed decline valid before an October rally?The day has come when the Fed will finally cut the Interest Rates for the first time since the early 2022 hike cycle and the question in the market is whether it will be by -0.25% or -0.5%.
High volatility is expected intra-day but technically Dow Jones (DJI) remains within an uptrend (Channel Up) both medium-term (5-months) and long-term (2 years). The last support and bounce was offered by the 1D MA50 (blue trend-line) on September 11 and that broke the remarkable symmetry that the index had so far with the March - August 2023 fractal.
That fractal suggested that after a (dotted) Channel Up, the index should make a correction below the 1D MA200 (orange trend-line) but on September 11 instead of breaking below the 1D MA50, the index rebounded (as mentioned above) and diverged from the fractal.
This means that the Bullish Led (green Channel Up) may this time start earlier and the rally may break above the 2-year Channel Up and finally deliver a new long-term pattern, possibly more aggressive.
Seasonality however is a big factor for investors and as we can see, the last two Septembers (2023, 2022) have been bearish, extending corrections that started in August but eventually managed to price a bottom in October.
As a result, any remark by Chair Powell during the press conference that isn't well received by the market, can initiate a short-term pull-back towards the 1D MA200, ranging from -5.07% to -6.90%.
In our opinion, if that takes place, it will be a tremendous buy opportunity until at least the end of the year. If however Powell delivers what the market is expecting (and more), we expect the pattern to continue its divergence from the 2023 fractal and enter the more aggressive bullish pattern earlier. If the more aggressive pattern prevails, a 46000 target is very probable by the end of the year.
Notice that this divergence is also evident when comparing the 1D RSI sequences of the two fractals.
-------------------------------------------------------------------------------
** Please LIKE 👍, FOLLOW ✅, SHARE 🙌 and COMMENT ✍ if you enjoy this idea! Also share your ideas and charts in the comments section below! This is best way to keep it relevant, support us, keep the content here free and allow the idea to reach as many people as possible. **
-------------------------------------------------------------------------------
💸💸💸💸💸💸
👇 👇 👇 👇 👇 👇

DOW JONES Nothing has changed. Bull trend intact and eyes 48000.Dow Jones (DJI) is having yet again short-term volatility following the August 30 All Time High (ATH), but as we explained last week this is natural, since the medium-term Channel Up hit its top and was looking for the 1D MA50 for buyers and a Higher Low potentially a little lower.
On the longer term though, the trend is intact and is heavily bullish. The 1W MA50 (blue trend-line) is holding and as long as it supports, there is no evidence showing a correction. In fact, this is the exact same pattern that the index has been following since the 2009 bottom of the U.S. Housing Crisis.
As you can see on this 1W chart, the market first bottoms on the 1W MA200 (orange trend-line) and starts a recovery phase by breaking above the 1W MA50. After a lengthy consolidation on it with a few tests (to confirm it as Support), it enters a structured Channel Up until the Cycle's peak. The first two Cycles rose by exactly +75% from their bottom to top, while the COVID one peaked at +70%.
As a result, assuming a minimum +70% rise for this Cycle also, we can target at least 48000. It appears that the index is currently past half-way through the Cycle, already within the standard Channel Up.
In addition, you can observe the similarities between the Cycles on the 1W RSI fractals as well, which tend to 'cool down' once this Channel Up starts forming.
-------------------------------------------------------------------------------
** Please LIKE 👍, FOLLOW ✅, SHARE 🙌 and COMMENT ✍ if you enjoy this idea! Also share your ideas and charts in the comments section below! This is best way to keep it relevant, support us, keep the content here free and allow the idea to reach as many people as possible. **
-------------------------------------------------------------------------------
💸💸💸💸💸💸
👇 👇 👇 👇 👇 👇

DOW JONES correction to extend until the Fed.Dow Jones (DJI) did what we expected of it 3 weeks ago (August 13, see chart below) and after pricing a Higher Low at the bottom of the 5-month Channel Up, it rebounded and reached the All Time High (ATH), pricing a Higher High:
In continuation of that analysis, we now expect the new Bearish Leg to extend to possibly as low as the 0.618 Fibonacci retracement level, which was the case with the May 30 pull-back.
The 1D RSI suggests that a 35.00 value would be ideal to signal a buy (same as May 30, see how both RSI fractals priced the top on the 70.00 overbought limit), while a Bullish Cross on the 1D MACD would be the final confirmation of the buy.
Our long-term Target remains 42400 (+11.00% from the Higher Low, the same % rise as the July 18 High).
-------------------------------------------------------------------------------
** Please LIKE 👍, FOLLOW ✅, SHARE 🙌 and COMMENT ✍ if you enjoy this idea! Also share your ideas and charts in the comments section below! This is best way to keep it relevant, support us, keep the content here free and allow the idea to reach as many people as possible. **
-------------------------------------------------------------------------------
💸💸💸💸💸💸
👇 👇 👇 👇 👇 👇

DOW JONES The pattern that never failed is now targeting 48000Dow Jones (DJI) gave us the best bullish break-out signal of the year 8 months ago (December 13 2023, see chart below), as our buy entry at 36577 is very close to hitting our 42900 Target:
At that time we made a clear point why that rally 'shouldn't surprise you' and now you see why. This 1W time-frame chart shows the cyclical behavior of the index, which peaks (Sine Wave top) then pulls back and starts forming a Rising Wedge (Sine Wave bottom) and when it breaks above the Rising Wedge, is where it flashed the bullish break-out signal we got back in December.
As you can see it then starts a gradual rise on the BB20 and completes the Cycle again (Sine Wave top) after roughly a +47% rally. The title mentions that this pattern 'never failed', in practice it only broke during the COVID flash crash, which is a non-technical event than occurs once every 100 years. As you can see even the 1W MACD sequences between the cyclical patterns are identical.
As a result, our Target towards the Sine Wave peak is 48000.
-------------------------------------------------------------------------------
** Please LIKE 👍, FOLLOW ✅, SHARE 🙌 and COMMENT ✍ if you enjoy this idea! Also share your ideas and charts in the comments section below! This is best way to keep it relevant, support us, keep the content here free and allow the idea to reach as many people as possible. **
-------------------------------------------------------------------------------
💸💸💸💸💸💸
👇 👇 👇 👇 👇 👇
DOW JONES Don't lose sight of the great picture. Still bullish.Last week, while Dow Jones (DJI) was still under its 1D MA50, we called for a major rally, as technically the 5-month Channel Up has just priced its new Higher Low:
The index has now almost reached the Target of the first Bullish Leg of this pattern, pointing to a potential relief next.
On the larger picture however (1M time-frame), we had posted an article named 'Secret Cycles' on April 12 2024 (see chart below), during Dow Jones' previous pull-back that again inflicted fear in the markets, calling for a strong buy:
It is this chart that we revisit and expand up today, as we don't think the long-term trend has changed. We want to maintain a clear long-term perspective and following August's massive recovery 1M candle, we believe that Dow will enter by Q4 2024, the final stage (rally) of its current Cycle.
That has historically been 1 year at least, so as long as the index keeps holding and closing the monthly candles above the 1M MA50 (red trend-line), we will continue buying all monthly dips. Our 48850 long-term Target is intact.
-------------------------------------------------------------------------------
** Please LIKE 👍, FOLLOW ✅, SHARE 🙌 and COMMENT ✍ if you enjoy this idea! Also share your ideas and charts in the comments section below! This is best way to keep it relevant, support us, keep the content here free and allow the idea to reach as many people as possible. **
-------------------------------------------------------------------------------
💸💸💸💸💸💸
👇 👇 👇 👇 👇 👇

DOW JONES New Bullish Leg to beginLast week (August 07, see chart below) we made a long-term case of why Dow Jones (DJI) is poised to technically start a new aggressive rally 'right under our nose' and before that (July 25, see chart below), why at the time the correction wasn't over:
As you can see, the index found support on our low tier near the 1D MA200 (orange trend-line) and as the April 19 Low, it touched the 0.5 Fibonacci retracement level of the 2-year Channel Up (chart 2 above).
Back to today's analysis, the price has already rebounded at the bottom of April's Channel Up and has found its first Resistance on the 1D MA50 (blue trend-line). The final confirmation of this Bullish Leg will be when the 1D MACD forms a Bullish Cross as it did on June 18 and April 25.
Since the Bearish Legs of this Channel Up have been almost the same percentage wise (-6.84%) we expect the Bullish Legs to be too. With the first Bullish Leg being at +11.13%, our medium-term Target is 42400 (just below a potential +11.13% rise).
-------------------------------------------------------------------------------
** Please LIKE 👍, FOLLOW ✅, SHARE 🙌 and COMMENT ✍ if you enjoy this idea! Also share your ideas and charts in the comments section below! This is best way to keep it relevant, support us, keep the content here free and allow the idea to reach as many people as possible. **
-------------------------------------------------------------------------------
💸💸💸💸💸💸
👇 👇 👇 👇 👇 👇

DOW JONES Any pull-back is a short-term buy opportunity.The Dow Jones Industrial Average Index (DJIA) is completing an Inverse Head and Shoulders (IH&S) pattern following the recovery of its 4H MA50 (blue trend-line). Since the dominant medium-term pattern since the April 19 Low is a Channel Up, any pull-back this short-term IH&S offers, is a technical buy opportunity.
The previous Channel Up Higher Low of May 30 offered one final Higher Low pull-back below the 4H MA50 before the new Bullish Leg started towards the Channel's top (Higher Highs trend-line). Check how their 1D RSI fractals are similar among the two sequences.
As a result, once today's Fed euphoria recedes, we expect one last buy opportunity to emerge with a short-term Target of 42000 (top of blue Channel Up), if note higher on the Diverging Channel Up.
-------------------------------------------------------------------------------
** Please LIKE 👍, FOLLOW ✅, SHARE 🙌 and COMMENT ✍ if you enjoy this idea! Also share your ideas and charts in the comments section below! This is best way to keep it relevant, support us, keep the content here free and allow the idea to reach as many people as possible. **
-------------------------------------------------------------------------------
💸💸💸💸💸💸
👇 👇 👇 👇 👇 👇

DOW JONES Correction isn't over yet. See where to buy.The Dow Jones Industrial Average Index (DJIA) made initially a direct hit on our July 05 (see 1st chart below) 41000 Target and following the rejection then, is on its way of hitting the 39200 downside Target (July 17, 2nd chart below) as well:
Zooming out to the long-term pattern again after a while, we can still see that the dominant technical structure is a Channel Up that first started on the September 30 2022 inflation crisis bottom.
On the more medium-term, we can isolate a (dashed) Channel Up that started on the April 19 2024 Low. It appears that the current correction is technically its new Bearish Leg. Symmetrically, we should be expecting the new Higher Low to make contact with the 1D MA50 (blue trend-line). That is our first buy entry.
The second is just below the 0.5 Fibonacci Channel level, which can potentially make near contact with the 1D MA200 (orange trend-line), a strong long-term Support. That scenario is drawn based on the October 27 2023 bottom which was after a symmetrical correction (-9.25%) with the March 20 2023 bottom. Similarly, the current Bearish Leg could be symmetrical (-6.84%) with the correction that led to the April 18 2024 Low.
For both buy entries, our new long-term Target will be 42400 (Higher High on the medium-term Channel Up).
-------------------------------------------------------------------------------
** Please LIKE 👍, FOLLOW ✅, SHARE 🙌 and COMMENT ✍ if you enjoy this idea! Also share your ideas and charts in the comments section below! This is best way to keep it relevant, support us, keep the content here free and allow the idea to reach as many people as possible. **
-------------------------------------------------------------------------------
💸💸💸💸💸💸
👇 👇 👇 👇 👇 👇

DOW JONES Top of its Channel. Sell opportunity.The Dow Jones Industrial Average Index (DJIA) hit our 41000 Target as projected on our last analysis (July 10, see chart below) and reached the top (Higher Highs trend-line) of the 3-month Channel Up:
The Bullish leg competed a rise around the same levels as the previous one (7.87% against 7.65%), so we can assume the symmetry will continue to shape within this pattern and affect the Bearish Legs too.
The previous Bearish Leg made a -5.14% decline. Our Target is 39200, marginally above the 0.618 Fibonacci retracement level.
-------------------------------------------------------------------------------
** Please LIKE 👍, FOLLOW ✅, SHARE 🙌 and COMMENT ✍ if you enjoy this idea! Also share your ideas and charts in the comments section below! This is best way to keep it relevant, support us, keep the content here free and allow the idea to reach as many people as possible. **
-------------------------------------------------------------------------------
💸💸💸💸💸💸
👇 👇 👇 👇 👇 👇

DOW JONES Looking to break above the 3-month Triangle.The Dow Jones Industrial Average (DJIA) has been consolidating within an Ascending Triangle since the April 01 High and recently is being supported by the 4H MA50 (blue trend-line) since June 17.
As long as it continues to hold, there are higher probabilities to finally break above the Triangle's top (Resistance 1). If it does, the pattern will transition into a Channel Up that will aim for a new Higher High.
The first Bullish Leg extended to as high as +7.52%. The 1.382 Fibonacci extension is technically the break-out target on these occasions, so our Target is in the middle of those levels at 41000.
-------------------------------------------------------------------------------
** Please LIKE 👍, FOLLOW ✅, SHARE 🙌 and COMMENT ✍ if you enjoy this idea! Also share your ideas and charts in the comments section below! This is best way to keep it relevant, support us, keep the content here free and allow the idea to reach as many people as possible. **
-------------------------------------------------------------------------------
💸💸💸💸💸💸
👇 👇 👇 👇 👇 👇
