Dow Jones: Explosive US30 Trade Setup – Entry,Trap & Exit Mapped💎 Dow Jones Robbery Blueprint: The US30 Vault Crack Plan 💎
(Maximized for reach — within TradingView title limit)
🌟Hi! Hola! Ola! Bonjour! Hallo! Marhaba!🌟
Dear Market Robbers & Money Movers 🕵️♂️💰🚨
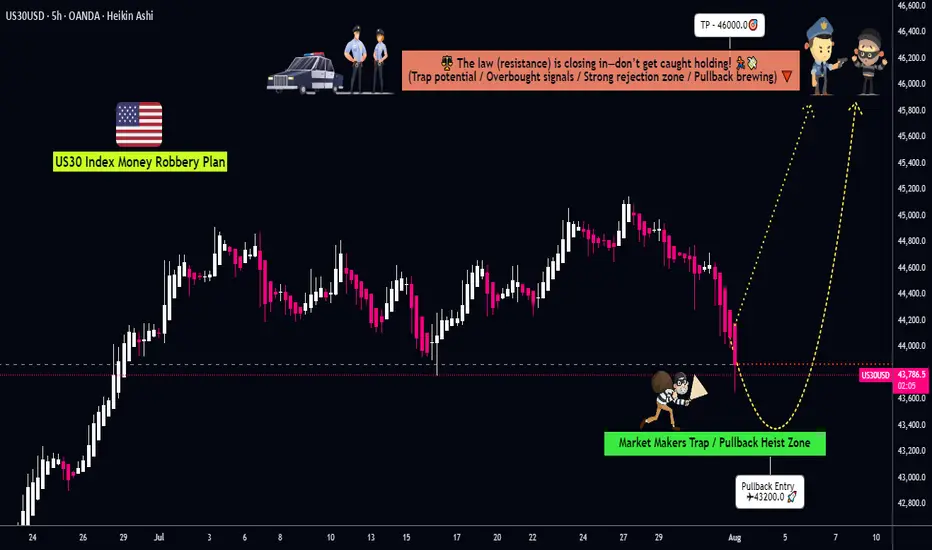
This ain't your average analysis — it’s a Thief Trader-style 🔥tactical mission🔥 aimed at the mighty "US30/DJI" (Dow Jones Industrial Average). We're talkin' about a precision heist with a full blueprint: entry zones, trap setups, and escape exits. Read carefully — this ain’t for the faint-hearted traders! 🧠🦾
🧠 Entry Zones (The Break-In) 📈
🛠 ENTRY 1: Candle wick near 44200.0 – that’s the resistance gate. Wait for confirmation.
🎯 ENTRY 2: Sneak in at the Market Makers’ Trap around 43200.00 – a dirty zone where retailers get baited. Perfect time to strike long!
🧱 DCA/Layering strategy recommended. Stack those buy orders like a thief layering explosives on a safe. 💣💸
🛑 Risk Levels (Escape Routes/Stop Loss)
🔊 "Listen up, vault raiders! Never drop your SL until breakout is confirmed. If you jump early, you might land in a bear trap! 🪤"
🔐 Stop Zones (Based on Strategy):
🔐 Max Risk SL (5H TF): If you're deep, your last stand is at 43000.0
☝️ SL depends on your position sizing, number of entries, and risk appetite. Trade like a thief, not a gambler.
🎯 Heist Target (Profit Exit)
🏁 Escape Point: 46000.0 — or exit before heat rises! Don’t be greedy. Rob and vanish. 💨💰
🔥 Market Mood: Why the Heist Is On
"US30/DJI" is bullish AF — thanks to:
📊 Macro-Economic Wind at Our Back
📈 Institutional momentum
📰 Strong sentiment and intermarket flows
Check your chart radar: Fundamentals + technicals aligning = green light for robbery! 🟢
⚠️ Tactical Reminder: News Can Jam the Plan
📵 Avoid new entries during major economic releases
🛡 Use trailing SLs to protect running trades
Stay alert, stay alive. 💡
❤️ Support the Robbery Crew
Hit that 💥BOOST💥 — your love fuels our next mission.
Join us and ride daily heist plans with Thief Trading Style 🏴☠️🚀💰
Dowtheory
EURUSD📉 EURUSD – 30min Short Plan
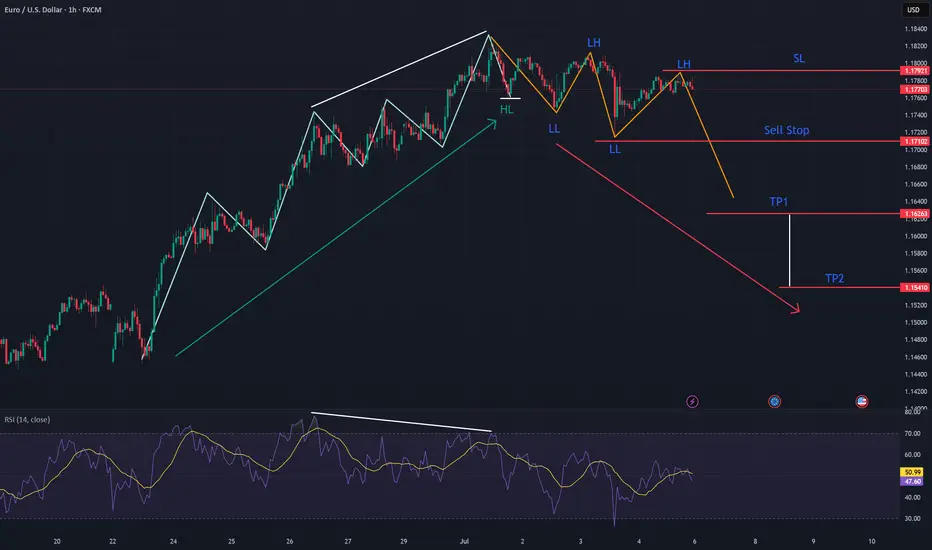
📊 Structure: LLs & LHs forming – bearish trend confirmed
🕯️ Pattern: Bearish Engulfing at Lower High
🎯 Entry: instant
📌 Trade 1
– 🎯 TP1: 1:1
– ⚠️ Risk: 1%
📌 Trade 2
– 🎯 TP2: larger reward
🛠️ Execution:
– Place both trades at same entry
– Trail SL after TP1 hit
📎 Bias: Bearish

EURUSD: Potential Trend Reversal BrewingEURUSD is exhibiting clear signs of a potential trend reversal, having recently broken its previous Higher Low and subsequently establishing a sequence of Lower Highs and Lower Lows. This shift in market structure from bullish to bearish is a strong indicator of weakening upside momentum. Further confirming this outlook, the RSI is displaying a notable bearish divergence, where price registers higher highs while the RSI prints lower highs, signaling diminishing bullish strength at these elevated price levels. Considering this confluence of technical factors, a potential short setup is present.

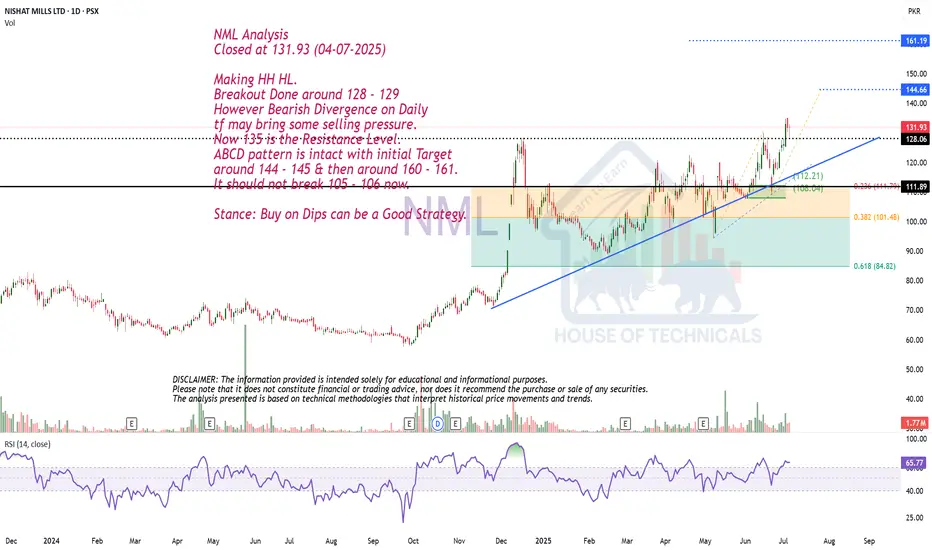
Making HH HL.NML Analysis
Closed at 131.93 (04-07-2025)
Making HH HL.
Breakout Done around 128 - 129
However Bearish Divergence on Daily
tf may bring some selling pressure.
Now 135 is the Resistance Level.
ABCD pattern is intact with initial Target
around 144 - 145 & then around 160 - 161.
It should not break 105 - 106 now.
Stance: Buy on Dips can be a Good Strategy.
XAUUSD - Trading Plan 4-Hour Analysis and ProjectionThis 4-hour candlestick chart of Gold against the US Dollar highlights key Wyckoff market phases and technical levels that frame the current market structure. The analysis identifies significant points including the Buying Climax (BC), Upthrust (UT), Second Test (ST), and Automatic Reaction (AR), which mark essential phases of accumulation and distribution.
Multiple Dow swing counts (Dow-1, Dow-2, Dow-3) are annotated with various colors, illustrating the market’s internal structure and momentum shifts. The chart shows a failed upthrust after distribution, signaling a likely bearish pressure following the attempt to push prices higher.
The current price action indicates a potential retracement to the support zone near the Automatic Reaction level, followed by possible continuation up to recent highs. The plan suggests watching for a minor pullback around area A, after which a bullish move is expected to resume, targeting higher resistance levels as indicated by the projected price movement arrows.
This trading plan emphasizes careful observation of price reactions around key support and resistance levels derived from Wyckoff methodology phases, aiming to capture potential bullish continuation or prepare for bearish scenarios if support fails.
==============
Dow Theory & Wyckoff

Wait for HL to Print.BFAGRO Closed at 40.95 (30-06-2025)
Now wait for HL to print. First support is around 40 and next one is around 38 - 38.50

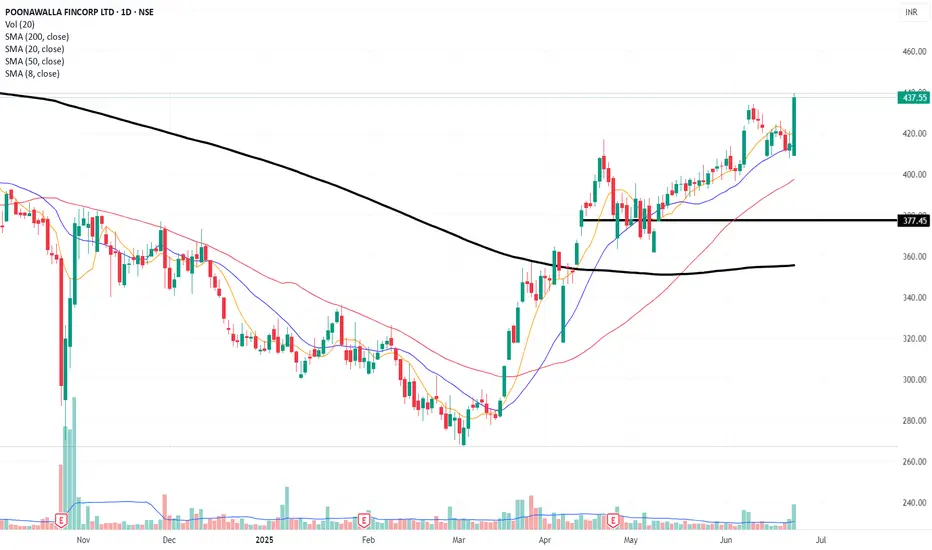
Poonawalla Fincorp Shows Strong Momentum: A Potential Buy Opport
Poonawalla Fincorp has demonstrated notable strength in its price movement over the past few weeks. After a brief retracement to its 20-day moving average (DMA), the stock has resumed its upward trajectory, accompanied by high trading volumes. This resurgence signals significant buying interest, indicating a potential opportunity for investors.
Given the stock's positive momentum, it is advisable to closely monitor Poonawalla Fincorp. A strategic entry point could be considered, with a stop-loss around ₹405. For potential gains, the stock has a target range of ₹475 to ₹500, offering a favorable risk-to-reward scenario.
Stock is in DownTrend but ..4013 CMP 254.20 (15-06-2025)
Stock is in DownTrend but it Beautifully hit Channel
Bottom & Bounced.
Currently at a Good Support level.
Now the Immediate Resistance is around 256 - 257
& then around 270.
Crossing this level & Sustaining on Monthly basis would
lead it towards 283 - 285 initially.
However, should not break 253 - 254.

Price moved up as expected.
Closed at 41.52 (05-06-2025)
Price moved up as expected.
However, 45 is still the resistance,
which needs to cross and let the stock
print HH.
Though there is still a bearish divergence
so the price may see some down side, but
It is safe as long as it is above 33.

XAUUSD🟡 XAUUSD Bullish Trade Plan – 4H Timeframe
📊 Market Structure: Higher Highs & Higher Lows (HH-HL) following Dow Theory
📐 Trendline Breakout confirmed by strong bullish candle
🕓 Timeframe: 4H
🟢 Entry Price (EP): 3379.052
🔴 Stop Loss (SL): 3269
🎯 Take Profit 1 (TP1): 3486.163 – 🟰 Risk:Reward 1:1
🥇 Take Profit 2 (TP2): 3607 – 🟰 Risk:Reward 1:2
📌 Open Two Trades:
🔸 Trade 1: Target TP1 to secure quick 1:1 profits
🔸 Trade 2: Target TP2 for extended 1:2 gains
🔄 Once TP1 is hit, shift SL of Trade 2 to Entry 🔁
📈 Continue trailing SL upward if momentum persists beyond TP2
⚡ Clean structure, trend alignment, and solid risk control – strong long setup! 🚀

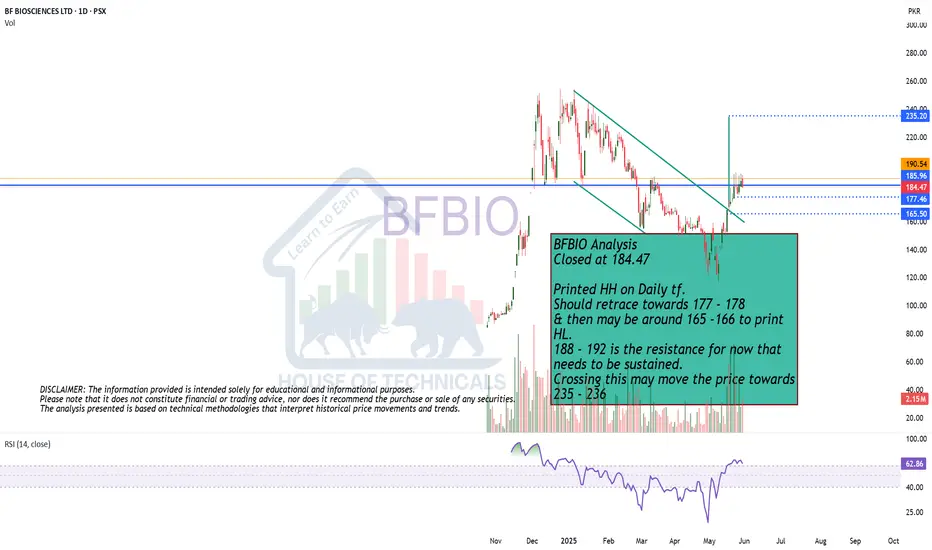
Printed HH on Daily tf.
Closed at 184.47
Printed HH on Daily tf.
Should retrace towards 177 - 178
& then may be around 165 -166 to print
HL.
188 - 192 is the resistance for now that
needs to be sustained.
Crossing this may move the price towards
235 - 236
GBPUSD - SO MANY BULLISH SIGNS ! confirmed TPs HIT GBPUSD- Market is moving in a Bullish Channel since long. Market has formed Bullish continuation pattern and that's how we can predict a projection of TPs which is also well within a channel. Market has also retraced and bounced back from the FIB LEVEL of 0.382 which is also a good support level followed by the 3 white soldiers pattern.
ENTRY POINT & STOPLOSS with TPs :
we plan entry on the break out of resistance level (market has instant entry point) which is break of HH and keeping our SL below the HL / FIB 0.382 level or the resistance level.

HH HL intact.FLYNG Closed at 50.80 (25-05-2025)
HH HL intact.
No Bearish Divergence yet on bigger tf.
54- 56 is the resistance for now.
If this level is crossed with Good Volumes,
we may witness further New Highs around 60+
On the flip side, 49 - 49.50 & then 47 - 47.50
may act as Good Support Levels.
However, breaking 45 will bring more Selling Pressure
towards 42 - 44

Higher High Higher Low intact!BFBIO Closed at 185.09 (25-05-2025)
Important to Cross & Sustain 188 - 189
o Monthly basis; only then it may move towards
215+
On the flip side, Important Support seems to be
around 164 - 169 and then 156 - 157

Though still in Uptrend, but BNL Closed at 37.39 (25-03-2025)
Though still in Uptrend, but
as mentioned earlier, bearish divergence
has started appearing on bigger tf, so
cautious approach should be taken.
It may re-test 35.20 - 36.20 & bounce as this
is an important Support level.
Otherwise next Support seems to be around
32.30 - 32.50

Things are looking UPSUnited Parcel Service served as one of our canaries in the coal mine, signalling that the real economy was much weaker than what the Biden administration was reporting. The figures presented were positively skewed, masking the harsh reality that we were all facing difficult times.
We recognized the head and shoulders topping pattern and warned that an economic disaster was approaching us. This ultimately led to the Trump tariff panic that caused the collapse of equities.
The thesis indicated a lack of confirmation regarding rising index prices; however, consumers were feeling the pressure, which manifested in reduced consumption and, consequently, fewer deliveries.
A modern Dow Theory if you will.
As we near new peaks in the stock market, I am convinced that our economy is on a much more solid foundation, poised to benefit Main Street instead of just a handful of monopolistic tech giants. Since equities are forward-looking, stocks are anticipating an exhilarating 2026!
I believe UPS will confirm this economic recovery as we head towards my long anticipated and forecast DOW JONES price of 64,000 likely by 2030.

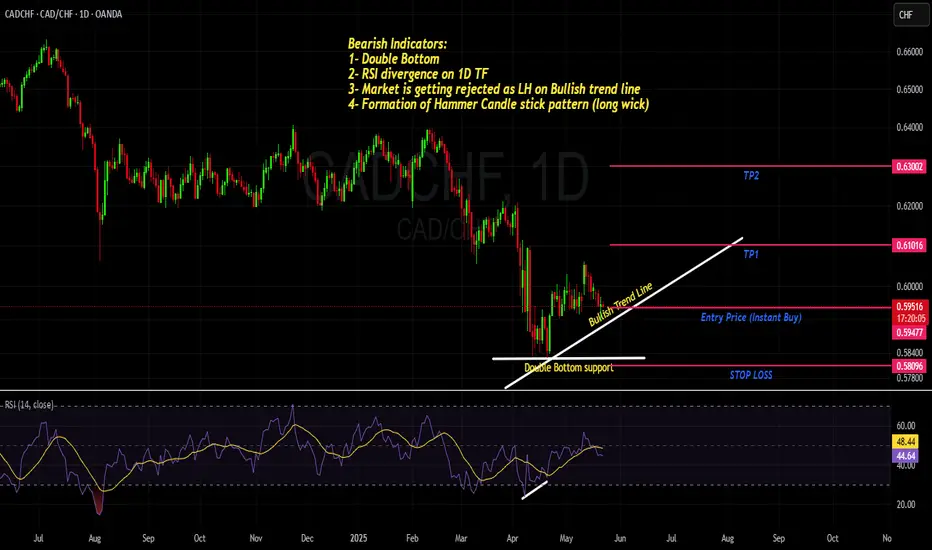
CADCHF- Another way to Look at BULLISH BIAS - 5 Strong Reasons Strong confluences on 1D time frame for the Bullish BIAS on this pair.
1- RSI divergence
2- Formation of HH and HL
3- Bullish Trend Line
4- Hammer Candle stick pattern formation
5- Double Bottom
we anticipate the market to remain in Bull phase.
Entry point is market with TP1 and TP2 as R:R of 1:1 and 1:2 respectively. Keep you Stop loss slightly below the Double Bottom (Support line)
SOLUSD Long1D Analysis:
SOLUSD is in a strong uptrend with a second Higher High (HH) in place. A bullish divergence is visible, and price has retraced into the golden zone (0.5–0.618 Fib) — signaling a high-probability long setup. Instant buy is Suggested.
Bull Score: 2 vs 0 (Uptrend (Dow Theory, Bullish Divergence vs 0)
🛡 Risk Management
📍 Entry (EP): 170.50 (Instant Buy)
🛑 Stop Loss (SL): 140.55
🎯 Take Profit 1 (TP1 - 1:1): 199.40
🎯 Take Profit 2 (TP2 - 1:2): 228.78
💰💸 Trade smart, manage risk, and let the trend print

HH HL expected
Closed at 181.77 (20-05-2025)
Bullish divergence on DTF.
Breakout Done.
Currently at Resistance level.
Important to Sustain this level for
further upside towards 187 - 190
Important Support for now is around
175 - 176 & then around 168.50

NEARUSDT NEARUSDT – Bullish Reversal Trade Setup
Entry: $2.78
SL: $1.81
TP1: $3.90
TP2: $4.96
Trail for Extension: $5.50–$6.00
Structure & Logic:
Previous Lower Low (LL) and Lower High (LH) sequence broken.
Higher High (HH) now confirmed — signaling trend reversal.
Strong Bullish Engulfing + Hammer at Higher Low area.
Dow Theory shift in play, signaling long opportunity.
Trade Plan:
Partial at TP1
TP2 for full target
Trail SL above TP2 for potential $5.5–6.0 move
Risk-managed entry: ~1:1 , 1:2

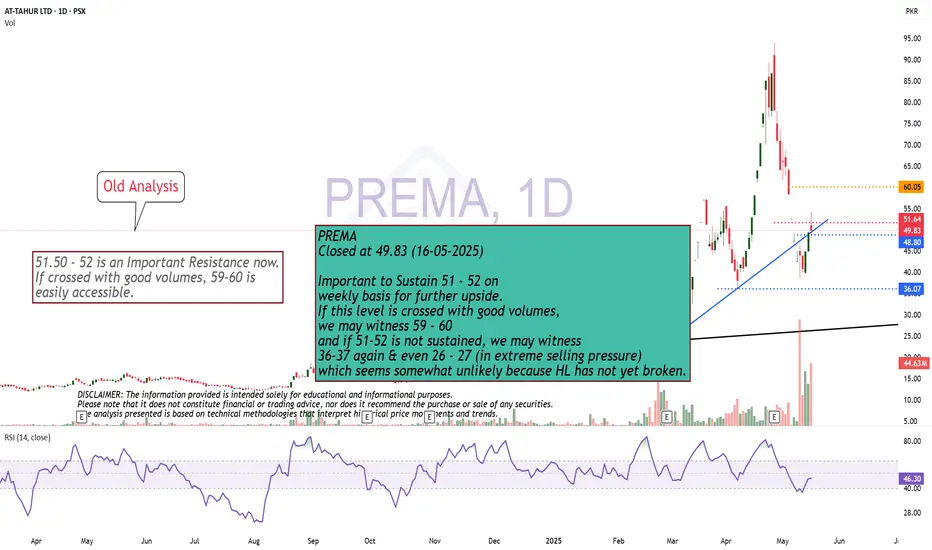
Higher Low intact.Important to Sustain 51 - 52 on
weekly basis for further upside.
If this level is crossed with good volumes,
we may witness 59 - 60
and if 51-52 is not sustained, we may witness
36-37 again & even 26 - 27 (in extreme selling pressure)
which seems somewhat unlikely because HL has not yet broken.
Bullish Divergence appeared on bigger tf.Bullish Divergence appeared on bigger tf.
Sustaining 33 on monthly basis would be
a positive sign.
36 is the Breakout level.
Immediate targes can be around 43 - 45
If 32 is not sustained on Monthly basis,
we may see further selling pressure towards
25 - 27
