DOW JONES: Final phase of bullish wave has started.Dow is practically overbought on its 1D technical outlook (RSI = 69.306, MACD = 518.450, ADX = 36.217) but that should little affect the heavily bullish price action on the long term. The reason is that after the April bounce on the 1W MA200, Dow entered the final phase of the Bull Cycle that started on the October 2022 bottom and according to all prior bullish waves inside the 16 year Channel Up, it should rise by a minimum of +71%. That gives a TP = 49,000.
## If you like our free content follow our profile to get more daily ideas. ##
## Comments and likes are greatly appreciated. ##
Dowtrading

DOW JONES: Technical pullback possible but 43,700 target remainsDow Jones is bullish on its 1D technical outlook (RSI = 62.550, MACD = 276.720, ADX = 11.070), extending the bullish wave of the 1 month Channel Up. This is only the second such wave of this pattern and its first pulled back to the 0.5 Fiboancci retracement level after making a +3.75% rise. It is possible to see such a retrace start either now or tomorrow but on the medium term the bullish target on the 1.236 Fibonacci extension is intact (TP = 43,700).
## If you like our free content follow our profile to get more daily ideas. ##
## Comments and likes are greatly appreciated. ##

DOW JONES: Will the 4H MA200 produce a rally?Dow is neutral on its 1D technical outlook (RSI = 51.949, MACD = 356.820, ADX = 20.639), trading between its 4H MA50 and MA200 in the past 2 days. The price just hit the 4H MA200 for the 2nd time again at the bottom of the Channel Up. As long as it holds, the pattern can initiate the new bullish wave. We exepct it to repeat the +3.74% rise of the one before, TP = 43,550.
See how our prior idea has worked out:
## If you like our free content follow our profile to get more daily ideas. ##
## Comments and likes are greatly appreciated. ##

DOW JONES: Inverse Head and Shoulders looking for a breakout.Dow Jones is marginally bullish on its 1D technical outlook (RSI = 55.600, MACD = 267.860, ADX = 21.901) as just now it is attempting to be detached from the 4H MA50. Technically this could be the attempt to break towards the 2.0 Fibonacci extension, after having formed the RS of an Inverse head and Shoulders pattern. With the 4H MACD close to a Bullish Cross, we are bullish, TP = 44,250.
## If you like our free content follow our profile to get more daily ideas. ##
## Comments and likes are greatly appreciated. ##

DOW JONES: Channel Up targeting 43,400.Dow Jones is practically neutral on its 1D technical outlook (RSI = 55.880, MACD = 380.350, ADX = 13.770) as the price is consolidating on its 4H MA50. Despite the neutrality, it remains inside the Channel Up, that is supported by the 4H MA200 and whose 4H RSI squeeze indicates we might be on a similar slow uptrend as late April's. We expect a similar +5.60% rise from the HL bottom, TP = 43,300.
## If you like our free content follow our profile to get more daily ideas. ##
## Comments and likes are greatly appreciated. ##

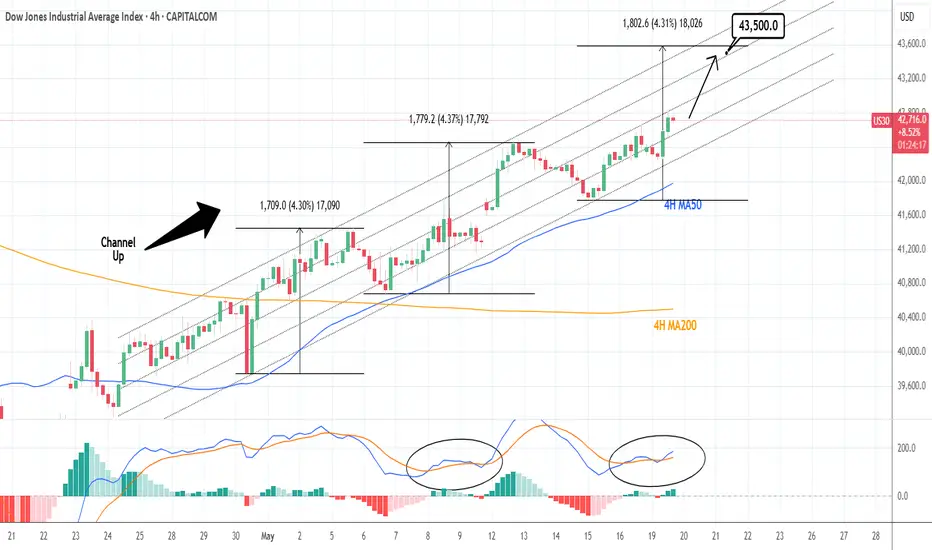
DOW JONES: Looks to extend gains to 43,500Dow Jone remains bullish on its 1D technical outlook (RSI = 62.492, MACD = 410.840, ADX = 32.007) as it maintains the medium term bullish trend inside its 1 month Channel Up. Since the index kept the 4H MA50 intact, it established it as its Support and is now halfway on the new bullish wave. The 2 prior rose by +4.30%, which gives a clear technical target (TP = 43,500)for the next HH.
## If you like our free content follow our profile to get more daily ideas. ##
## Comments and likes are greatly appreciated. ##
DOW JONES: Breached the 1D MA200. Tariff War 2018 Recovery aheadDow Jones is on excellent bullish levels on its 1D technical outlook (RSI = 62.103, MACD = 203.720, ADX = 34.693) and as it crossed today above the 1D MA200 for the first time since April 2nd, and practically validates the recovery from the Tariff War correction, it draws strong comparisons with the last U.S.-China Tariff War in 2018. Both rebounded after highly oversold 1D RSI levels, and the 2019 recovery almost hit the 0.9 Fibonacci level before turning into a less aggressive recovery. The trade is long, TP = 44,100.
## If you like our free content follow our profile to get more daily ideas. ##
## Comments and likes are greatly appreciated. ##

DOW JONES: This is why it targets 70,000Dow Jones is marginally bullish on its 1D technical outlook (RSI = 57.838, MACD = 20.320, ADX = 34.615) as the recovery since last month's low is taking a pause ahead of the Fed on Wednesday. Last month's candle closed with an incredible reversal and all this is just noise for long term investors who look at this very chart you have in front of you. The index is basically on the usual -20% correction it undergoes when it is in the middle of a multidecade Bull Cycle. If this is indeed what many call the A.I. Cycle, Dow has a minimum target of 70,000 expected somewhere in 2032.
## If you like our free content follow our profile to get more daily ideas. ##
## Comments and likes are greatly appreciated. ##

DOW JONES: The most critical 1D MA50 of all.Dow Jones is neutral on its 1D technical outlook (RSI = 52.914, MACD = -282.250, ADX = 30.751) but has completed 5 green 1D candles in a row, going for the all important Resistance test of the 1D MA50. This trendline has been intact since March 3rd and is on a crucial Resistance cluster as this is where the LH trendline from the ATH is. The 1D RSI is already on an Inverse H&S, which is a positive sign but we need to see a candle closing over the 1D MA50 to validate the restoration of the long term bullish trend. If succesful, we will turn long and target the ATH Resistance (TP = 45,000), which is also just under the 2.0 Fib extension.
## If you like our free content follow our profile to get more daily ideas. ##
## Comments and likes are greatly appreciated. ##

DOW JONES: Just triggered the most historic buy signal (1M MA50)Despite the bearishness on the lower timeframes, Dow is neutral on the ultimate long term chart, the 1M (RSI = 51.044, MACD = 1991.530, ADX = 44.038) and that is due to the fact it almost touched its 1M MA50. This neutral technical setting is a great reset for the Channel Up and stands as the most ideal long term buy entry and was tested before on all 4 major market bottoms (September 2022, March 2020, January 2016, October 2011). In all incidents it set in motion the new Bull Cycle, technically the bullish wave of the Channel Up. The most common price increase is +70% and along those lines, we anticipate Dow to hit 60,000 by the end of 2027.
## If you like our free content follow our profile to get more daily ideas. ##
## Comments and likes are greatly appreciated. ##

DOW JONES: High volatility but clear picture long term.Dow Jones turned bearish on its 1D technical outlook (RSI = 40.021, MACD = -1063.380, ADX = 32.380) as it is correcting brutally yesterday's gains on uncertainty regarding the 90-day pause of tariffs. We can't overlook however the fact that yesterday's rebound happened on the 1W MA200 and at the bottom (HL) of the Bullish Megaphone. The very same sequence of events unfolded during the last big U.S.-China trade war that bottomed in December 2018. First a Channel Down bottomed on the 1W MA200 and started the Bullish Megaphone that bottomed on the 2018 trade war.
Both trade war corrections were -19% and if what follows replicates the 2019 rise, then we are up for a +35% rally. Potential TP = 49,000.
## If you like our free content follow our profile to get more daily ideas. ##
## Comments and likes are greatly appreciated. ##

DOW JONES: 4 week bottom on the 1W MA50. Best time to buy.Dow Jones turned neutral again on its 1D technical outlook (RSI = 46.611, MACD = -297.980, ADX = 37.851) as it is recovering today and more importantly keeps its price action above the 1W MA50. This is the 4th straight week that it trades and holds the 1W MA50, which is shaping up to be the natural long term support. That is keeping the 1W RSI neutral (47.224), which technically suggets that it is the most low risk level to buy. The 1W RSI made a double bottom due to this consolidation and the 1W MACD printed the first light red bar, all of which are similar to the October 23rd 2023 bottom.
Both have been bottoms after bearish waves of the 1.5 year Channel Up and as a matter of fact similar in decline rate (-9.50%). The highest probability level for a rebound and start of the new bullish wave is this, and based on the previous, it should aim for the 2.0 Fibonacci extension (TP = 49,000).
## If you like our free content follow our profile to get more daily ideas. ##
## Comments and likes are greatly appreciated. ##

DOW JONES: Are you ready for what's coming?Dow Jones is neutral on its 1D technical outlook (RSI = 48.157, MACD = -244.290, ADX = 38.724) as it is attempting to recover the 2 month correction. It appears that the bottom has already been made as not only did the price rebound on the LL trendline but it did so on an oversold 1D RSI. This draws comparisons to the last big such correction of Aug-Oct 2023, which also declined by more than -9.40%. They key there was the formation of a 4H Golden Cross.
Right now the price is stuck inside the 4H MA50 - 4H MA200 range, so if it crosses now over the 4H MA200, it will most likely confirm the start of the new bullish wave as it will form a 4H Golden Cross. Technically it can achieve a similar price rally as then, so our thesis remains bullish aiming at the 2.0 Fibonacci extension (TP = 50,000).
## If you like our free content follow our profile to get more daily ideas. ##
## Comments and likes are greatly appreciated. ##

DOW JONES: MA50-100 Bearish Cross says we've bottomed.Dow Jones is almost neutral on its 1D technical outlook (RSI = 43.171, MACD = -608.620, ADX = 62.568), rising aggressively since last week. Technically that was the bottom no just on the 8 month Channel Up but also on the LL trendline. We've seen the very same LL bottom on the October 2023 and March 2023 lows, all of which had oversold 1D RSIs. The 1D MA50-100 Bearish Cross marked those bottoms and today we've completed a new one. Technically the index can rise as high as the 2.0 Fibonacci extension (TP = 49,000).
## If you like our free content follow our profile to get more daily ideas. ##
## Comments and likes are greatly appreciated. ##

DOW JONES: Starting the final stage of 3year Bull Cycle.Dow Jones got oversold on its 1D technical outlook (RSI = 29.297, MACD = -550.130, ADX = 76.606) as it is currently testing its 1W MA50. This is a level that has been intact since November 2023 and is of high importance to the trend as it has a key cyclical attribute. The driving growth pattern of Dow since the 2009 bottom is a Channel Up and every time a Bull Cycle starts, the 1W MA50 is the first level of support, with every touch of it being the strongest buy opportunity. When the 3 year Bull Cycle is coming to an end, the 1W MA50 breaks and the index approaches the 1M MA50 during its Bear Cycle correction, which becomes the ultimate buy entry for the new long term 3 year Bull Cycle.
The current Cycle should starts getting completed technically after September 2025, so there is a high chance that the 1W MA50 holds here. The three Bull Cycles we've had so far had a fairly similar growth percentage, rising by +70.38% to +76.64%. If the +70.38% minimum range is followed on the current (4th) Bull Cycle, then we're aiming at 48,000 (TP) towards the end of the year. The 1M CCI seems to be printing the exact same build up to the Bear Cycle as in the past.
## If you like our free content follow our profile to get more daily ideas. ##
## Comments and likes are greatly appreciated. ##

DOW JONES: 1D MA200 and Channel Up bottom. Bullish.Dow Jones is bearish on its 1D technical outlook (RSI = 36.722, MACD = -181.150, ADX = 58.438) as it is running the bearish wave of the 16 month Channel Up. Being so close to the 1D MA200 has been a buy signal since November 2nd 2023. Additionally, the price just hit the 0.382 Fibonacci level from the last consolidation phase. If that's confirmed, then the index is about to complete the new consolidation phase. The target on the previous one has been at least the 3.0 Fibonacci extension. The trade is long, TP = 50,500.
## If you like our free content follow our profile to get more daily ideas. ##
## Comments and likes are greatly appreciated. ##

DOW JONES: Triangle about to break out.Dow Jones is neutral on its 1D technical outlook (RSI = 53.474, MACD = 190.020, ADX = 26.060) as it is trading inside a Triangle pattern, sideways around the 4H MA50. A crossing over the R1 level will be a long aiming at the 2.0 Fibonacci extension (TP1 = 48,000), while a crossing under the S1 level will be a short aiming at Fib 0.0 (TP = 42,000).
## If you like our free content follow our profile to get more daily ideas. ##
## Comments and likes are greatly appreciated. ##

DOW JONES: Necessary correction to lated target 46,600.Dow Jones is neutral on its 1D technical outlook (RSI = 53.301, MACD = 170.540, ADX = 30.319) as it is trading sideways on top of the 1D MA50 for the past 2 weeks. The long term pattern is a Channel Up that every time it rebounded on a HL bottom and hit the R1, it always pulled back again to test the 1D MA50. Consequently, this is a necessary technical correction that will allow the index to attract enough buying momentum again to go after a new HH. Aim for a minimum +8.41% increase (TP = 46,600).
## If you like our free content follow our profile to get more daily ideas. ##
## Comments and likes are greatly appreciated. ##

DOW JONES: Buy signal above the 4month RectangleDow Jones just turned bullish on its 1D technical outlook (RSI = 56.676, MACD = 255.440, ADX = 30.051) as it hit the 4H MA50 after an instant rebound on the 4H MA100 inside the same session. This is a strong bullish reversal but the buy signal will be validated if the price crosses over the 4month Rectangle pattern. The rally from its January 13th bottom has been with a significant correction until Friday's and today so far and according to the November rally which was two-fold, if this is the start of the 2nd bullish stage, it should be -1.70% weaker than the first. This implies that from today's low we should rise by +6.30%. This gives us a TP = 46,550 but in order to overcome the bearish pressure of the Rectangle, we will buy only if then price crosses over it.
See how our prior idea has worked out:
## If you like our free content follow our profile to get more daily ideas. ##
## Comments and likes are greatly appreciated. ##

DOW JONES: Absorbing tech sector's losses.Dow Jones remains heavily bullish on its 1D technical outlook (RSI = 63.633, MACD = 251.980, ADX = 35.788) and in contrast with Nasdaq's heavy losses, which is rattled by DeepSeek, it is rising. It seems that industrial stocks are absorbing quite a significant portion of tech's losses. Dow's long term Channel Up pattern remains intact and last week's crossing over the 1D MA50 and the bearish wave, confirmed that we are at the start of the new bullish wave. Based on the HL of the 1D RSI that was completed on the January 10th bottom, we draw strong comparisons with the October 27th 2023 bottom. If the index holds the 1D MA50, we expect the next high to be at 48,000 and after a pullback, complete the wave by May on a +20.75% rise (TP = 50,500), same as the increase of the 2024 bullish wave.
See how our prior idea has worked out:
## If you like our free content follow our profile to get more daily ideas. ##
## Comments and likes are greatly appreciated. ##

DOW JONES: Crossed above the monthly Channel Down. Buy signal.Dow Jones turned bullish again on its 1D technical outlook (RSI = 57.829, MACD = -79.310, ADX = 34.732) as it crossed over the Channel Down that is the bearish wave of the long term bullish trend. The 1W MA50 held and we have to go back to October 30th 2023 to find the last time that the index was under it. If the 1W RSI crosses above the MA trendline, we will confirm that most likely we are going to have a November 6th 2023 type of bullish breakout. The major rallies of the past years have been at least +20%. Buy and TP = 50,500.
See how our prior idea has worked out:
## If you like our free content follow our profile to get more daily ideas. ##
## Comments and likes are greatly appreciated. ##

DOW JONES: contact with the 4 month Support Zone. Strong hold.Dow Jones approached the oversold limit today on its 1D technical outlook (RSI = 38.566, MACD = -404.260, ADX = 33.712) as it hit the S1 Zone, which is in effect since late September 2024. The last test of this Zone (November 4th 2024) also coincided with the 4H RSI getting oversold (under 30.000) and the price was also trading inside a Channel Down. By early next week, we expect the index to initiate a similar rebound, aiming at the 0.786 Fibonacci level (TP = 44,300).
## If you like our free content follow our profile to get more daily ideas. ##
## Comments and likes are greatly appreciated. ##

DOW JONES: Rare Channel Up bottom buy opportunityDow Jones remains bearish on its 1D technical outlook (RSI = 40.772, MACD = -242.050, ADX = 47.872) as despite trading on the 1D MA100, it has failed yet to recover the 1D MA50. Technically though, the price action is sitting exactly at the bottom of the long term Channel Up and the 1D RSI has formed a bottom fractal identical to those of June and April 2024. The minimum target on those has been +7.65% but since we have the R1 level to consider as Resistance, that will be our target (TP = 45,000).
## If you like our free content follow our profile to get more daily ideas. ##
## Comments and likes are greatly appreciated. ##
