Drop!

BTC potential Inverse HS pattern,bottom 5.2~5.5k?!HI GUYS. today is such a gloomy day. btc is falling, and falling. i have opened my short position at 6500, sold it at 6080. I went long at 6050, sold it at 6150. for me, it is successful, but there are so many people in dooms!
now, i want to share quick about a potential inverse pattern that might play out. this is all just a SCENARIO, IF we play out just like last time.
But! this idea will be invalidated immediately if we go much higher today to 67 area in coming days, this scenario becomes garbage instantly. however right now the rsi levels, obv, mfi, every indicators, time period before etf hearing, indicates that
this kind of charting play might play out IF the bulls want to make a run in sometime in September.
guys, you have to understand first, that i think the neckline, for now, just for now, the major resistance is NO longer 6.7~6.8. It is 6.6, and 6.5. yesterday a head and shoulder pattern broke out from 6.5~6.6 area, and this zone is making a big resistance.
i do not know where real bounce may come but, at 5.75, since it is a former bottom there will be a bounce, and the top may be 6.2~6.3 at max playing around at 6.0~6.1 mostly.
then it will resume going down to 5.2~5.5k levels, and it will shoot up to 6.3~6.4 levels, and it might come down to make a DOUBLE BOTTOM formation, but just higher then the former low or similar.
after that, we go sideways, and shoot when a clear bull div has appeared on daily frames.
HOWEVER, now the indicators in daily is oversold, and it doesn't have so much room to go down, BUT! in 2014, RSI levels in daily even hit 20 levels, which we might see a massive downtrend.
Personally I want this idea to be invalidated, this is really crucial.
for now guys, do not jump in 6.0~6.1 level. investment plan for shorts and longs are below.
1. Open shorts
6180~6200(just if BTC breaks out of the rising wedge today we can try)
-target 58.7/57.5
-->this is absolutely risky I do not recommend this. only for experts who see this coming, with very tight stop at 6250.
2. Open longs
58.4/57.6/55
-target 6k, 6.2k+@
--->this right now seems like its not going to happen, and this call may be VERY EARLY. HOWEVER, we will see a bounce here so not a risky trade like the short.
good luck in trading!!!!

Seems like algos have decided possibility for spx tol touch the all time high and then drop if douple top happen
PE: 2815
SL: 2807
Target 2845

Getting ready for another drop. With a new resistance.I know it SEEMS like this is the area we will bounce around, but i think on balance of probabilities we will
Find ourselves hitting a new low shortly. So far with every initial pump to begin a larger pump we have not had
a divergence on the momentum as we do now. As well as that, every time we did have a dead cat bounce we
DID have a divergence before a new low was made. With this is mind, I say get ready for a new low, and
another bounce. It isn't even oversold on the daily yet, and yet here we are.

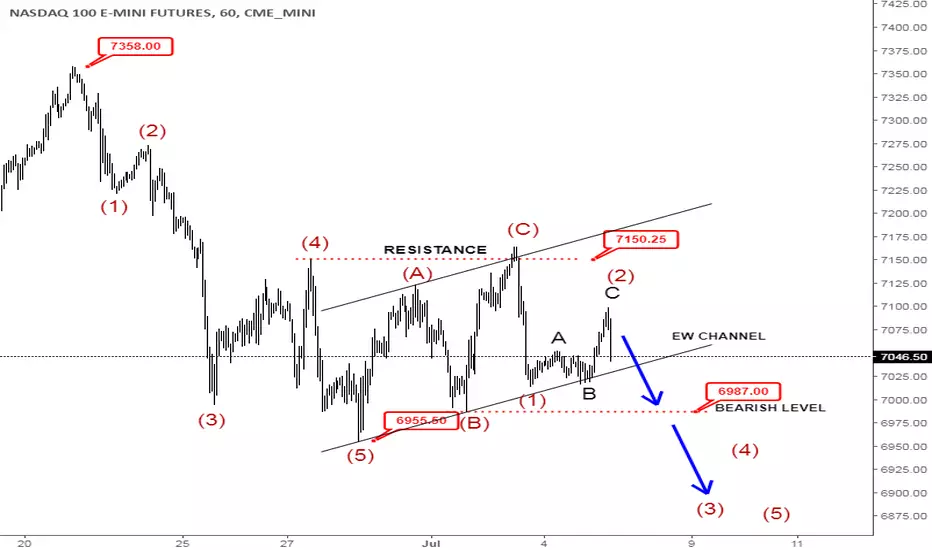
Elliott Wave Analysis: NASDAQ May Drop HardHello traders!
We want to share with you pretty clear and recognizable pattern on Nasdaq! According to correlations with other stocks, we assume that stocks may face a hard drop.
We can clearly count five waves down from 7358 highs, which suggest a bearish reversal, but the most important is that we see only three waves (A)-(B)-(C) of corrective recovery back to ideal resistance at previous wave (4) around 7150 level. In EW theory, impulsive five waves down and corrective three waves up indicate a bearish trend.
As you can see, Nasdaq already sharply dropped from 7150 resistance area and currently can be just consolidating before a continuation lower towards new lows, especially if breaks below EW channel support line and 6987 bearish confirmation level, which would confirm our view.
Even if turns back above 7150 level, we will still tracking a correction, but just more complex, so we remain bearish as long as it's trading below 7358 invalidation level.

Nasdaq in the next few weeks.Hi Index Fan,
Like I explained on my draw, and after the analysis of the time trend, and also the strong divergence with the RSI, the correction is coming.
Sell in May and Go Away, or Short in september and go to the beach ... Unfortunatly the pun is not here the divergence Yes!
It is time also for the velocity to go up again after the flash crash of february.
All indicators are bearish, so caught that, and lets make dollars (And Holidays) ! $$$ !
Let me know if you have any question.
HM
Ps: About the Target price I got it with Fibo and my indicator ( Write "Moriceau" and you will find some of my indicator in public) :)$

bitcoin to test $7k before heading to lower $6kas much as id like to think this bitcoin dump is over i still think we have further to fall.
we are basically at wave 4 and i expect a small climb now as we have found support in the $6700 region. after breaking the short term trend line we now have resistance around the $7100 (orange dotted line on diagram) and for the market to feel confident in buying the bulls really need to make an effort to take $7100 and remain above it.
saying that i think with the market in the position it is a lot of buyers aren't seeing the green lights for it yet and im feeling we will fail this test.
if failure happens then a drop to the next trend line (shown in pink on diagram) at $6500 (yellow dotted line on diagram) is the most likely scenario creating another double bottom for bitcoin, this could be the area buyers are waiting on.
a drop into the green box wouldn't mean the worst however failing to hold $6200 (Z on diagram) could mean we drop below the $6k (blue dotted line on diagram) mark then its anyone's guess to where the knife lands; $5k, $3500, lower? - all are possible.
playing with caution right now, ovs plenty of opportunity but also as much risk. tight stop loss at any of these regions if you move in.
peace.

Low Buy-In Opportunities In The FutureAs the daily chart shows, we should expect lower buy in opportunities. Minor ascending impulses will happen on the way down, but I would consider this a NO TRADE ZONE! Dollar cost averaging your buy-ins will help eliminate risk! Prices should expect to fall to zones 1 or 2. #BTC

BTC: Rome Wasn't Built in a DayMajor resistance met after a straight shot up. A pullback to retest the log line for the first time and inverse head n shoulders would be healthy. Still, BTC remains climbing and could keep pressing higher, though a Leaning Tower of Pisa might not recover as well compared to the scenario above once it finally gets it first true correction. Either way, it's always an interesting time in the crypto space.

BTC: Another Big Bart Simpson Drop?BTC has had a good run, but looks to be slowing its roll up here near a big 786 fib (the strongest correction fib), the downtrend line on the log, and the 200-day EMA right above it.
BTC has reached for these three resistance levels on a somewhat overstretched run absent a true pullback so far to cool off RSI levels and form a much needed elliott wave down on higher timeframes to set up the next wave up. Both the 4h and 1D RSI are at very high levels where corrections have typically taken place historically.
Beware the FOMO, entering up here carries high risk. My estimate is the super bears could be amassing short positions soon enough.


ETH to Correct Soon: Lock in ProfitsETH has completed a nice 5-wave elliott pattern and will most likely correct soon.

BTC 4h Forecast: Drop then Consolidate in FlagContinuing from the MicroAnalysis I just posted, BTC is most likely looking for a healthy pullback and consolidation soon.
This is one option for flagging out a pattern before further decision-time up or down: an initial ABC correction down to the 382 fib and the prior price structure support near it before attempting higher. Expect multiple head n shoulders and inverse head n shoulders battles between the bulls and bears if this happens.

BTC to Correct Soon and Head n Shoulders: MicroAnalysisMicroanalysis: "Forest for the trees but the trees still make the forrest".
Bulls losing steam in the short term. Protect your profits.

ASX DROP!hey guys,
I'm forecasting ASX to drop and complete the c wave part of the structure before going back up. This drop will be very impulsive (as c waves are generally impulsive in nature) it coming near the low before going back up.
Regards,

BTC/USDT To 5k??Back when we hit 6k, that was considered our resistance level. we bounced right off and uptrended back up. Now we face another down trend and seems we will be testing that 6k resistance again. if BTC/USDT breaks that resistance level, it should be our confirmation for around 5.3k-5.5k resistance. Then we will be done with our downtrend.

Small drop in the spy could be comingI'm bullish long term but in the short term i believe a small drop is coming. We are a bit overstretched. It's not a bad idea to hedge your portfolio a bit and take some profit from the table.

$Bitcoin to $2000 Down Trend inside Down TrendBitcoin is about to drop to $2000. It has hit this support 4 times and will soon break through, heading much lower.

Time to get some popcorn, Bitcoin going downDaily chart on Bitcoin shows a pretty clear downtrend. 200 and 50MAs are close to cross (the two are already signalling a downtrend on the 4h and 1h charts).
Highlighted in red the levels to watch for resistance/support.
With almost all crypto in red territory, the bubble likely popped. Time to get some popcorn and prepare for the show.

BTC - LTC - ETH = SamethingHi guys.
Just look!
Look at the chart of BTC, LTC and ETH.
They are identical.
Wait before buying. $$$
Love you all


STR SHORTShorting stellar margin on poloniex saw a nice setup for a b to c leg in this bull trap
(now that bitcoin is headed to test 8000$ i'm expecting a lower low in many coins I am mainly buying all this panic but Stellar still has a good risk to reward ratio for shorting so i'm shorting for the next few days or so down to the bottom of its 1 wave)
Big picture this is just a 4 wave so STR has a lot of upward movement left but for now we need to see lower lows to test its 1 wave .
