DROP

SP500 Possible crashI was studying lastest SP500 drops and it is possible to predict a huge crash in AGO-21.
-not a financial advice-

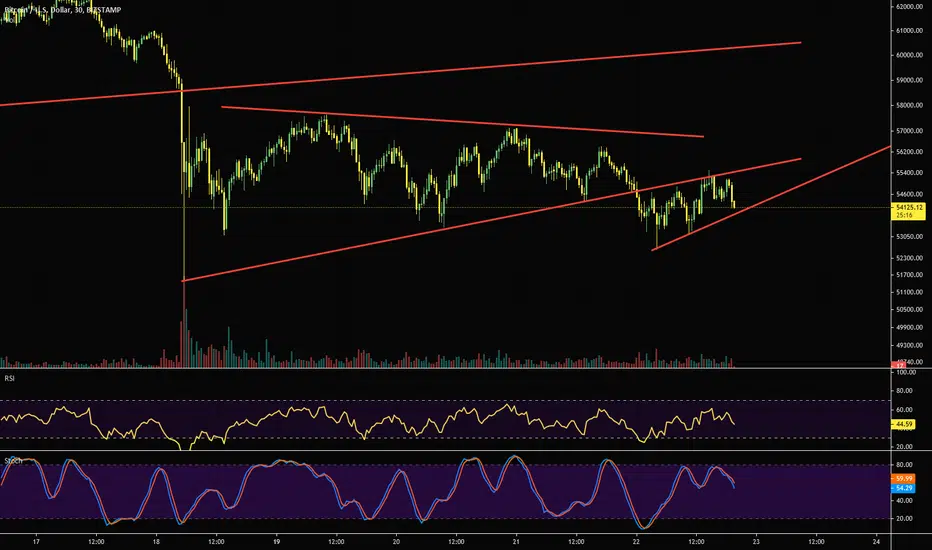
Bitcoin in Capitulation Embrace the Volatility, HODL, and Relax.Welcome to Cryptocurrency! HYPER VOLITILITY! FLASH CRASHES! This is the first time since March 8th 2020 we've fell below the 200 day moving average which was right at the start of COVID-19. Reverse psychology when it comes to Cryptocurrency these dips are historically some of the best times to enter the market.
Is the bull market over? I personally don't believe so but even if it was I'll still be taking stable depreciating fiat dollars and adding to my Bitcoin position. I personally never trade or sell my Bitcoin I just continually add to my holdings. I more focus on growth and Bitcoin wealth preservation but that is just me though. I believe years from now we'll be looking backing wishing Bitcoin was at these current prices just like how everybody wished they could've purchased Bitcoin back when it was a couple hundred dollars only 6 -7 years ago.
The whole market is on discount so for all those great cryptocurrency projects that you've been itching to buy this is a nice price correction to consider entering. My whole entire portfolio is down 50% but I'm perfectly fine because I haven't sold anything, therefore I haven't lost anything. This will not be the first nor last time we corrections like this. I understand this is painful but we need to keep our emotions together. This is meant to shake you out of the market. Institutions want you to sell you're Bitcoin for cheap.
Remember you've only lost if you've sold. Buying and holding isn't as easy as everybody thinks. We feel very euphoric and like geniuses when we're very profitable. But we think it's the end of the world when we get steep retracements and price drops. Then we feel like loosers and a lot of negative self-defeating thoughts start to plague our minds with fear, uncertainty, and doubt. If you purchased Bitcoin and you're down don't worry. Our world needs Bitcoin and it's extremely limited.
HODL your Bitcoin! We've formed another parabola and we will get though this painful correction. Much peace, love, health, and wealth!

ETHUSD Ethereum is dropping - How much? 70% - CRASHYes exactly. I expect Ethereum to drop 70%. This scenario is possible due to a matter of factors.
What do you think?

Ethereum drop to $ 2,700Ethereum is completing the head and Shoulders. Drop to $ 2,700
Disclaimer!
The content of this post is for educational purposes only and is not a buy or sale offer in any way. You can use its information to prepare your trading plan. But you have to do your own research. Trading is risky and requires experience and is not suitable for everyone. Only you can be responsible for your trading.

Do you want Three Drive ?We could to have this pattern. All is possible.
This is just a suggestion.
All possible assumptions must be considered.


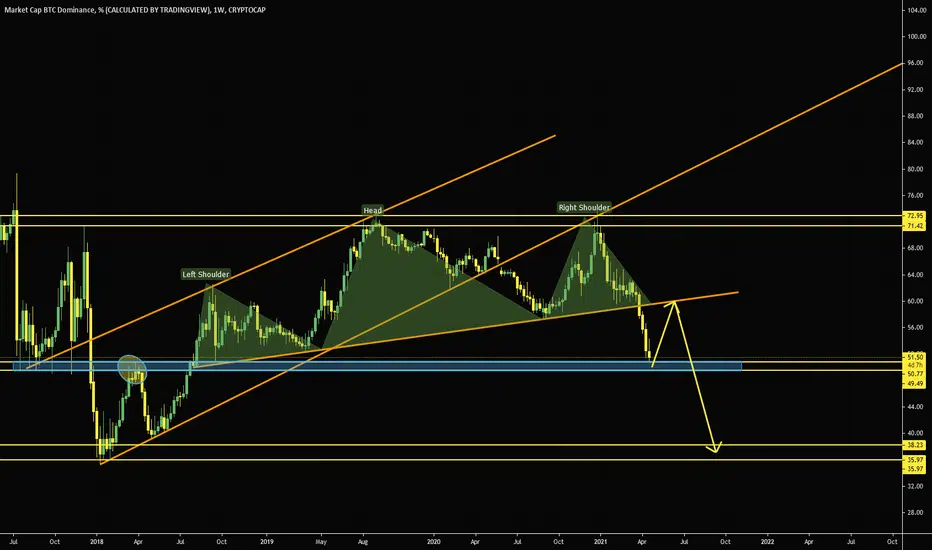
Btc dominance drop cenarioAs mentioned before, Btc might print a double bottom.
Check previous TA.
Coinmarketcap shows 49.9% btc dominance at the moment.
Its happening really fast!
Faster than what i draw before in those pink lines.
Will BTC hold the ground at 50% dominance, or continue droping?
A 50% drop from last top will create a double bottom at 37% btc dominance.
If we continue droping. I guess we can say that the alt season actually started in early January this year.
Anyhow, still bullish on BTC .
Bull run is still intact imo.