USDJPY Deep fallUSDJPY is ready for a deep fall as volumes are declining and price is rising parabolic to a standstill. Good R:R of 1:10
DROP

I really hope this fractal doesn't play out on netflix..We are seeing some early signs of bearish sentiment ... I have said multiple times in the past if we get some type of correction in stocks it will be because of overvalued tech stocks such as google amazon Netflix nvidia and many others..
I am not trying to call a top here! we still need to make more lower lows to confirm the trend but we are getting early signs of bad structure similar to the way the internet bubble was topping out .
the spx could have a trend line failure and do a ABC or go for more legs up so we are just watching those levels
But yeah I don't want this to happen cause it would mean lots of people loose money but also I feel I need to post warnings to watch for lower low patterns and more weakness so you don't get exposed to a 40% drop or something crazy like that.
remember there are lots of kids Netflix and chilling these days but you can also still use torrents and hulu
Stay safe and stay profitable out there.

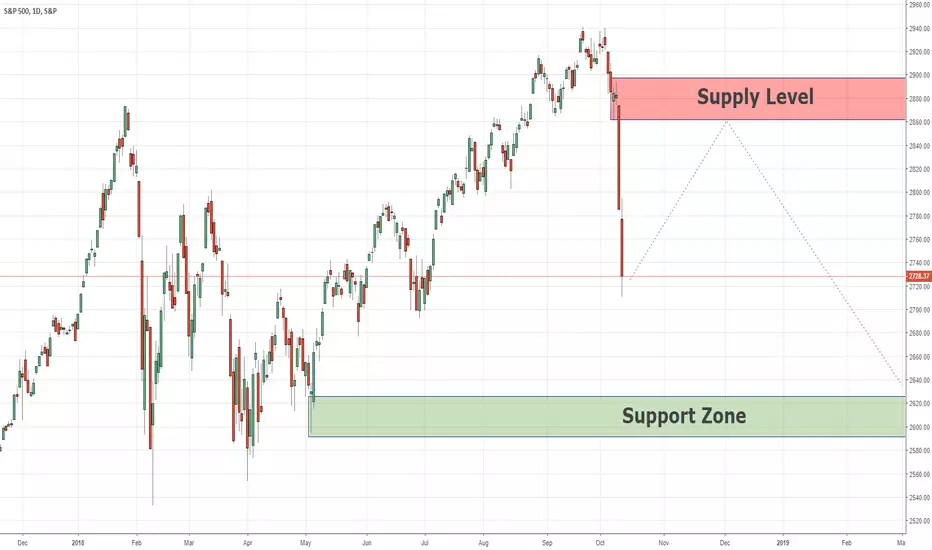
Long Term Analysis SPX500 12/10/2018The SPX500 0.42% has created a fresh new supply at the beginning of the recent drop. This supply seems like a strong one, the price drop down from there very fast which Indicates more sell orders that waiting there. I'll wait for the price to return that supply And I'll sell there, my target will be the support zone below, and for those who want to try and Take it further, 2500.00 is the next target.

Long Term Analysis SPX500 12/10/2018The SPX500 has created a fresh new supply at the beginning of the recent drop.
This supply seems like a strong one, the price drop down from there very fast which Indicates more sell orders that waiting there. I'll wait for the price to return that supply And I'll sell there, my target will be the support zone below, and for those who want to try and Take it further, 2500.00 is the next target.
financial crisis and posible rising of bitcoin.hi, financial crisis is here , in the next months dow jones get down hard to 0.61 fib.and the world economy will go into recession. follow this chart bearish div in rsi and macd, media of koncorde d'ont have volume, mago staperlo in negative zone. you need a plan for this crisis good luck.

Amazon (AMZN) Price Prediction for Sep 19 2018 I am predicting it will reach the green area be the time and date shown

Bitcoin | Recovery Before The Next Drop? [BTCUSD]Looking at the BTC market today, I'm feeling pretty bearish.
Since the 6.5k area didn't hold, I'm assuming that we go down even further to the 6.2k zone.
Right now, we see the market recovering / pulling back, but I think that 6.5k will act as a strong resistance now.
If we tag that area, it would be a good opportunity to load up on some shorts.
Shall the bulls not get above 6.5k again in the next days, I think its pretty much game over.
As for now, all we can see as an acceleration to the downside. Lower highs appear quicker and quicker, squeezing into the bottom of the multi-month triangle.
Be prepared for some violent moves during the next days/weeks.
Have a nice day!
---
For a more detailed analysis check out my YouTube Video:
www.youtube.com

The dark knight risesDark knight rises
Based on my analysis: I think the bull up move is now compromised. In my previous idea, I've drawn a tight range (channel) where the price was orbiting. It is a ceiling in fact, a real resistance zone.
I think there is 15-25% chance that the price will keep on going up strongly. It's really pessimistic in my opinion. Let me tell you why.
Point 1: (BULLS score +1) :
--------------------------------
In the S4W Mirror indicator, the last green hill is still above the current running red hill. but how long will it last? Not that long I think.
Point 2: (BEARS score +1) :
--------------------------------
a) There seems to be a large head and shoulders pattern that is forming. I've put some circle on graph to show it. that is really early to tell for sure though, but it'll be a flat pattern if it would occur.
b) In my previous idea, I was describing a local forming head and shoulders pattern. This one seems to still be forming. But price must move up to 6550 then drop again. In that case, we will face a price drop to 6K or even less.
Point 3: (BEARS score +1) :
--------------------------------
Look at the box I've drawn in the S4W Horizon indicator:
a) The orange line finally moved above horizon (above zero)
b) Yellow line crosses under the purple one, and the purple one is thick and descending regularly.
c) point 3/a and point 3/b are occurring nearly at the same time, which has potency for a price reversal.
-----------------------------------------
Guys take this has a PRE-Analysis. I just wanted to show you the market temperature to my opinion. The dark knight of bear rises!
Price will go up a bit first, it's the key-point to the forming patterns. but if the S4W Horizon indicator has more weight than I thought, the price should drop down fast, even before reaching the last shoulder level (6550). Time will tell
-----------------------------------------
PS: Don't take my words for granted. Analyze, re-analyze, then trade at your own risks.
PS2: If you like this analyze, please click the LIKE button. FOLLOW me also to get my latest ideas. Thank you.

Never trust Volume Profile on Crypto.I just like to show you something I saw on Binance order-book.
This is big buy orders (support lines) arrangement on Binance before they disappear from order-book.
i.imgur.com
One thing I don't like about Binance is they don't show the whole order-book or market depth.
They hide the big part of it from public and this lets the whales do what they want.
This is at time of current drop, there was a big buy on 6500 but they picked it up and let the price go down.
i.imgur.com
And this is current big buy order at 6400:
i.imgur.com
This is the reason why most of the time I put stop-loss under support line or Fib's levels they get filled then price go up. They pickup their big buys to let price go down and buy our cheap tokens then sell them a little higher to ourselves. Yeah.
I must setup a trader BOT to save my money.

Update on last dump for BTCFor the update I put in the ABCD pattern firstly made by cherif100 (link: www.tradingview.com )
His ABCD pattern is being respected by BTC.
The Bollinger Bands and StochRSI are showing bullish movement for BTC. Resistance lays around $6800 area.
This current movement is only a wave to retest resistance, before BTC will be dropping down to around $5000 area !
Link to Cherif100's idea down below.

STORJ: Great opportunity for LONG TERMSTORJ is now in big downtrend channel (red). I expect a continuing of downtrend in the way of the red trend channel. But If we look at the chart from short-term, we can see short-term trend channel (yellow), where is a chance of breakout upwards. But it is only speculation. When the market breaks this small channel, there is a possibility to reach a previous bottom near the blue area (4600-4080 Satoshi).
STORJ is a cloud coin and he gets awards as a good start-up etc. From long-term I'm convinced, that STORJ will be useful in future. In this deppresion time for altcoins, it is a good time for reload the supply of this coin, even if the drop would continue.
At the chart I have market my opinion, my point of view. I expect this altcoin will drop more, but for long-term investors, it is good opportunity to buy this coin after every drop (step by step). The market could really drop to the levels 2000-1800 Satoshi and this will be the strongest support on the chart. I don't know if the sellers could get his price to these values. A lot depends on BTC move. From short or mid term I think STORJ will drop.

USDCHF: Consolidation is over - Middle termWe can spot, that the Double Top pattern has confirmed. The second TOP candle is bearish pin-bar, which is signalizing the reversal on the market. It pushed the USD/CHF lower. We could see the market consolidation, which lasted more then 4 months (0.98-1.006).
The neckline was set at the value 0.98, which had to be broken to make the formation valid. A few days ago, it happened. Now the price a little bounced from 0.965 with candle, which looks like a bullish pin bar. It just seems like bullish pin bar (maybe market consider it, but it is not good pin-bar).
Today were published the (YoY) results from Inflation 1.2 percent as expected and also (MoM-August) Inflation, where we can see a little progress at 0.0 percent versus past monthly values -0.2 percent. This are still low value and the market responded with a growth of USDCHF.
If the market breaks the green resistance (0.971), the market could test the blue resistance. From a short term view, we can see RSI at really low points and MACD is near the crossing up. On Histogram we can see, the bears are getting weaker. So short term view could be bullish. But we should we aware, the market has confirmed a double top formation. We are also under all important EMA (200,100,50), so currently I don't expect a bigger move (over the EMA).
From Middle term I expect breakout the red zone and test lower supports. But from short-term it can be a little bounce to the blue resistance or below the EMA.
This is just my point of view, not investing advice. I'm not responsible for your losses.


Yet AGAIN a chance to jump on the USDZAR train!!!!!Set up for another chance on the USDZAR, Lower Low, and a Double top set up on the 30min. what do you guys think?
whatsapp: +27 78 864 5409

Cryptonias QUEEN will have to face the next CHALLENGE! *WEEKLY*Hey tradomanicas,
take a look at this WEEKLY UPDATE of Ethereum trying to find his path!
AS you can see, ethereum made a drop back into the recent range before Crypto-market exploded!
Ethereum will have to face the recent Major-Resistance of the downtrend which is obviously
meeting it`s fiend "Range-Support" trying to convince him to change team to "resistance".
Both together have created a triangle whoch could cause the market players to hesitate before we get
into more volume!
(SELL-OFF or "lets stay in range guys".
Exciting!
Peace and good trades
Irasor
Trading2ez
Wanna see more? Don`t forget to follow me! :-)


BTC Magic 3 DROP inc.? Riding the Fan-Waves! Hey tradomaniacas,
it`s been a long time since I`ve published an idea for the cryptomarket because it seemed like Bitcoin`s biggest hobby is to destroy every TA-Idea we have in short-term.
Now I`m getting concerned about the current situation that shows more and more weakness and could head to the long expected drop towards 3.000,-!
Bitcoin likes to ride the FAN-Resistance-Levels, fails at the 200 Moving Avera and is not able to reate new highs.
The magic 3 rule is one of my favourite strategies to trade Breakouts in the Forex / Stock-market.
Does that work with Bitcoin aswell? We will see.
Just wanted to share my worries / or good chances for a nice short momentum?
Stay cool, don`t panic and have a plan for all scenarios. ;-)
Cheers and good trades
Irasor


BRENT OIL about to be set on fire! Don`t miss that chance!Hey my friends,
im still waiting for the Breakout after I`ve traded that Double-Top-Pattern.
Now we will have to face a huge chance you don`t wanna miss!
We are out of season which could cause fakeouts due to less liquidity causing more volatility.
BUUUUT look at this. Good chance coming? It`s all up to the political situation!
We will see.
Peace and good trades
Irasor
Wanna see more? Don`t forget to follow me for daily ideas and posts ;-)

BITCOIN make a choice! Pray to the cryptogod!Hey tradomaniacs,
another "Short-term" detailed view on BTC.
It`s getting exciting!
Cheers and good trades!
Irasor
Want more? Don`t forget to follow me for daily ideas! :-)

S&P500 - Profitsafes and drop? Or new ATH?Hey tradomaniacs,
a new Chart for you guys! :-)
2.800 is the important price-level for us.
Can we hold the triangle? Will we crash through that support-line or do we create a double-top?
OR can we even HEAD to an ATH?
We will see. I`m ready for every scenario! =)
Cheers and good trades
Irasor
Wanna see more? Don`t forget to follow me for daily ideas! :-)

USDCAD Approaching Resistance Level, Potential Drop ImminentAs seen from the chart, USDCAD currency pair is now approaching resistance level.
A potential drop might happen and trend continuation imminent.
Do let me know what you guys think.
