Gold Technical and Fundamental Forecast For Long And Short Term After Looking At " Daily Chart Time Frames"
1.On 10th October 2018 There Was Rectangle Pattern Breakout .This Breakout is same on Weekly Chart 1214
That 1214 Is Strong Support Point For Gold
2.Recently on 13th Nov it traded one month low at 1196 So It Another Strongest Support
3.Looking at Fibonacci Level .38 any daily close above 1244 will be bullish Trend For Gold Till Target of 1280
OANDA:XAUUSD TVC:GOLD
On Fundamental Side : We are expecting High Unemployment rate for novemeber month in decemeber report and Higher number of non-farm payrolls Data
Secondly factor Which Can Lead Gold Upside Is Xi-Trump Meet
Third Is Brexit Event
Fourth is G20 Meeting Which Will Be another thing
For Investor and Traders who are looking to go long can go with stoploss of 1296 and target of 1264-1280
Dubai


Drake & Scull $DSI ~ High Risk Knife CatchHeavily Oversold
Daily Bullish divergence
New CEO - Yousef Al Mulla appointed
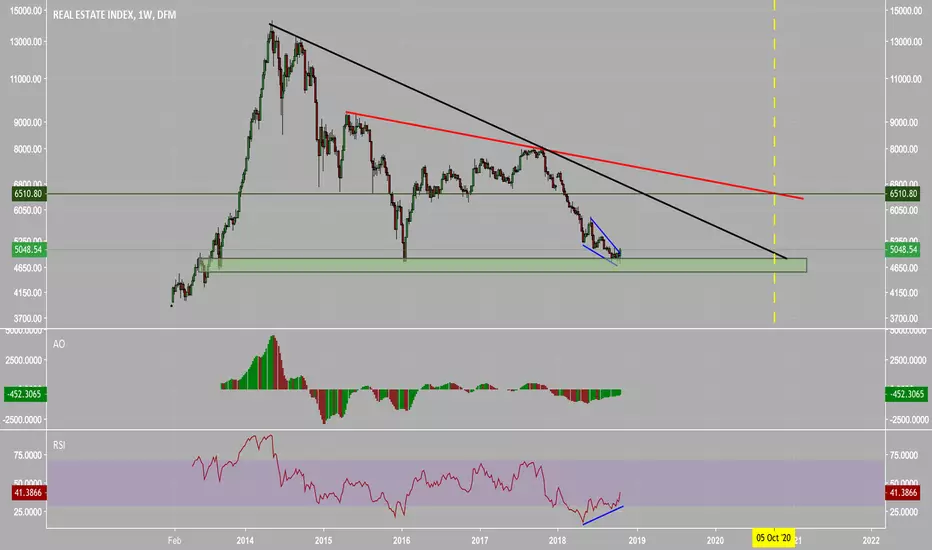
Should bounce with Real Estate Index looking very strong with clear bullish divergence


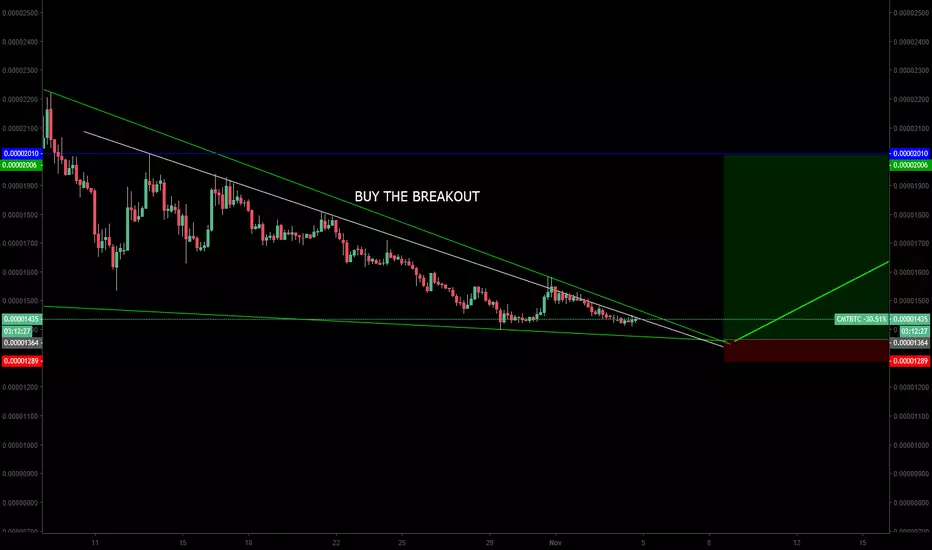
$cmt and its struggle to breakout.CMT has been accumulating for long time now and should breakout in coming week.
open a position only after it breaksout.
Do share your opinion about my analysis and hit a like if you agree with my thoughts.

Dubai Real Estate Index $DFMThe Real Estate Sector of Dubai's Financial Market is 46% of the whole market
-Long term support
-Bullish Divergence ~ Weekly timeframe
EMAAR PROPERTIES SHALL RISE EXPECTING A LONG MOVE ON EMAAR PROPERTIES STOCK PRICE LOOKING FOR LONG TERM TARGETS AROUND 9

A change in ALMADINA outlookThe stock is believed to be forming a bottom at current levels. Trading strategy would be buying at current market prices and wait for 0.45 level as first target, then breaking this level would give us the green light to target 0.55 then 0.60 on mid-term.

GBPUSD Short setupGBPUSD H1
Looking to sell this wave 3 or 5.
We are currently correcting the previous impulse in a 3 or 5 waves.
Let's see how this unfolds.
