Buy Signal Looks very good setup to me i will add another position here if market opens positive. Its a very good stock with strong fundamentals also the company is buying back its share which is a clear indication that its undervalued for now. Hold this for long term. Very Bullish
Hit like & follow guys ;)
Dubaistockmarket

Dubai Investment Capital (DIC)Price-Action is everything in your life :
life have three special point: Past - Present - Future

Finally Its BrokenToday finally the market broke the resistance of 3200 and it looks good for a run now, next hurdle is around 3275 zone. Over all market is bullish yes the volumes are still bit low but i am positive that gradually it will increase.
Hit like & follow guys ;)

Watch Out !!!Its about the break the box/rectangle and i am expecting a big move after this accumulation phase. Looks Bullish!!
Hit like & follow guys;)

2 Scenarios & Big MovesScenario 1 - Its at a very right place to burst upside that will be very ideal and a profitable, here I can see pattern with in a pattern and both are bullish. First is the triable pattern which is clearly formed and second is a potential inverted head & shoulder pattern that may form in coming days. To activate this pattern its very important that it stays above 0.475 once it breaks the resistance with big volume that is 0.50 we will see aggressive buyers coming in and pushing it higher and higher. For not its looking very good i would recommend to buy atleast some quantities at the current level so that you dont miss the breakout and once the resistance is broken more quantities can be added.
Scenario 2 - If the pattern fails it will drop back to lower levels and trigger more sell which obviously we dont want to see.
Since there are 2 bullish patterns and market is also positive i think it may break to the upside most likely. Even in higher time frames this stock is bullish!!!
Hit like & follow guys ;)

Long Term View - Bullish This is the monthly chart of DFM Index, market is in a healthy uptrend since April 2020 the best part is its moving up with small corrections and we dont see any parabolic moves. To continue a trend its always good that market corrects itself or come back to equilibrium to resume the primary trend. For now immediate hurdle for the market is to cross 3300 level. Next and major resistance is at 3650 level, market will not straight away climb up as usual we will have pull backs which will be seen as buying opportunities keeping in mind 2022 will see many IPO's and all are heavy weighted as these companies are govt. entities and will carry weightage on the index. Not to forget about RSI which is a momentum indicator for now its above 60 which also indicates the momentum is to the bullish side. I think 2022 will be very good for Dubai Stock Market and there are good chances that we may see new highs. Very good time to invest in DFM! over all very bullish I recommend everyone to invest in dubai, invest in uae this is the right time. Wishing you all a very happy new year!!!
Hit like & follow guys ;)

Looks good for a buyIt have tested the support zone so many times and with todays closing i think buyers are in action, it looks good till the gap which will potentially act like a resistance also it can be a TP1
hit like & follow guys ;)

Change in momentumWe can identify a double bottom patter in deyaar which is bullish also it have broken the neckline/resistance and closed higher. With the current scenario in the market with low volumes there are high changes that it may come back for the retest, this will be a buying opportunity for those of have missed the trade. Shift in the momentum is seen lets hope that is sustains the gains. No harm in taking some small quantities.
Hit like & follow guys ;)

Good for long termThis stock is very good fundamentally and technically as well, also a good stock to be in your portfolio. After a morning start kind of pattern its struggling to cross the resistance that is around 1.22 zone once the resistance is taken out we can see it flying higher. Over all very bullish!!
Hit like & follow guys ;)

At a crucial levelMarket is at a crucial level for now, to be bullish market have to close above 3175 else market will be under more pressure. Looking at the covid scenario more economies are implementing travel restrictions as cases are increasing rapidly around the world. Most likely markets will be under pressure till there is significant news about the vaccine or cases drop drastically. Its better to stay away from the market till the storm is settled.
Hit like & follow guys ; )

DFMGI DECLINE ACCELERATIONDubai stock market has finished or is about to finish its up leg, what will follow is a steep decline to uncharted territory
I have no positions in this market.

Get ReadyOver all bullish and it have recovered from the previous fall, I think it will make a big move soon to the upside. Its right at the support and at a buy zone sellers have tried to bring it lower but the very next day we can see bulls taking charge and holding the support zone. Very Bullish!!
Hit like & follow guys ;)

Will It Breakout?This stock is very slow with low volumes most of the time, overall insurance sector is under pressure for now. If this pattern gets activated it can be a very profitable trade. This is a bullish chart identified on a weekly time frame so the effect can bigger. Its in a range since so many weeks if it breakout positive the impact will be very big. Looks bullish!!
Hit like & follow guys !!
A Reversal patternLets see if the market can recover fully and resume its uptrend. For now i can see some good signs of market recovery.
Hit like & follow ;)

Many Hurdles AheadMarket after heavy selloff market have to clear all the resistances on its way. More negative news about covid 19 new variant is creating havoc !! most likely we will also see sell off tomorrow !!! For now stay away from the market.

Not Able To CrossMarket today recovered a bit but could not cross the resistance that was earlier a support zone, with international markets in recover mode i think UAE stocks will also recover slowly. Trend is still to the updside.
Hit like & follow guys ;)

More Down Side Another most effected was DFM heavy sell of was seen today along with other stocks. Wait for it to react at support zone. For now in a no trading zone.
Hit like & follow guys ; )

Market Is AdjustingThose who received Emaar swap shares started selling and market panic sell was seen, strong support is very near most likely market will hold in this zone and bounce back. Market is still in uptrend!!
Hit like & follow ;)

Morning Star?If it opens with a gap up tomorrow we can expect a morning star kind of pattern that is bullish and we can expect more upside, this stock is very powerful and very strong fundamentally as well. Good for long term holding. Over all bullish ;)
Hit like & follow guys ;)

More UpWe can see similar pattern previously after every red candle market pushes up, thursdays candle is positive and buying have again started. I think more upside is expected on this, lets wait for a break of this trend line to sell till thn its good for holding. very bullish after the financial results.
Hit like & follow guys ;)

Another Limit UP?Its holding at the support level for now also we can see a inside day candle - bullish, second gap is already filled a gap before that is not yet filled. If the market is positive and if it goes above 5.38 expect a limit up again. Else we can see some weakness and it come come down to fill up the gap it will but a opportunity - buy the dip!!!
Hit like & follow guys ;)

Buy or WaitWe also want to buy at support and sell at resistance, this is the stock right at the support but to confirm buyers are holding this zone we want to see bullish candle and thn enter the trade. Looks very bullish over all.
Hit like & follow guys ;)

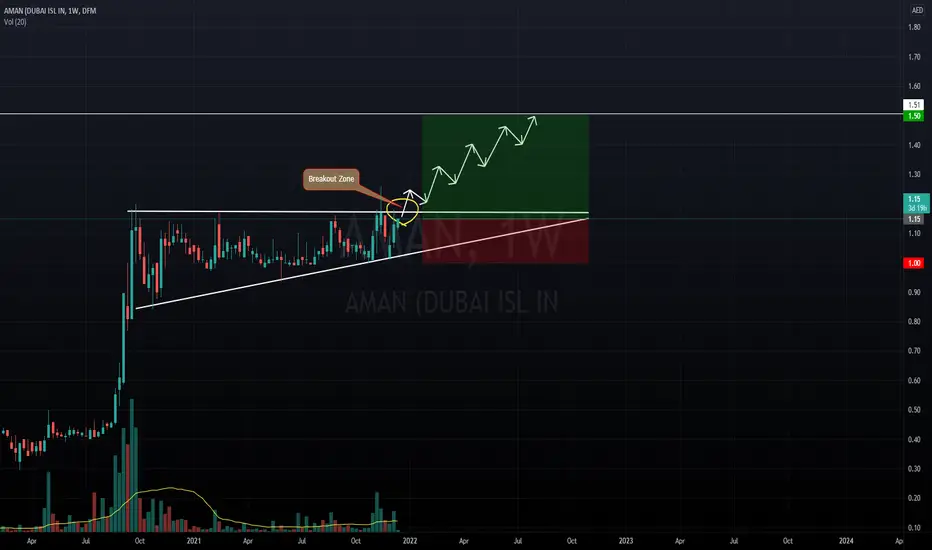
South or North?If we see the bigger picture on a weekly chart, we can see a breakout of a pole and a flag pattern. Yes we can see the breakout already and if the next candle or the last weeks candle can be taken as a retest candle which is a "success" for now then we can expect this stock to move slowly the the next target around 1.45-1.50 level. For now its a breakout, we should see a gap up opening or a flat opening it order for bulls to get activated. A gap down will discourage the buyers and will show weakness. Over all bullish!!
Hit like & follow guys ;)
