Bull Trap Confirmed: GBPUSD's 8% Rally Faces ExhaustionLets Face it we had a great 6 months already clocking 60%+ Returns already.
And after sitting ducks for almost 2 months now we finally have a trade.
- Its a very self explanatory chart
- Trading at resistance
- Head & Shoulder pattern
And the best part the right shoulder is still yet to be formed! My favourite type of entry.
1.It gives a better risk reward ratio (1:7 expected)
2.Better Entry (No long red candles)
3. And even if the pattern fails it we may still reach the neck line which is target 1.
Entry Criteria
- A Red candle at the entry Line Marked
- Stoploss Above the Entry Candle
Target 1- 1.3361
Target 2- 1.3252
Target 3- 1.3169
Keep Your Risk Reward Intact! Not An investment Advice
Dump

USDT - Hope AheadMorning my friends,
Figured I'd share a little bit of this USDT chart.
Deff showing a downtrend, even though our beloved coins are still suffering. Thats mainly because of BTC.D.
Once USDT moves lower, signaling a breakdown we should get a big relief, that if maybe paired with BTC.D moving lower as it is also near very strong resistance a bull market for alts will begin.
Keep an eye on this descending triangle breakdown.
Trade thirsty, my friends!

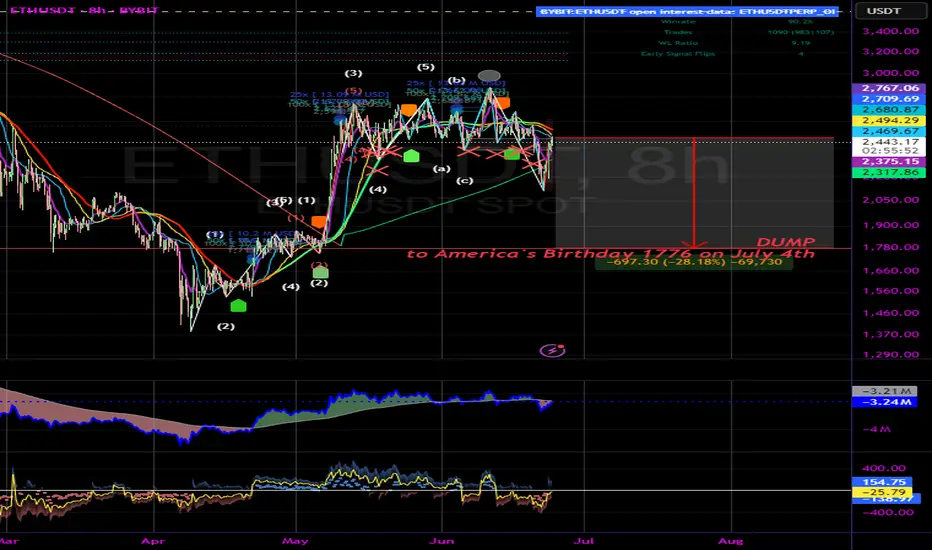
ETH Dumping to 1776 in honor of America's birthdayBART express incoming. Nice liquidity grab down there as well.
Not financial advice.
Happy July 4th!
Dogecoin is dead, short it to zeroDead coin already RIP
Doge coin can't go any higher and had lost fame and momentum

$BTC/USDT MAJOR PUMP? or MAJOR DUMP?BTC, the worlds biggest and fastest growing coin. With a market cap in the Trillions, we are facing a major moment.
Will price dump? or will it pump and go above and beyond.
Lets find out in this analysis!
1. Trend Overview
HTF Bullish:
Price remains above the long-term bullish trendline, showing strong macro support.
Recent price action is consolidating within a major supply zone and liquidity cluster — signaling indecision before a breakout or breakdown.
📈 2. OBV (On-Balance Volume) Analysis
OBV is coiling in a symmetrical triangle, indicating a volume squeeze.
This tightening range typically precedes a major breakout or breakdown, matching the price consolidation near resistance.
🔄 Market Structure
Price has formed a potential top just under the supply/liquidity zone (~$110,000–$112,000).
Swing High is defined just below $112K.
Key structure zones are:
Resistance zone at current levels.
Support zones:
1D FVG ($97K) and Weekly FVG ($87K–$93K)
🟪 Supply & Demand Zones
Supply Zone: $100k - $112k — multiple rejections here indicate this is a key short-term ceiling.
Demand Zone: Deep support between $50-$57K, aligns with trendline and historical value area.
🔵 Fair Value Gaps (FVGs)
1D FVG: $97K area — may act as magnet if price breaks below resistance.
1W FVG: $87K–$93K — stronger structural level to watch.
If both are filled, price may meet the bullish trendline around $90K.
🧠 Liquidity Zones
Above current price: ~$112K is marked as a liquidity grab area — stop hunts may occur before major reversal.
Below: FVG zones could trigger a liquidity sweep downwards before reversal.
🔴 Volume Profile
Strong high-volume node (HVN) around $80K–$97K: acceptance zone, likely to act as magnetic support.
Above $110K is a low-volume node (LVN): if broken cleanly, price may accelerate quickly toward $120K+.
✅ Bullish Scenario
Break above $112K → sweep liquidity → continuation toward $120K–$125K. (Price Discovery)
OBV breakout upwards would confirm.
Hold above FVG 1D if retested = healthy bullish continuation structure.
❌ Bearish Scenario
Rejection at supply → drop to FVG 1D ($97K), then potentially Weekly FVG (~$93K).
If OBV breaks downward, it confirms bearish volume divergence.
Breakdown below trendline could target deeper into demand zone (~$70K+).
📌 Summary
Bias: Neutral-bullish short term, bullish macro (above trendline).
Key Breakout Level: $112K.
Critical Support: $91K–$97K (FVG cluster).
Confirmation: OBV breakout + clean structure break.
Invalidation: Weekly close below long-term trendline and FVG zones.

Ravencoin ( RVN)RVN usdt Daily analysis
Time frame 4hours
Risk rewards ratio >1.5
Target = 0.01133
Short position for short time

The Collapse of the Bitcoin ExperimentFew are prepared for this scenario, yet it's the most probable one: Bitcoin is heading for a major crash in the coming years.
What was once a revolutionary idea has become a centralized shitcoin, failing nearly every purpose envisioned by its creator. Aside from gamblers and speculators, hardly anyone truly believes in Bitcoin anymore.
The experiment has failed — it's time to accept its fate.
This will be the biggest short trade in the history.
05 June, 2025
Doomsie
Pump and Dump🚨 Market Update – AGT Traders Beware 🚨
On May 21, Binance saw $141.14K in short liquidations vs. $90.47K in longs.
Today, just on Gate.io, there were a whopping $609.92K in long liquidations.
Overall volume remains low compared to previous days - signaling weak momentum and increased risk.
📅 On June 1, 82.35M AGT tokens (~$2.57M) will be unlocked.
⚠️ Expect high volatility - potential pump and dump scenarios.
Stay cautious out there.

#AAVE #AAVEUSD #AAVEUSDT #Analysis #Eddy#AAVE #AAVEUSD #AAVEUSDT #Analysis #Eddy
As can be seen in the chart, the price has moved towards the supply area with a compression and has formed the 3-drive and can fall from the indicated supply area towards the daily demand zone.
I have identified the important supply and demand zones of the daily timeframe for you.
This analysis is based on a combination of different styles, including the volume style with the ict style.
Based on your strategy and style, get the necessary confirmations for this analysis to enter the trade.
Don't forget about risk and capital management.
The responsibility for the transaction is yours and I have no responsibility for your failure to comply with your risk and capital management.
💬 Note: Stop losses behind the supply and demand zones are usually hunted by market makers. Be careful of stop hunts and do not enter a trade without getting confirmation and without having a proper trading setup.
Be successful and profitable.

#CRYPTO #BTC #ETH #WARNING #DUMP #COMING #WYCKOFF #SHORT#CRYPTO #BTC #ETH #WARNING #DUMP #COMING #WYCKOFF #SHORT
50% DUMP is coming for #Bitcoin & #Ethereum
This analysis is based on the analytical style of the Wyckoff Distribution Structure of Schematic #1.
I have outlined for you the important parts of the Wyckoff style on the one-hour timeframe on Bitcoin & Ethereum.
Currently, we are in Phase C of the Wyckoff Distribution Structure on Bitcoin & Ethereum.
We have to wait for the completion of this phase and the start of Phase D of the Wyckoff Distribution Structure.
See my analysis on Bitcoin & Ethereum now and read the full description section.
My Wyckoff Analysis of Bitcoin:
My Wyckoff Analysis of Ethereum:
The responsibility for the trade is yours and I have no responsibility for your failure to comply with the risk and capital management.
Good luck and be profitable.

#ETH #ETHUSD #ETHUSDT #ETHEREUM #Wyckoff #Analysis #Eddy#ETH #ETHUSD #ETHUSDT #ETHEREUM #Wyckoff #Analysis #Eddy
This analysis is based on the analytical style of the Wyckoff Distribution Structure of Schematic #1.
I have outlined for you the important parts of the Wyckoff style on the one-hour timeframe.
Currently, we are in Phase C of the Wyckoff Distribution Structure.
We have to wait for the completion of this phase and the start of Phase D of the Wyckoff Distribution Structure.
When will this structure be fully confirmed? When the Ethereum price falls to the 1750 support and gathers the final spring when this support is broken for the fall, we will enter a short position by getting the necessary confirmations based on our style and strategy.
💬 Note: The best entry point for short positions will be the 1720_1750 support break. if the Ethereum price UTAD and test formed, high-risk traders who are willing to trade in the opposite direction can enter a short position by getting confirmation in the time frames below 15 minutes.
Where will the targets be? The first target is 1500 and the second target can be 1000 dollars. Maybe next targets is : 800_500 dollars.
When can you safely close the position and enter a reverse trade, that is, long or buy? When a Wyckoff accumulation structure is formed at one of the targets.
The responsibility for the trade is yours and I have no responsibility for your failure to comply with the risk and capital management.
Good luck and be profitable.
I also invite you to review and view my latest analysis on Bitcoin & TOTAL3 on my page.

#BTC #BTCUSD #BTCUSDT #BITCOIN #Wyckoff #Analysis #Eddy#BTC #BTCUSD #BTCUSDT #BITCOIN #Wyckoff #Analysis #Eddy
This analysis is based on the analytical style of the Wyckoff Distribution Structure of Schematics 1 and 2.
I have outlined for you the important parts of the Wyckoff style on the one-hour timeframe.
Currently, we are in Phase C of the Wyckoff Distribution Structure.
We have to wait for the completion of this phase and the start of Phase D of the Wyckoff Distribution Structure.
When will this structure be fully confirmed? When the Bitcoin price falls to the 91800 support and gathers the final spring when this support is broken for the fall, we will enter a short position by getting the necessary confirmations based on our style and strategy.
💬 Note: It is not exactly clear whether the market maker will act based on Schematic 1 or 2, so the best entry point for short positions will be the 91800 support break. If, based on the schematic 1, the Bitcoin price UTAD and test formed, high-risk traders who are willing to trade in the opposite direction can enter a short position by getting confirmation in the time frames below 15 minutes.
Where will the targets be? The first target is 62000 and the second target can be 46000 dollars.
When can you safely close the position and enter a reverse trade, that is, long or buy? When a Wyckoff accumulation structure is formed at one of the targets.
The responsibility for the trade is yours and I have no responsibility for your failure to comply with the risk and capital management.
Good luck and be profitable.
I also invite you to review and view my latest analysis on Bitcoin via the link below:
For altcoins, follow my analysis on the Total 3 chart.
My analysis of the Total 3 chart:

AT&T I Tipping Point : Short Opportunity with Head & ShouldersHey traders after a previous trade trade on the hood hitting targets of 16.4%. Today I bring you NYSE:T
Technical + Fundamental View
Pro Tip
- Breakdown below the Entry Line will be considered at Trade Initiation. (Risky Traders)
R:R= 5.4
- Rest can follow entry at day close post breakdown SL above Entry Candle.
- The Breakdown Below the Entry Line will confirm the head and shoulder pattern
Entry Line - 26.93
Stoploss - 27.53
Target 1 - 25.59 (Neckline of head and shoulder)
Target 2 - 24.74
Target 3 - 23.68
Technical View
- Head And Shoulder on Daily Time frame
- On the hourly timeframe, the chart looks weak, showing a potential double top pattern where the second peak is lower than the first, indicating growing investor fear.
Fundamental View
- High Debt: Over $140 billion in debt limits investment capacity and consumes significant cash flow.
- Network Issues: Poor service quality and outages risk losing customers to competitors.
- Strong Competition : T-Mobile and Verizon offer better plans, making customer retention harder.
- Market Saturation: The U.S. wireless market is nearly saturated, limiting new customer growth.
- Execution Risks: Growth and debt reduction depend on flawless asset sales and network upgrades; delays could harm finances and stock performance.
Additional Considerations
- AT&T’s valuation is higher than some peers, potentially capping upside.
- Telecom market competitiveness means growth hinges on successful 5G and fiber rollouts.
- Dividend yield (~3.9%) is attractive but lower than some rivals, which may impact income investors.

I'm Bullish, but... CHR / USDTEvening fellas,
My latest posts are bullish, and I did long some coins during the blood we had a couple of days ago.
But one must always be ready and I am seeing something interesting in a couple of coins, showing me that there's a hidden bearish scenario behind all the hype.
CHR is one of those coins, it's got good news, hype, etc, but I think MM'rs want to destroy some lives.
Keep an eye on it.
Trade thirsty, my friends!

People Used To Get Scared - BTC / USDMorning folks,
Read the chart, it contains all information.
I figured since I didn't update my inverted Adam & Even pattern chart much I'd just create a new one, but check it out, its playing marvelously.
Trade thirsty!

What on Earth Is a Circuit Breaker?!Every couple of days since April 2nd, everybody's been talking about a stock market halt all day. You're left there trying to Google it so you're not the only person in the group chat who doesn't know what's going on. But actually, nobody else in your group chat knows what's going on either. They're low-key Googling it under the desk. You don't have to know everything in the market to be a "seasoned" trader. What does get disappointing is when people guess instead of providing facts or a direct link to an article about market halts.
So, this is your quick-but-detailed-read article/ guide to market halts and circuit breakers. Send it to your friends in that group chat. Why today's dump happened in the first place? More on that later. It's a long story. 🥹
What is a circuit breaker?
It's simple: a circuit breaker is a 15 minute OR whole-day market-wide HALT when the market reaches 1 of 3 decline levels. It all depends on the level, how fast the decline is, and potentially other factors that we are not aware of. Keep in mind this is not something we have to deal with often.
When does it happen? And what stock does it track?
Good question. The halt is triggered following declines in the S&P 500 only . That is: AMEX:SPY SP:SPX $CME_MINI:ES1!.
If these level 1 & 2 are reached before 3:25 PM EDT , there is a 15 minute market-wide trading halt. Meaning you cannot enter or exit positions. If level 3 is reached at any time in the day, the entire day's trading will come to an end.
Level 1: -7.00% | 15 minute halt
Level 2: -13.00% | 15 minute halt
Level 3: -20.00% | Entire day halt
So when the S&P 500 index reaches -6.98%, be sure a halt is coming very soon at -7.00%. Sure, like today, "they" might pump it and use that as support and prevent a halt (we got very close to -6.35% on CME_MINI:ES1! if I'm not mistaken). But it's good to be vigilant and make sure you're not in any daytrades.
Does CME_MINI:NQ1! NASDAQ:QQQ CBOT_MINI:YM1! trigger the halt also?
No. The halt is only triggered by the S&P 500. The Nasdaq Composite famously moves much more than S&P 500, so a 7% drop in S&P is way more dramatic than a 7% drop in Nasdaq and it's highly likely at -7% in S&P that Nasdaq would be at -8% or -9%. Although, both are undoubtedly decimating for any long positions.
Why does this rule exist?
This was introduced after Black Monday of 1987 where the market was free falling ( DJ:DJI dropped 22.6%) with no safety stops in place to prevent a market-wide disaster. This prevents further panic selling and massive stop loss raids, and also gives institutional traders time to zoom out and see the bigger picture.
How close did we get recently?
Today we got within 0.7% of getting a 15 minute halt.
See for yourself:
And the intraday 15 minute chart:
FUN FACT: What if I shorted the top on CME_MINI:ES1! ?
Assuming your time machine goes back 24 hours (some time machines only go back 10 years minimum), you'd have booked 1500 ticks at $12.50 per tick. So around $19k per contract. You know that's not too bad. It's almost a Toyota Camry per contract. Do better! 😆
How do I trade this?
Do you really have to? Please do not FOMO & catch a falling knife. Trade light. The market is open for the rest of the year. Trade with a stop loss, and remember, if you FOMO'd and bought at -3% just because it's down 3%, you'd have gotten decimated. Use the charts not the % on your screen. 🔥
Hit the follow button for free educational content because knowledge is free. KD out.

BNB / USDT - Downfall AheadEvening friends,
Lotta hype on this coin right now, but I have to leave my thoughts here.
Its straight forward so I won't take long here, just read the notes and let me know what you think.
Trade thirsty!

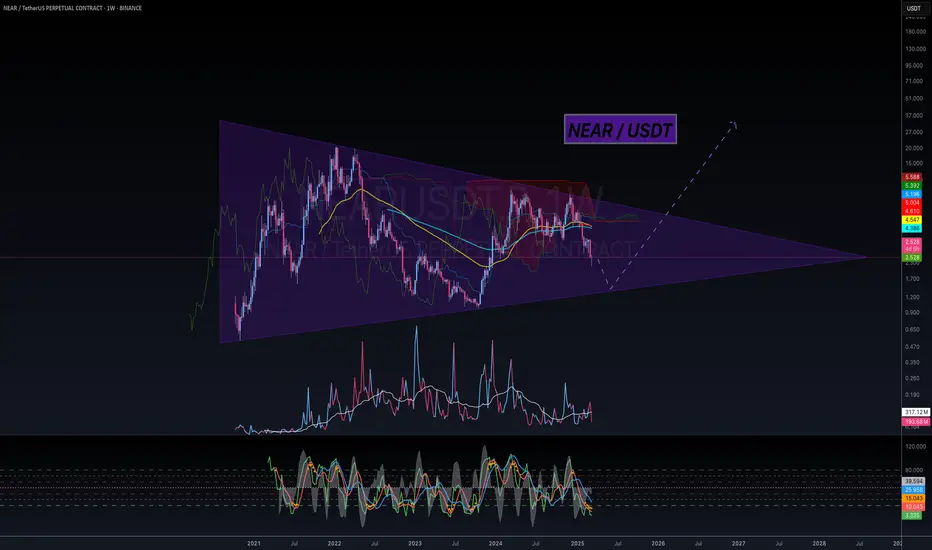
I'm Bullish, but... NEAR / USDTHello again my brothers and sisters,
3 Drive Structure, do I need to say anything else?
I mean, look at this symmetrical triangle, when this blows, in the past, did it only touch base twice? I dont think so, 3 drive structure is needed for this and then we can be extremely bullish!
I'll be loading my boat down there.
If this helped you out, let me know!
Trade thirsty!
I'm Bullish, but... BTC / USDHello my friends,
At a minimum we're looking at 30 days inside this wedge before breaking out and testing the $96k range once again. Trust me, Bitcoin must form a bullish structure before doing anything interesting.
It could wick to FWB:73K but I'm thinking the heavy orders around $75k might hold and we range instead of dumping more.
Keep an eye on this wedge.
Trade thirsty, my friends!

I'm Bullish, but... MANA / USDTHi friends,
My latest post about MANA was bullish, and I did buy some of the blood we just had.
But this would be another coin that could drop 25% - 30% giving a great opportunity.
Keep an eye on BTC cause if it dumps, this will happen.
Trade thirsty!

Tariff FUD is reking ports. SPY 505 First Stop. 460 Second.Trading Fam,
It's no surprise that Trump's implementation of high tariffs would cause initial FUD. This can be observed in the massive spikes on the $VIX. What is unknown and has caught many traders by surprise, myself included, is how substantial of a drop would be incurred by investor uncertainty.
Initially, it did appear that 500 might hold. That was a huge support. I knew if it broke, the sell-off would be deep. But I held hope that the market would hold above this trendline. It did not. So, yesterday and today, investors who held are incurring substantial losses.
For those who were smarter than me and sold at or near the top, congratulations! You've saved yourself some duress and cash. Now, some are calling this the beginning of a longer bear market. I still don't see it that way. Honestly (and I know this will be hard to believe), I still see the SPY hitting my target #3 at 670-700 before 2026 comes to an end. Longer-term we still remain in a massive secular bull market since 2009 and to break this long-term trend, the SPY would actually have to break below 300. That is a long way down and I just don't see that happening, though as always, I definitely could be wrong.
Shorter-term I am seeing two prominent areas of support. The first has almost been reached at 505. If I would have played this correctly, I'd be DCA'ing in my first load of cash here. The second area of support is at around 460 and slightly rising daily. This would be where I DCA'ed in another load of cash. However, if that broke, I'd exit immediately and reassess the charts. 300 is a long way down, but over the past 5 years we have seen some extraordinary market price action and volatility. TBH, even the best of us technicians are struggling to understand the larger macro-economic picture, but I'd wager to say that tariff fears may be overexaggerated as market reactions often tend to be.
One interesting note is that crypto price action no longer seems to correlate and prices have help up surprisingly well. Could this be our first indicator that the markets are due to turn up again in a few weeks/months? Unknown. But I can promise you I'll be watching this all closely.
✌️Stew

Will APTUSDT Bounce or Break? Last Chance for the Bulls?BINANCE:APTUSDT.P
🚨 APTUSDT is sitting at a crucial level. After multiple CHoCH and BoS signals, price has dumped into the key Demand Zone (PDL) . Now it’s either a spring up or a deeper dump to the next liquidity zone.
📌 Technical Outlook:
CHoCH → BoS → Liquidity Grab: Clear bearish structure.
Equilibrium broken: Bulls failed to hold control.
Now: Price is testing the blue Demand Zone (PDL) with big orders possibly resting.
🎯 Trade Plan:
Scenario 1: Long from support zone
Entry: bounce from 5.45–5.50 USDT
Stop-Loss: under wick low at <5.38 USDT
Take-Profits:
TP1: 5.70 USDT
TP2: 5.90 USDT (Equilibrium zone)
TP3: 6.00–6.15 USDT (Imbalance + Premium zone)
Scenario 2: Short after PDL breakdown
Entry: break and retest below 5.45 USDT
Stop-Loss: above 5.55 USDT
Targets:
TP1: 5.20 USDT
TP2: 5.00 USDT
📊 Confluence Factors:
Volume spike = buyer activity
Local CHoCH inside zone = reversal signal
Strong impulse down may sweep liquidity
💬 Final Thought:
APT is at a pressure point — it’s spring or capitulation. Clear setup, no tilt.

#KAITO #KAITOUSDT #Analysis #Eddy#KAITO #KAITOUSDT #Analysis #Eddy
Everything is clear and I have clearly drawn the important areas in the chart and the labels and names of the areas are included. Depending on your analytical style, you can get the necessary confirmations and see the reduction from the marked areas to the specified targets.
