neutaralBINANCE:BTCUSDT
In order to be able to see the chart rise or fall, we have to wait for the future price channel to be broken and confirmed.
Dump

THE BIG SHORT 2.0Please tell me I'm wrong!
I see a Head and Shoulder Pattern approaching the Neckline on US100 aka Nasdaq...

Big shortasoda, before big pumpasoda.Fill your bags with shorts, be a smart trader, do not miss fear in the market.
We all gonna make it, soon Bahamas guys!
It has pumped a lot, all stocks in $NASDAQ are green, all seem like overheat.
Cheers.

BTC UPDATE (Decision for pump or dump)Bitcoin makes a falling wedge or flag pattern, an important decision for btc to breakout up or down.
Thanks.
#DYOR #NFA

SPY price Analysis May 23rd- SPY SETTING TO DUMP Spy is setting its self up for another sell off- I'm shorting down to 380.

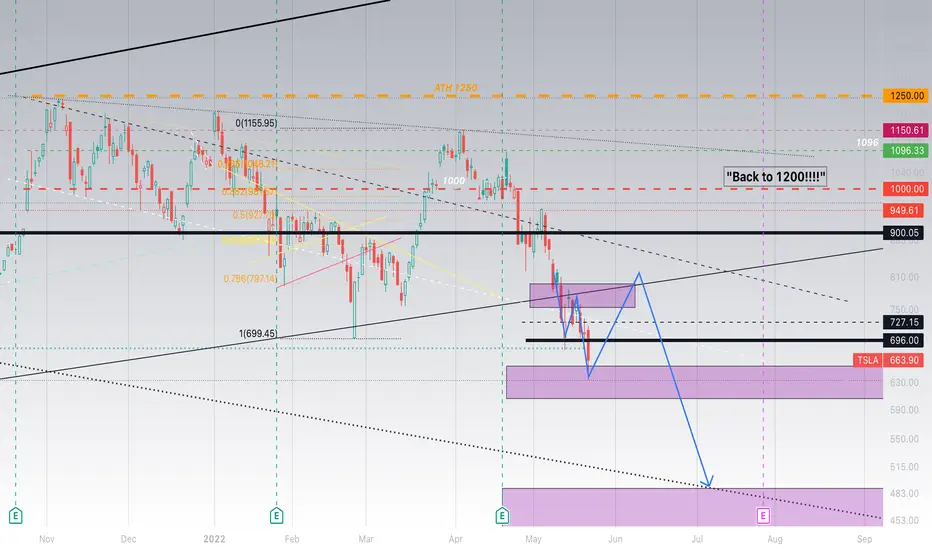
TSLATSLA may bounce off the given buy zone.. and then get right into the next buy zone in the 400's
Watch for a move above that 727 level. 820 can come if it breaks above there.
Continued selling of course can follow still in the days to come as we've seen the last few weeks, although I can not ignore my support levels that I mapped out weeks ago prior to these levels being now reached.
400's load up.
KNC Unfortunately I seem to have run out of image copy/paste into chart. However my analysis of KNC using data from Nansen.ai is that KNC has some way down still. On the 15th of May whales dumped the token and now it is no longer one of their major holdings. With this in mind I dont expect it to sustain the current relief pump. My best guess is that we will see the bottom be touched a number of times from here.
Overall since September 21th the trend on Kyber V2 is down in terms of weekly DEX trades.
In terms of transactions the majority of transactiosn are to and from CEX exchanges. Unfortunately with the exception of FTX there is currently a higher inflow of tokens towards exchanges than outflow.
Overall I am confident that long term (Possibly when FED returns to neutral policy), KNC will thrive as a token as certain levels of interest have been touched creating a fostering ground for future value. However, in the short term, I expect the bottom of to be touched at least one more time. Overall whales have not started buyign back the tokens they disposed of on the 15th of May.

NOWSeems likely for NOW to fall to this weekly volume shelf at support before getting any meaningful bounce. Stocks continue to slide.
280-300 support is likely where it falls to

EWGEntered short again today in the German equity ETF
$19 is possible to find as support. Was a gift to buy above $26

ETHUSDT MAJOR SUPPORT!!! *SOON 600*ETHUSDT is at major support level which if gets broken ( I think it will) we will see very bearish movement to downside.
Why 600?
This is first support level which can show some sign of support .
You can see it pumped so much without any small pullbacks to feel imbalances in market and now they need to be filled.
I think it will break down because of bitcoin also being very bearish. This isnt move that will happen in week or month.
It will take good amount of time for ti to reach this level
But this year looks like it will be very bearish till the end.
This is not financial advice, I am just sharing my opinion.

BTC Bounce Back Soon ?The Relative Strength Index is oversold on the Weekly Frame, knowing that the last time Bitcoin was oversold was in 2020 and we know what happened after that.
This might give us a nice bounce in the short term , nevertheless I'm still bearish.
Not a Financial Advice

AAPLApple been short for a while now when it made 3T headlines
It's now trading in the high 140's and may continue to drop all the way towards the low 100's soon -- idk when but the chart shows that it's very likely and would reach a thick amount of bids maybe around the 125 area.

BTCUSDT | should we expect a big dump for market?As we can see, the market is in a critical position. I expect the market to fall around $24,000. But we must note that there are important support ranges in this area.

37k & liftoffTraditional markets taking a dive since the Fed spooked them with tapering. BTC decided to follow per usual. This idea here is based on my "Holy Grail" where each cycle touches a distinct point exactly in the middle (log based 0.5 fib) which, by definition, points to a 1.0 fib that's much higher (250k). When the market reversed in July, I thought "maybe it was close enough (4% off) & we'll see the parabolic moment begin.
It sure looked like that, and nothing is off the table. In the event that we see this 0.5 fib touch (which is around 25-27k based on my predictive 1.5 fib), we may see this in the form of a pennant such as we did in 2017 on the way up. Before that, however, I find it interesting that we have a sort-of "Running Flat" ABC wave forming similarly. This would put us at 37k before retracing to the 0.786 or so (alt season anyone?!).
Who knows if this is how it plays out. Who knows if it reverses here & goes parabolic. Who knows if it goes to 10k. All I'm saying is that if you look at my last video which I will link in related ideas, there's something going on that seems "programmed". I can say with 99.99% certainty that we won't see below 25k & if there's ever a time to get into the market, now is definitely not a bad time considering where all things point to (minimum 140k). Who knows when, though...
See "Holy grail" for a text description and see "200k-265k Cycle Top" for a full description (20minutes)

btc 24k us i siad fro 1 year ago btc 24k it followed the move so good check my old charts
now let's f goo
lost supp 24k on the way lost fib channel sup
lost ema
lost every thing
usdt up to the moon
dxy to the moon
s&p down apple down every thing down
see you at 24k boys haha
26k could be point off interest

Bitcoin AnalysisBitcoin is in a downtrend and has only two scenarios to continue moving
1. Pump to 38,800 $
2. Dump to 25800 $
It all depends on the 29,000 $ support
what is your opinion ?

LUNA is Rekt - The How and Why Terra UST was the 3rd biggest stable coin and lost its $1 peg causing LUNA to spiral
Once UST lost its peg from $1 to for example $0.50, someone could buy 100 UST for $50
and redeem it for $100 of LUNA and then sell that to USDT — making money on the arbitrage.
This essentially is what triggered the Death Spiral for LUNA because the price of LUNA is
dropping with the peg, it became race to redeem for LUNA before the value drops below
the redemption price
The UST peg failed for two main reasons:
Curve pool imbalance (On Chain Selling)
$350m UST was swapped for USDT using the Curve protocol. This left a disproportionate amount
of UST versus other stablecoins in the pool for users to swap against, thus lowering the
value of UST "on-chain"
Curve is a crucial piece of the DeFi ecosystem, allowing users and dApps to swap stablecoins efficiently.
The massive selling of UST on Curve created an imbalance in reserves, leading to the value of UST falling below the peg on the protocol.
The remaining portion of UST withdrawn from Anchor protocol was sold on centralized exchanges
like Binance driving down the value on those markets as well (Off Chain)

gmt going to stabilize in its maybe fair price.gmt is going to enter a falling wedge after which i see it stabilizing pretty well if all this doesn't evaporate along wiht the global economy, as it seems to be happening. me personally im withdrawing all my assets to buy rice an macarroni and a land far far from this society

BTC | ew | Looks corectivebtc looks corective , in my opinion we have this scenario that will end arround 33.5k -34k and continue down to complete an A wave for Y wave , After this A wave is finished we will have a pump B wave and continue for C wave and complete the WXY BIGGER PATERN that started from 69k ,Y complete is 23k 1st target , and 19k seccond. i will do a full scenario on the bigger time frame soon with targets for B wave. This scenario is on the 15min tf.

Total 2 Analysis? more dip is coming!!!📊 Total2 marketcap
🕒 Daily Analysis
🟢 The TOTAL2 broke the important support and dumped hard from breaker block. Most altcoins see double digit loss in last 48 hours. TOTAL2 is now taking support at $780-$800 billion area. IWe might see a test of $925-$970 billion resistance now. If it goes above this resistance then we see some positive movement otherwise the dump will continue. Use proper stop in all your position because of market situation.

BTC Chart Updates *NEWHello TradingView community and my subscribers, please if you like ideas do not forget to support it with your like and comment, thank you so much and we will start.
Today I want to share my opinion with you about btc / usdt

Spy Bipolar? Whats the market doing? What a crazy week!!! I hope everyone didn't lose too much money this week, I know this price action is crazy and it is only going to get worse. Im currently long and eyeing 430s to test and gap fill.

Will history repeat itself? Interesting comparison from 08' & 22I was looking at the start of April 2008 through May 1st 2008, when I noticed similar price action from April 2022 through May 1st 2022.
On both charts, at the start of April to the 1st May the price fell an average of 16%. Since I know what happened in 2008, I used the fib retracement to see how much of retracement the NASDAQ would go and how long it would take. On the left chart, you'll see NDAQ retraced back to the .618 level on Wednesday, May 7th. then got rejected by the 200 day moving average. The following week the CPI report for April was released Wednesday, May 14th which caused a huge dump that lasted to the third week of May. That dump was a total of 19%. That is insane! So, I started to think maybe the same thing will happen this current May 2022. It is very possible that history will repeat itself. I decided to fib retracement April-May exactly how I retraced it in 2008. According to my calculation it should take 7 trading days in May 2022 to reach the .618 fib level. That is exactly where the 50 day moving average is at price $172. This is the same day the April 2022 CPI report will be released Wednesday, May 11th. If we retrace by then and then later the market dumps 19% like it did in May 2008. The dump will hit a current major support level at $140-145 zone! Well isn't that a coincidence? That price level $140-145 became the major support on Jan 2021. The same year that inflation started to take affect on our economy. Could it be possible that we crash this May as a symbol to end inflation?
