STOCK MARKET ANALYSIS! BEAR MARKET IS HERE? I hope you guys enjoyed the video, If you have any questions or comments feel free to comment down below! Thanks for watching.
Dump

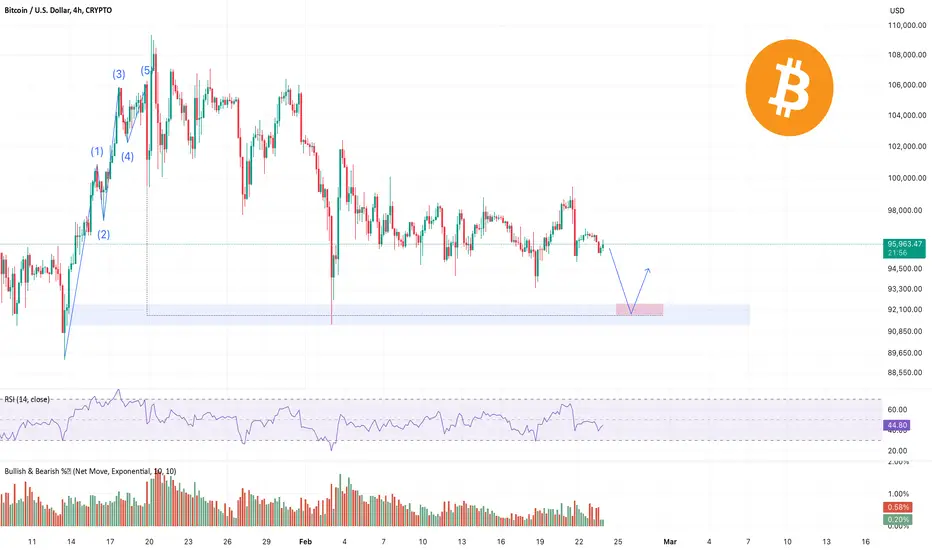
Bitcoin bear market is just started wait for next 20K$ dump As we mentioned before and on chart we had double top which is formed completely now and 92K$ support zone also is now valid resistance zones and retest of this broken support is completed so more fall soon can start and dump price to the targets like 77K$ and 72K$.
DISCLAIMER: ((trade based on your own decision))
<<press like👍 if you enjoy💚

Tesla I Tipping Point: Short Opportunity with Head & Shoulders Short opportunity on Tesla
Based on Technical + Fundamental View
-market structure
-Head and shoulder pattern
-Double top
-Currently trading at supply zone which was a recent support and now an ideal place for a reversal to create the right shoulder of the bigger head and shoulder pattern - Daily time frame
-Product Development Delays
-Margin Pressure
-Decreased average selling price
- Increased Competition
- Flat /Declining Sales
- Leadership Concerns: Elon Musk's polarizing political activities and his divided attention between Tesla and other ventures (such as his involvement with OpenAI) have raised concerns among investors. Some analysts suggest that Musk's public perception may negatively impact consumer sentiment towards Tesla, leading to decreased sales and loyalty among customers.
Technical view
Double top
Unlike the classic double top, where the second peak reaches or exceeds the height of the first peak, the Type III double top fails to reach the previous high. This failure signifies a significant shift in market sentiment and an increase in selling pressure than usal.
Head and shoulder pattern - Pretty visible. Right shoulder is yet to be formed, Which makes an ideal place to SELL with a Risk Reward ratio. (Approx 1:6.4)
Pro Tip
Wait for a bearish candle stick pattern to execute trades on end of the day keeping stop loss somewhere above the supply zone.
Target 1 - 307$
Target 2 - 271$
Target 3 - 237$
Stop Loss - 380.21$
Fundamental View
Valuation Concerns: Tesla's stock is currently viewed as significantly overvalued, with a fair value estimate of $210 per share according to multiple analysts, including Morningstar and Firstrade. This valuation reflects a substantial premium over its current trading price, indicating potential downside risk for investors.
Earnings Performance: Tesla's Q4 2024 earnings are anticipated to show continued improvement, with expectations of gross profit margins exceeding 20%. Analysts believe that the automotive segment's performance has stabilized after a challenging first half of the year, driven by increased deliveries and lower production costs.
Market Dynamics: Despite strong demand for Tesla's vehicles, the company faces pressures from declining average selling prices due to price cuts implemented in 2023. This trend is expected to continue as competition intensifies in the electric vehicle (EV) market.
Product Development: Tesla is set to launch new models, including an affordable SUV (Model Q) aimed at increasing market share in the lower-priced vehicle segment. Additionally, advancements in autonomous driving technology are critical for future growth, with plans to roll out Level 3 Full Self-Driving software in select states and regions.
Analyst Ratings: The consensus among analysts remains mixed, with a combination of "buy," "hold," and "sell" ratings. The average price target reflects a cautious outlook, suggesting that while there is potential for upside, significant risks remain due to valuation concerns and competitive pressures.
Not an investment Advise

Avalanche (avax)Avax usdt Daily analysis
Time frame daily
As you see on the chart , if decrease of avax stops on 17.5 $ the pattern (double bottom)will create.
So we will see the end of decreasing and avax will reach to 25$
On the other hand , if price breaks down and reach 15 EURONEXT:OR less , this pattern will failed

Last Leg of The Bull RunBased on historical patterns, I believe we are in the final phase of the current bull run. Analyzing previous market cycles, the peak of the 2013 bull run to the 2017 peak had a 49-month bar separation, while the 2017 to 2021 cycle exhibited a 47-month separation. Following this established “-2” pattern, the next peak is likely to occur with a 45-month separation.
Additionally, we are currently positioned within a monthly fair value gap, which could drive the market to new highs. However, I remain skeptical about the sustainability of this rally due to the impact of the U.S. crypto reserve. Institutional investors may perceive this as an opportunity for exit liquidity, aligning with the well-known market principle: "Buy the hype, sell the news."
- Gavin
do your own research
not financial advice just a speculation

Bitcoin Final UpdateEverything on the charts...
Up to you now... Yes... I believe it's just Reaccumulation
Look at the previous posts for more explanation and all perspectives
I'm holding and I'm bullish...We will witness an alt season this year (those saying we won't will be proven wrong...)
BTC.D will fall and strong alts will rise (with massive returns)
Until Next Time...

BTC - Bigger Picture of Liquidity Collection RoadmapExpanding on my last idea focusing on the first move in this sequence, here is a bigger picture of this idea and I will explain in detail how I arrive to this.
1. The market is always going to absorb liquidity.
We know this. We also know that since Dec 2022 Bitcoin has been on a steady climb up allowing for lots of long positions to open and stay open. What this creates is a lot of absorbable liquidity in the form of long position stop losses. Further more, the dominance of leverage is very high in crypto, therefor these stop loss orders are “leveraged sell orders”. This is the “fuel” that can be used to explain the possibility of a move of this magnitude.
In other words, the orders are already in place in the chart; the adverse of traders decisions via leveraged position stop losses.
2. We can identify (2) main trendlines that explains why Bitcoin has been struggling so much around these zones. Price tends to break above and below these diagonal trendlines, trading sideways in a diagonal fashion - until there is enough “fear” or justification to allow the trendline to play itself out.
The first trendline I design for you in my previous idea. This takes Bitcoin to a zone with several confluences. (1) A Volume Profile support, (2) The bottom of a bearish trendline, and (3) The absorption of a mass amount of liquidity located from the current price to that zone.
The second trendline, which you can apply the same validation methods I pointed out in my previous idea (duplicating the trendline and placing it infinitely at different areas on the chart and observing price respecting the angle), has a bottom of $7,000.
Now this Uber low may seem extraordinarily unrealistic, but there is again, a mass amount of liquidity located in those low zones that the market wants to absorb.
3. I lay out here a corrective wave sequence that would allow all of this liquidity to be absorbed.
The US Dollar on the higher timeframes shows a bearish retest of a major breakdown. With all of the negative news and geopolitical tension with the US, both technically and fundamentally this points in the direction of a falling US dollar relative to other global currencies.
4. Ultimately this is good for Bitcoin.
I present this idea for several reasons, most importantly, what I can see happening (assuming this does occur) is that many holders and investors will sell at very low prices in extreme fear that Bitcoin will go to zero, when in fact it would just be a liquidity grab prior to a true 3-5 year bull run on Bitcoin as the US Dollar loses strength.
Of course being ill prepared and selling at those extreme lows would be catastrophic for investors and traders.
So if anything, I hope this serves you with the possibility explained in detail, and in the event you see this occur, to not panic and not sell. To do the exact opposite of what the majority would do and BUY into those extreme fear zones.
Happy trading and stay safe.
For anyone wanting to argue that it’s not possible or showing their confidence that it would never happen; please understand there is no harm is looking at potential scenarios and this isn’t an ego contest about who is right or wrong. It’s ideally about looking out for each other and sharing our work, knowledge, and experience to collectively succeed in understanding this challenging market.
People may also like to point out that I’ve been speaking about this occurring for roughly a year, and have been wrong - however the timing of such events doesn’t mean it’s “wrong”. If the chart demonstrates a possibility, it remains.

Dead Bitcoin soon will break 92K support (Bye 100K and Hi 80K) As we mentioned a lot major support which is 92K$ is holding price from falling now for 8Th times and each time a support or resistance touch it gets weaker and soon this support will also break to the downside and below 90K$ we are looking for massive dump and fall and start of bear market for at least 2-3 months and this would be correction and rest for market and bitcoin and after that we are looking for rise and next phase pump for the market and maybe targets like 130K$ and more.
So for now we are looking for correction and dump like the red arrows and for confirmation of bear market and dump major support zone should break soon.
DISCLAIMER: ((trade based on your own decision))
<<press like👍 if you enjoy💚

Bitcoin's Balancing Act: Consolidation, Theft, and Market ForcesBitcoin continues to consolidate in the 90k - 106k area! Recently there was an act of theft from the ByBit cold wallet, resulting in over $1.5 billion worth of ETH being stolen. This is definitely a negative backdrop, we have seen good support from other exchanges and crypto project funders. Theoretically, it would be possible to roll the chain back as Arthur Hayes suggested, but it doesn't seem to be possible, although it would definitely play in favor of the bulls. I would expect a drop to the $91800 area for several reasons:
1. Bear dominance. This can be seen in the bullish and bearish volume indicator. Bullish volumes have fallen while strong sales volume growth is noticeable.
2. Elliott Wave Correction
3. BlackRock sold 3,283 BTC before the ByBit hack and has yet to buy more.
4. According to the smart money concept, 92400-91200 is a magnet.
5. Need to liquidate a large number of long positions that gained momentum after leaving the 99k level.
Horban Brothers.
TRUMPUSDT DUMP: CONTINUED 1:10Another 1:10RR dump on TRMPUSDT confirming the continuation of the dump.
- Trading Below VWAP
-Intraday half-Batman
-Sellers on Volume Profile
-POC Resistance
ITS A PUMP AND DUMP!
Targeting 1$ long-term but immediate target is at 14$
-YungEmsi

Tesla Stock Rattled as Insiders Dump Shares. What’s Going On?EV maker’s sales in Europe have made a sharp U-turn this year with some regions selling half the volumes from a year ago. Is Musk’s political ambition causing car buyers to look elsewhere for electric wheels?
Tesla stock TSLA is off to a bumpy start of the year with 10% shaved off its market valuation since the first trading bell of 2025. It’s all likely tied to Elon Musk’s shifting focus from his electric-car giant and into US politics (and, some would say, beyond that and into European affairs).
To make matters worse, key insiders and directors dumped tons of shares this month, cashing out cold hard dollars. Elon Musk’s brother, Kimbal Musk, who’s a Tesla board member, together with two other key figures, Robyn Denholm and chief financial officer Vaibhav Taneja, sold roughly 200,000 shares.
Kimbal Musk offloaded 75,000 shares worth $27.6 million on February 6. Before that, on February 3, Denholm sold 112,390 shares worth more than $43 million. On the same day, Taneja parted ways with 7,000 shares worth $2.8 million.
The share sale is happening at a time when it’s getting increasingly difficult for Tesla to keep its brand equity out of Elon Musk’s public image. In January, Musk was making headline after headline on the politics pages of big media outlets.
His efforts to reshape the White House administration spilled over into interfering with UK politics (where he attacked UK Prime Minister Keir Starmer over his alleged involvement with “mass rapes in exchange for votes” ).
The Tesla CEO also hosted a discussion on X with Germany’s far-right candidate Alice Weidel. It happened about a month before Germany’s federal election on February 23. The live event pulled in roughly 100,000 streamers and sparked a debate over whether it was right to give a free platform to a far-right political party of a foreign country. There’s also Musk’s gesture likened to a Nazi salute he pulled off at Trump’s inauguration — that one really turned heads globally.
Enough politics, let’s dive into the numbers.
Tesla sales were shockingly bad in January. All around Europe, car buyers opted for cheaper Chinese alternatives in a sea of looming competition in the auto industry .
In the UK, sales dipped about 8% from last year’s January. Chinese EV maker BYD BYD saw a massive jump by 550% to 1,614 cars sold. In Germany, sales of Tesla vehicles dropped 60%, while BYD sales rose 69%. France logged a 63% decline in sales of Tesla while Spain saw the steepest drop of 75%. Norway registered a 38% drop in Tesla sales while Tesla’s market in Sweden shrunk 44%. In China, where Tesla commands a towering presence, sales were down 11.5% in the first month of 2025.
Moving outside Europe and across the Atlantic — California marked a decline in Tesla sales to the tune of 11.6%. It was the only carmaker with tumbling sales in the state.
"All of the decrease in the state market last year was attributable to Tesla, which had an 11.6 percent decline," the California New Car Dealers Association said. "Registrations for all other brands increased 1.4 percent."
By the looks of it, Tesla isn’t in a good place fundamentally and shares are down 28% from their record high in December. It’s also coming from a pretty battering fourth quarter where profits plunged 71% while sales barely made it above the flatline with a 2% growth year over year.
Do you believe Tesla’s fortunes are tied to Elon Musk’s ventures into politics? And if you had to choose, are you long or short Tesla? Share your thoughts below!

Bitcoin Wyckoff Distribution 2025Some very concerning facts which I would like to share with you.
This looks like a perfect Wyckoff Distribution to me and I will also post another chart image below with other things to notice!
I can not post the wyckoff image here but go to this link and look for the SChematic #1 and compare for yourself! www.wyckoffanalytics.com
here the other chart:

BTC.D - Doomsday or Expected?Evening fellas,
Remember back then when we would say "only the top 1% will actually make it"
Yeah, what about that? People seem to forget this market is extremely fake, full of shitcoins that will not go anywhere.
Trust me, the bottom for alts is not in. Minimum we go here is 75%.
Once the bitcoin maximalists have acquired enough btc by trading alt/btc pair they will dump everything they got back into only BTC.
Gonna leave this here.
Trade thirsty, my friends.

03/02/25 Weekly outlookLast weeks high: $106,485.24
Last weeks low: $100,995.99
Midpoint: $95,506.74
As the US begins a tariff trade war on the world, BTC ends the previous week with a weekend selloff back into the range low of $91,000. Despite the crypto world being everchanging this range low level has held strong for nearly 3 months now.
Because of this strong support level we have seen many weekly outlooks follow the pattern of an early break below weekly low, then reclaim and rally back up the range throughout the week. Could this be the case once again?
Currently sentiment is terrible, probably bear market levels of depression despite Bitcoin being above $100K most of the time. I think this is largely due to the state of altcoins as they are at pre-US election lows, in some cases bear market levels... This plays havoc mentally which so much was promised in terms of alt season potential now that Bitcoin is a new highs. In reality the market will do what hurts the most, max pain.
Having said that, generally a weekend dump can be misleading due to low volume and the absence
of institutional buying making any manipulated move much easier to pull off from a market makers point of view.
There are some nice 4H TF setups emerging, now the macro environment is definitely calling the shots in the Tradfi world but as long as the $91,000 holds the rangebound move is still in play.

XLMUSDT: Bearish Pressure Rising – Breakdown or Fakeout?
💥 BINANCE:XLMUSDT.P continues its downtrend, struggling under a descending trendline, currently trading around 0.42018 USDT . The price has failed to break above resistance, strengthening the bearish momentum. Will we see a breakdown or a reversal soon?
---
🔑 Key Levels:
Support:
0.41998 USDT — immediate support currently being tested.
0.41651 USDT — a key level where buyers may step in.
0.40268 USDT — if price reaches here, bears are fully in control.
Resistance:
0.44319 USDT — critical level, a breakout here could break the downtrend.
0.44763 USDT — liquidity zone, potential upside target.
0.50000 USDT — longer-term target, requiring strong demand.
---
🚩 Trading Strategy:
Entry Points:
- A short setup if price breaks below 0.41998 USDT with strong volume confirmation.
- A long setup only if price shows a clear reversal above 0.44319 USDT .
Stop-Loss:
- Shorts should have SL above 0.44319 USDT .
- Longs should place SL below 0.41651 USDT to avoid liquidity traps.
Take-Profit Targets:
0.41530 USDT — first target for shorts.
0.40268 USDT — potential bottom where buyers may appear.
0.44763 USDT — in case of a bullish breakout.
---
📈 Technical Analysis:
The downtrend remains intact as long as price stays below the descending trendline.
Low trading volume suggests weak bullish momentum.
A breakdown could accelerate selling as long positions get liquidated.
---
💡 Conclusion:
Price is at a critical zone – if support fails, bears could push it below 0.40 USDT. The big question is: will this be a liquidity grab with a sharp reversal, or will bears keep the pressure on? Let's discuss! 🐻📉

TURBOUSDT: Breakout Incoming or Another Fakeout?
Hey traders! Today we’re watching BINANCE:TURBOUSDT.P The price is consolidating around 0.0084450 USDT , testing a key resistance level. We’re seeing a classic ascending triangle forming — a textbook pattern before a big move. Will we see a breakout, or is this just another fakeout?
---
🔑 Key Levels:
Support:
0.0082000 USDT — a key level where buyers could step in again.
0.0080000 USDT — the last line of defense before a potential drop.
Resistance:
0.0087261 USDT — the first barrier keeping price in check.
0.0087928 USDT — the final line before a potential surge.
---
🚩 Trading Strategy:
Entry Point:
- Long entry on a confirmed breakout above 0.0087261 USDT with volume confirmation.
Stop-Loss:
- Place a stop below 0.0082000 USDT to avoid unnecessary drawdowns.
Take-Profit Targets:
0.0087928 USDT — the first level to lock in some profits.
0.0090000 USDT — a target in case of a strong impulse.
---
📈 Technical Analysis:
An ascending triangle is forming, signaling potential accumulation.
Increasing volume near resistance indicates strong buyer interest.
If the breakout fails, we may see a retest of support before another attempt.
---
💡 Conclusion:
This setup looks promising, but confirmation is key. What do you think? Seeing order book liquidity or potential rejection signs? Let’s discuss in the comments!

My thoughts are giving me no peace with this idea 2 I've updated my expectations regarding the altseason after reviewing the statistics. I believe the growth of altcoins will happen in two phases: first, a drop in Bitcoin dominance to 40%, followed by a recovery to 45-50%, and then a crash below 30%. I'll share any updates if I make any fixes. The scenario is invalidated if dominance rises to 65-70%

NEIROUSDT: Is the Market Ready for a Breakout?
Hello, traders! Today we’re analyzing $NEIROUSDT. The chart is showing an upward trend with key resistance at 0.0008378 USDT . The current price sits at 0.0008189 USDT , and the market appears poised for a move. Will it be a pump, or are we in for a pullback?
---
🔑 Key Levels:
Support:
0.0008100 USDT — a zone where buyers may hold the market steady.
0.0007800 USDT — a backup support level in case of a dip.
Resistance:
0.0008378 USDT — the critical level that must break for continued growth.
0.0008700 USDT — a profit-taking target after the breakout.
---
🚩 Trading Strategy:
Entry Point:
- Consider going long after a confirmed breakout above 0.0008378 USDT with volume confirmation.
Stop-Loss:
- Place your stop below 0.0008100 USDT to minimize risk.
Take-Profit Targets:
0.0008500 USDT — the first target for partial profit-taking.
0.0008700 USDT — the final target for this move.
---
📈 Technical Analysis:
The upward trend signals increasing buyer interest.
Volumes are gradually increasing, confirming bullish intentions.
If the price consolidates above 0.0008378 USDT , it could trigger a significant impulse.
---
💡 Conclusion:
The NEIROUSDT market is at a critical decision point. Will buyers maintain control, or are we heading for a pullback? Share your thoughts in the comments and keep an eye on key levels!

ETHUSDT: Attempting a Recovery After the Dump
Hey, traders! Today, we’re focusing on $ETHUSDT. The price is trying to recover after a sharp dump, currently sitting at 3,345.52 USDT . We see a support level at 3,308.46 USDT , which has held up under pressure, but its retention remains critical.
---
🔑 Key Levels:
Support:
3,308.46 USDT — the key zone where buyers might keep the market steady.
3,302.52 USDT — an additional defense level in case of renewed pressure.
Resistance:
3,360.00 USDT — the nearest target to test the bulls' strength.
3,400.00 USDT — a zone for partial profit-taking if the upward momentum continues.
---
🚩 Trading Strategy:
Entry Point:
- Consider a long position after confirming the support at 3,308.46 USDT and observing a bullish impulse.
Stop-Loss:
- Place your stop below 3,302.52 USDT to minimize risks.
Take-Profit Targets:
3,360.00 USDT — the first profit-taking point.
3,400.00 USDT — the final target for this upward move.
---
📈 Technical Analysis:
The sharp volume dump indicates a liquidity grab attempt.
If bulls can hold the 3,308.46 USDT level, recovery toward resistance is possible.
It’s important to monitor volume and price reaction at key levels.
---
💡 Conclusion:
Ethereum is clearly attempting to recover after a strong dump, but buyers must hold support. Will the market manage to reclaim lost ground? Share your thoughts in the comments!

#BTC #BTCUSD #BTCUSDT #Bitcoin #Analysis #DUMP #MarkDown #Eddy#BTC #BTCUSD #BTCUSDT #Bitcoin #Analysis #DUMP #MarkDown #Eddy
It was my mistake to give a big short analysis of Bitcoin before the distribution structure was formed.
Currently, by combining the analytical styles of Dow Theory & Wyckoff Theory with the combination of the classical price action technical analysis, RTM & ICT, we are witnessing confirmation of the market decline, while the majority have a bullish view of the market, having fallen into the trap of the market maker.
Look for a heavy Bitcoin sell position from the marked premium area, don't forget to get confirmation based on your style and manage risk and capital.
My Bitcoin Big Short Setup Targets :

PNUTUSDT: Approaching a Key Level – Go Short or Wait for a Reteswww.tradingview.com
Hey, traders! 🐂🐻
Today, we’re looking at BINANCE:PNUTUSDT , and the chart looks tense. The price has dropped to 0.61254 USDT , and the bears seem to be gaining momentum. Looking at this diagonal resistance line, one thing is clear: the market is gearing up for a move.
The chart shows a classic downtrend structure, and the key support levels scream potential reversal points. But as they say, "don’t go all in until the setup is confirmed."
---
🔑 Key Levels:
Support:
0.60223 USDT – a critical zone where buyers might try to hold the asset.
0.59000 USDT – the last line of defense before a potential dump.
Resistance:
0.62000 USDT – the nearest level where bears continue to apply pressure.
0.64000 USDT – the next resistance level holding back upward movement.
---
🚩 Strategy:
Entry Point:
- Open a short position after a retest of 0.62000 USDT , provided bears maintain control.
Stop-Loss:
- Place your stop above 0.64000 USDT to avoid sharp moves against your position.
Take-Profit Targets:
0.60223 USDT – the first level to "skim the cream".
0.59000 USDT – the second target if bearish pressure persists.
0.58000 USDT – the final target in case of a full breakdown of support.
---
📈 Technical Breakdown:
The downtrend remains dominant until the price breaks 0.62000 USDT .
Volume confirms bearish activity, especially around resistance levels.
A break below 0.60223 USDT could signal further downside.
---
💡 What’s Next?
Bears seem to be in control, but the market might go for a local retest. What do you think? Wait for a bounce back to resistance or catch the move now? Share your insights – collective wisdom always wins! 🚀

Another possible XRP dumpLooking at the 15 min chart for XRP we have a possible falling wedge meaning it may dump 1 more time.

FTM/USDTBINANCE:FTMUSDT
---
🦾 ** UPCOM:FTM Bearish Trend Retest (HTF)** 🥶
**Unstable price zone** at the moment! ⏳
If we face another big dump for any reason, I'm planning to **spam the buy button** in the support zones around **0.850 - 0.820** and **0.800**! 🛒
As mentioned earlier, in these zones, expect **lots of up and down movements** before we see any major moves! ⚖️
A **breakout above $1.200** resistance is essential for the bulls! 🐂 (H4 View)
---
**Upper Key Resistances:**
🔝 $1.270 - $1.350
---
As I also pointed out in my **Bitcoin analysis**, we are likely at the start of a **bearish correction move** (medium-term). This scenario makes sense to me! ⚠️
The current **short-term upward correction** is probably a **FOMO pump** by small traders trying to test the **50% Fibonacci level** (a previous support zone). 🐟➡️🦈
**Whales** 🚨 and **retail traders** could soon start shorting the market again!
---
Possible scenario for UPCOM:FTM (also applies to many other altcoins):
- **Yesterday:** Bearish breakout 📉
- **Today:** Upward correction to retest the **50% Fibonacci** zone (Bull trap!) 🎣
- **Upcoming days:** Bearish continuation 📉
---
I trust my **instinct**, **experience**, and **analysis**! 🧠💪
We play **level by level**! Bulls definitely need more strength to take control here. ⚡
---
**Reminder:** This is **not financial advice**! 🚫
**Be cautious with long positions in the market**! ⚠️
---
Keep monitoring the levels carefully, and stay safe! 🛑
