Dusk Network Instant 150% · More Possible · Trading ExplainedThis is a complete setup, I shall explain. Trading long-term vs trading short-term and technical analysis.
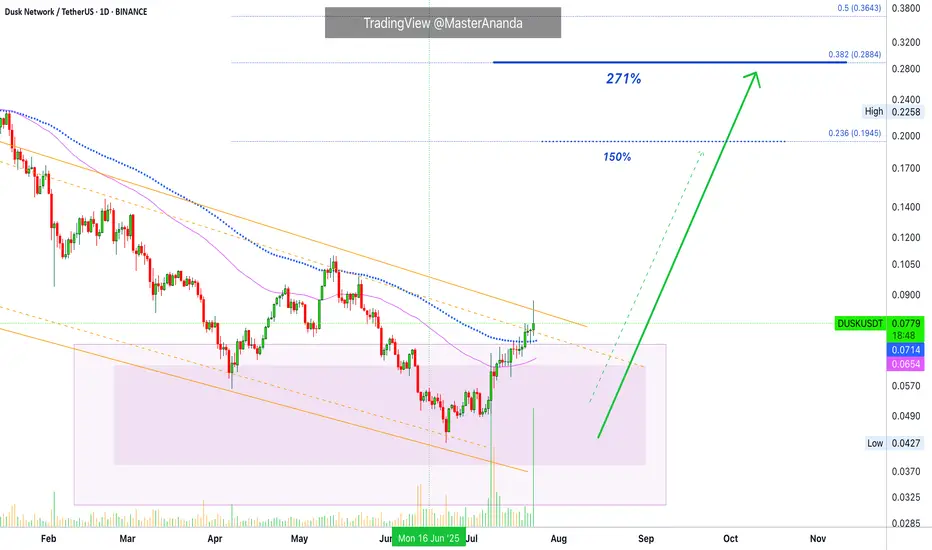
We are looking at Dusk Network (DUSKUSDT) on the daily timeframe. You know how I always look for the bottom and trend reversal for all major pairs for long-term trade-numbers; but, when focusing on the short-term you want a fully confirmed setup rather than the perfect bottom. Why?
The perfect bottom can lead to months and months of consolidation before a bullish breakout. A fully confirmed chart setup leads to instant growth.
Here DUSKUSDT has really high volume above EMA89. Full green candles and pushing higher. Already rising, you can see how the bullish bias is only intensifying. This type of setup can produce the much sought after sudden 100% jump. Once this happens, collect profits and move on.
So, long-term, buy and hold. Keep waiting until the cycle top.
Short-term, get in and get out.
Namaste.
DUSKUSDT
DUSK / USDT : Trend reversal in progressDUSK/USDT - Trend Reversal in Progress
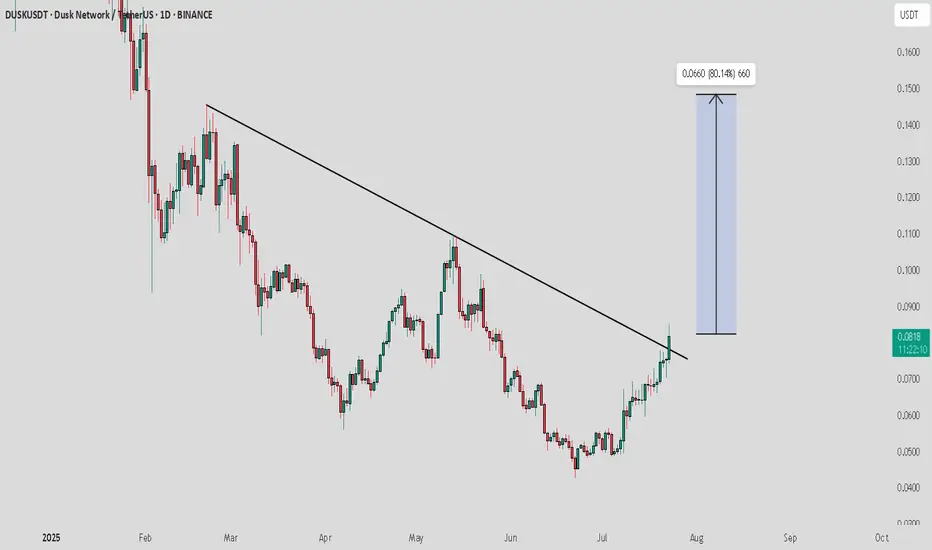
DUSK/USDT has recently broken above a significant downtrend resistance line, signaling a potential trend reversal. With a successful breakout, we’re expecting a strong move towards the $0.0660 target, representing an 80% potential upside from the current price.
Bullish Scenario:
Break above the downtrend resistance confirmed, setting the stage for a significant move toward $0.0660.
A sustained uptrend could lead to further gains in the medium term.
Pro Tip:
Watch for confirmation with increased volume during the breakout. Manage risk by setting stop losses below the breakout level.
DUSK/USDT Poised for Major Breakout – High Probability Reversal🔍 Technical Overview (Timeframe: 1D – Binance):
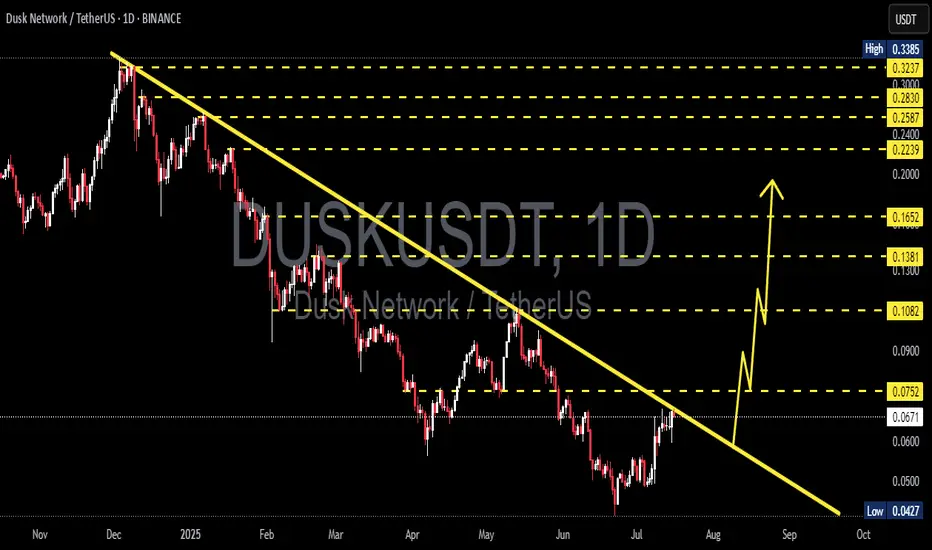
DUSK/USDT is currently displaying one of its most crucial technical setups in recent months. The price is retesting a descending trendline that has capped any significant upside since November 2024.
Now, the market is compressing near this trendline resistance while gradually forming higher lows, indicating a potential pressure build-up for a breakout. This may mark the end of the downtrend and the beginning of a strong bullish reversal if confirmed.
📐 Pattern Structure: Descending Trendline Breakout
This long-term descending resistance has been tested multiple times, gaining validity.
Price is consolidating right below it, while volume shows signs of a slow uptick.
The overall structure resembles a Falling Wedge pattern – often a bullish reversal pattern once the upper boundary breaks.
🟢 Bullish Scenario – Potential 200%+ Rally if Breakout Confirmed
If the price successfully breaks and closes above $0.0752, a significant upward movement may unfold. The potential resistance targets based on historical price reactions and Fibonacci zones are:
Target Resistance Level
TP1 $0.0752 – Breakout Validation
TP2 $0.1082 – Previous Horizontal Resistance
TP3 $0.1381 – Strong Supply Zone
TP4 $0.1652 – Mid-Fib Zone
TP5 $0.2239 – High-Interest Level
TP6 $0.2830 – Extension Target
TP7 $0.3385 – November 2024 High
💡 Extra Catalyst: If BTC stabilizes or enters a consolidation phase, altcoins like DUSK may outperform during a potential mini altseason.
🔴 Bearish Scenario – Rejection at Resistance
If DUSK fails to break the trendline and faces rejection around $0.0672–$0.0752:
The price could retrace back to the minor support zone around $0.0500.
A drop below that would target the macro support at $0.0427, which represents the lowest point of this downtrend.
A close below $0.0427 would likely confirm bearish continuation.
💎 Bullish Setups Backed by Key Technicals:
1. Multi-touch Trendline Resistance – A valid and respected resistance line now at risk of breaking.
2. Sideways Accumulation Structure – Flat price action over several months, likely a sign of re-accumulation.
3. Altcoin Momentum Potential – Market environment increasingly favorable for altcoin rebounds.
4. Gradual Volume Build-up – Suggests quiet buyer interest before a potential surge.
🎯 Trading Strategy:
Buy Entry Confirmation: Daily candle close above $0.0752 with increasing volume.
Stop Loss: Below $0.0620, or more conservatively below $0.0500.
Take Profits: Partial exits at each target zone listed above.
✅ Conclusion:
DUSK is approaching a high-impact technical inflection point. A confirmed breakout of the long-standing descending trendline could open the doors to a multi-leg bullish rally. For swing and position traders, this is a high-probability setup worth close attention. The risk-reward profile is favorable if the breakout is supported by volume.
#DUSKUSDT #CryptoBreakout #AltcoinReversal #TechnicalAnalysis #CryptoTrading #DescendingTrendline #BullishSetup #SwingTradeOpportunity #AltcoinWatch
DUSKUSDT Breaks Out & Flips Trend. Strong Uptrend Ahead!BINANCE:DUSKUSDT has finally broken out of a key resistance zone that had previously kept the price suppressed. After a long period of lower lows and bearish price action, we’re now seeing a confirmed reversal as $DUSK forms higher highs and trades confidently above the 50 EMA on the 4H chart.
This shift in structure from lower lows to higher highs is a clear indication of growing bullish momentum. The breakout has also come with a notable increase in volume, further confirming strength behind the move. Holding above the 50 EMA is a strong sign that the bulls are in control, and we could be in the early stages of a major trend shift.
As long as $DUSK holds above the breakout level and continues respecting key moving averages, we expect a strong uptrend to follow. Short-term pullbacks may offer great entries before the next leg higher
BINANCE:DUSKUSDT Currently trading at $0.067
Buy level : Above $0.064
Stop loss : Below $0.054
Target 1: $0.0735
Target 2: $0.084
Target 3 : $0.11
Max leverage 5x
Always keep stop loss
Follow Our Tradingview Account for More Technical Analysis Updates, | Like, Share and Comment Your thoughts

Dusk Network Major Buy Opportunity, 2020 Bull Market Revisited Today Dusk Network produced the highest buy volume since early February, a pretty good signal. On the weekly timeframe, the action is happening at extreme prices, the "opportunity buy-zone."
DUSKUSDT moved below all support from 2022, 2023 and 2024. The action is happening now at the exact same baseline levels from November 2020, before the last bull market.
» From its Oct. 2020 low (0.0359) DUSK grew 3,171%.
» From its Mar. 2020 low (0.0106) DUSK grew 10,978%.
The current low happened June 2025 at 0.0427. The bearish action preceding this date can be equated to what happened before March 2020. There is always strong bearish action preceding a major bull market.
The last bull market lasted 658 days, from bottom to top. From March 2020 until late December 2021. It is hard how to say how long the next bull market will last but a similar duration would lead to April 2027 being a major date.
A bull market can happen within 6 months, just as it can take years for the entire process to unravel. Since market conditions are so different now with all the innovation, adoption and expansion, we will have to wait and see.
The fact that we have the lowest prices in almost 5 years is also an interesting fact. All weak hands have been removed and this opens up maximum growth potential in the coming years.
I think we will have an extended bull market because it is already July 2025 and we have only very early signals, which means that it will take at least 4-8 weeks before full marketwide bullish action becomes the norm, August-September 2025. Activating 2026 minimum for new cycle tops.
Conclusion
Dusk Network is trading at bottom prices, a great opportunity to accumulate; buy and hold. The future is bright for this coin.
Namaste.

DUSK ShortLike & Follow me for more details
DUSK Short,
BTC will break upward trend soon.
Will reach 103k

DUSKUSDT | Buyers Are Stepping In, But Not There YetI’ve had my eye on DUSKUSDT and this is the first serious resistance it’s facing. Buyers are becoming active , and that’s a good sign, but it’s not enough yet .
We need to see more strength, ideally a clean breakout above the red zone followed by a retest , before considering any long setups.
“I will not insist on my short idea. If the levels suddenly break upwards and do not give a downward break in the low time frame, I will not evaluate it. If they break upwards with volume and give a retest, I will look long.”
Most traders react to the first signs. I wait for confirmation. That’s the difference.
📌I keep my charts clean and simple because I believe clarity leads to better decisions.
📌My approach is built on years of experience and a solid track record. I don’t claim to know it all but I’m confident in my ability to spot high-probability setups.
📌If you would like to learn how to use the heatmap, cumulative volume delta and volume footprint techniques that I use below to determine very accurate demand regions, you can send me a private message. I help anyone who wants it completely free of charge.
🔑I have a long list of my proven technique below:
🎯 ZENUSDT.P: Patience & Profitability | %230 Reaction from the Sniper Entry
🐶 DOGEUSDT.P: Next Move
🎨 RENDERUSDT.P: Opportunity of the Month
💎 ETHUSDT.P: Where to Retrace
🟢 BNBUSDT.P: Potential Surge
📊 BTC Dominance: Reaction Zone
🌊 WAVESUSDT.P: Demand Zone Potential
🟣 UNIUSDT.P: Long-Term Trade
🔵 XRPUSDT.P: Entry Zones
🔗 LINKUSDT.P: Follow The River
📈 BTCUSDT.P: Two Key Demand Zones
🟩 POLUSDT: Bullish Momentum
🌟 PENDLEUSDT.P: Where Opportunity Meets Precision
🔥 BTCUSDT.P: Liquidation of Highly Leveraged Longs
🌊 SOLUSDT.P: SOL's Dip - Your Opportunity
🐸 1000PEPEUSDT.P: Prime Bounce Zone Unlocked
🚀 ETHUSDT.P: Set to Explode - Don't Miss This Game Changer
🤖 IQUSDT: Smart Plan
⚡️ PONDUSDT: A Trade Not Taken Is Better Than a Losing One
💼 STMXUSDT: 2 Buying Areas
🐢 TURBOUSDT: Buy Zones and Buyer Presence
🌍 ICPUSDT.P: Massive Upside Potential | Check the Trade Update For Seeing Results
🟠 IDEXUSDT: Spot Buy Area | %26 Profit if You Trade with MSB
📌 USUALUSDT: Buyers Are Active + %70 Profit in Total
🌟 FORTHUSDT: Sniper Entry +%26 Reaction
🐳 QKCUSDT: Sniper Entry +%57 Reaction
📊 BTC.D: Retest of Key Area Highly Likely
📊 XNOUSDT %80 Reaction with a Simple Blue Box!
📊 BELUSDT Amazing %120 Reaction!
📊 Simple Red Box, Extraordinary Results
I stopped adding to the list because it's kinda tiring to add 5-10 charts in every move but you can check my profile and see that it goes on..

DUSKUSDTThis is a long-term analysis for the weekly time frame. Our guess is that the price will return from around 0.012 to 0.015 and even higher (completion of wave 4) and then complete its wave 5 at around 0.053 to 0.041.
If this happens, buying it spot is quite low-risk and we can even look at it for a long-term hold and an investment under one condition.
If this Elliott analysis is correct, the price could reclaim its new high within two years or more and even see numbers beyond it.
In terms of timing, late July and early August are a good time for the end of wave 4 and late 2025 and early 2026 are ideal times for the end of the hypothetical wave 5.

#DUSK/USDT#DUSK
The price is moving within a descending channel on the 1-hour frame, adhering well to it, and is heading for a strong breakout and retest.
We are seeing a bounce from the lower boundary of the descending channel, which is support at 0.0926.
We have a downtrend on the RSI indicator that is about to break and retest, supporting the upward trend.
We are looking for stability above the 100 moving average.
Entry price: 0.1023
First target: 0.0989
Second target: 0.0933
Third target: 0.0910

DUSKUSDT 1W Analysis DUSK ~ 1W Analysis
#DUSK Buy gradually from here if you still have confidence in this coin with a short term target of at least 20%+

DUSK ANALYSIS (1W)It seems that after forming the 3D structure, the price has entered a corrective ABC pattern or a more complex one.
It appears that wave B has now ended, and the price has entered wave C.
Wave C has a long correction ahead in terms of time, and in terms of price, the best area for the end of wave C is the green zone.
Let’s wait and see what happens.
For risk management, please don't forget stop loss and capital management
When we reach the first target, save some profit and then change the stop to entry
Comment if you have any questions
Thank You

#DUSK (SPOT) IN ( 0.1600- 0.2100) T.(0.7400) SL(0.1527)BINANCE:DUSKUSDT
#DUSK/ USDT
Entry( 0.1600- 0.2100)
SL 1D close below 0.1527
T1 0.3000
T2 0.4100
T3 0.5400
T4 0.7400
1 Extra Targets(optional) in chart, if you like to continue in the trade with making stoploss very high.
______________________________________________________________
Golden Advices.
********************
* collect the coin slowly in the entry range.
* Please calculate your losses before the entry.
* Do not enter any trade you find it not suitable for you.
* No FOMO - No Rush , it is a long journey.
Useful Tags.
****************
My total posts
www.tradingview.com
**********************************************************************************************
#Manta #OMNI #DYM #AI #IO #XAI #ACE #NFP #RAD #WLD #ORDI #BLUR #SUI #VOXEL #AEVO #VITE #APE #RDNT #FLUX #NMR #VANRY #TRB #HBAR #DGB #XEC #ERN #ALT #IO #ACA #HIVE #ASTR #ARDR #PIXEL #LTO #AERGO #SCRT #ATA #HOOK #FLOW #KSM #HFT #MINA #DATA #SC #JOE #RDNT #IQ #CFX #BICO #CTSI #KMD #FXS #DEGO #FORTH #AST #PORTAL #CYBER #RIF #ENJ #ZIL #APT #GALA #STEEM #ONE #LINK #NTRN #COTI #RENDER #ICX #IMX #ALICE #PYR #PORTAL #GRT #GMT #IDEX #NEAR #ICP #ETH #QTUM #VET #QNT #API3 #BURGER #MOVR #SKL #BAND #ETHFI #SAND #IOTX #T #GTC #PDA #GMX #REZ #DUSK #BNX #SPELL #POWR #JOE #TIA #TFUEL #HOT #AVAX #WAXP #OGN #AXS #GALA #ONE #SYS #SCRT #DGB #LIT #QI #FIL #GLMR #ATOM #LTC #MANA #ONT #TLM #SLP #ROSE #NEO #EGLD

DUSK/USDT NEW increase volumeDUSK/USDT NEW increase volume
Depending on the study trend there is a high chance this coin is going to see the new volume

Unlocking DUSKUSDT: The Data That Tells the Real Story - Dusk...◳◱ On the BINANCE:DUSKUSDT chart, the Trendline Touch pattern suggests an upcoming trend shift. Traders might observe resistance around 0.3231 | 0.3765 | 0.4805 and support near 0.2191 | 0.1685 | 0.0645. Entering trades at 0.198 could be strategic, aiming for the next resistance level.
◰◲ General Information :
▣ Name: Dusk Network
▣ Rank: 539
▣ Exchanges: Binance, Kucoin, Huobipro, Gateio, Mexc, Hitbtc
▣ Category / Sector: Infrastructure - Smart Contract Platforms
▣ Overview: Dusk Network is a blockchain protocol designed to support the development and deployment of security tokens.
◰◲ Technical Metrics :
▣ Current Price: 0.198 ₮
▣ 24H Volume: 2,315,408.090 ₮
▣ 24H Change: -2.511%
▣ Weekly Change: -25.51%%
▣ Monthly Change: 5.26%%
▣ Quarterly Change: -10.18%%
◲◰ Pivot Points :
▣ Resistance Level: 0.3231 | 0.3765 | 0.4805
▣ Support Level: 0.2191 | 0.1685 | 0.0645
◱◳ Indicator Recommendations :
▣ Oscillators: NEUTRAL
▣ Moving Averages: STRONG_SELL
◰◲ Summary of Technical Indicators : SELL
◲◰ Sharpe Ratios :
▣ Last 30 Days: 1.92
▣ Last 90 Days: 0.01
▣ Last Year: 0.68
▣ Last 3 Years: 0.24
◲◰ Volatility Analysis :
▣ Last 30 Days: 1.30
▣ Last 90 Days: 1.09
▣ Last Year: 1.15
▣ Last 3 Years: 1.18
◳◰ Market Sentiment :
▣ News Sentiment: N/A
▣ Twitter Sentiment: N/A
▣ Reddit Sentiment: N/A
▣ In-depth BINANCE:DUSKUSDT analysis available at TradingView TA Page
▣ Your thoughts matter! What do you think of this analysis? Share your insights in the comments below. Your like, follow, and support are greatly valued and help sustain high-quality content.
◲ Disclaimer : Disclaimer
The content provided is for informational purposes only and does not constitute financial, investment, or trading advice. Always conduct your own research and consult a qualified professional before making any financial decisions. Use of the information is solely at your own risk.
▣ Explore the Power of Charting with TradingView
Unlock a wide range of financial analysis tools, data, and features to elevate your trading experience. Take a tour and see the possibilities. If you decide to upgrade your plan, you can receive up to $30 back. Discover more here - affiliate link -

#DUSK (SPOT) IN (.295- .320) T. (.630) SL(.290)BINANCE:DUSKUSDT
#DUSK / USDT
Entry (.295- .320)
SL 4H close below .290
T1 .36
T2 .39
T3 .42
T4 .48
T5 .57
T5 .63
______________________________________________________________
Golden Advices.
********************
* collect the coin slowly in the entry range.
* Please calculate your losses before the entry.
* Do not enter any trade you find it not suitable for you.
* No FOMO - No Rush , it is a long journey.
Useful Tags.
****************
My total posts
www.tradingview.com
1Million Journey
www.tradingview.com
www.tradingview.com
**********************************************************************************************
#Manta #OMNI #DYM #AI #IO #XAI #ACE #NFP #RAD #WLD #ORDI #BLUR #SUI #VOXEL #AEVO #VITE #APE #RDNT #FLUX #NMR #VANRY #TRB #HBAR #DGB #XEC #ERN #ALT #IO #ACA #HIVE #ASTR #ARDR #PIXEL #LTO #AERGO #SCRT #ATA #HOOK #FLOW #KSM #HFT #MINA #DATA #SC #JOE #RDNT #IQ #CFX #BICO #CTSI #KMD #FXS #DEGO #FORTH #AST #PORTAL #CYBER #RIF #ENJ #ZIL #APT #GALA #STEEM #ONE #LINK #NTRN #COTI #RENDER #ICX #IMX #ALICE #PYR #PORTAL #GRT #GMT #IDEX #NEAR #ICP #ETH #QTUM #VET #QNT #API3 #BURGER #MOVR #SKL #BAND #ETHFI #SAND #IOTX #T #GTC #PDA #GMX #REZ #DUSK

Alikze »» DUSK | Bullish Wave 3 or C Scenario - 1W🔍 Technical analysis: Scenario of wave 3 or C in the ascending channel
📣 BINANCE:DUSKUSDT is moving in an ascending channel on the weekly time frame.
🟢 In the previous rally, it stopped at the supply range of 55 cents and a corrective cycle was formed to the origin of the movement of 14 cents.
🟢 Currently, it is facing demand, considering the first movement wave and the correction to the origin of the previous movement.
💎 This movement wave is the third wave, which is located in the microwaves 3 of the first 3 waves, considering the current momentum.
💎 Therefore, in the first step: this movement cycle will have the ability to grow to the first supply zone.
⚠️ In addition, if the price correction enters the range of this validation level, the bullish scenario will be invalidated and must be re-examined and updated.⚠️
»»»«««»»»«««»»»«««
Please support this idea 💡 with a LIKE 👍 and COMMENT 💬 if you find it useful and Click "Follow" on our profile if you'd like these trade ideas delivered straight to your email 📧 in the future.
Thanks for your continued support.🙏
Best Regards,❤️
Alikze.
»»»«««»»»«««»»»«««

DUSK buy setup (1D)The price structure in hourly time frames is bearish.
There are good liquidity pools at the bottom of the chart.
The pullback in substructure is expected to complete and sweep liquidity pools.
The green range is where we expect a rebuy.
Closing a daily candle below the invalidation level will violate this analysis
invalidation level : 0.1018
For risk management, please don't forget stop loss and capital management
Comment if you have any questions
Thank You

Dusk Possible LongTimeframe 4 Hour.
High RR Long if Dusk holds here for a while and rejects.
Entering long from here under 0.19700
Invalidation Clean breaking below current level.
If holds expecting a good move from here.
Note: Not a Financial Advise.

Premium Long Trade Setup: DUSKUSDTToday, I’m excited to share our premium long trade setup for DUSKUSDT. Let’s start by focusing on the critical $1.45 support level, where we observed a clean rejection of the 161.8% Fibonacci support. This rejection is a strong positive signal, indicating a potential trend reversal for DUSK.
Currently, we see the completion of a 5-wave move to the upside, which confirms that this rally is not merely an ABC correction. With the 5-wave structure complete, it’s logical to anticipate an ABC correction to the downside.
We’ve strategically placed our buy limit order at $0.2211, offering a robust 1:3 risk-reward opportunity. Additionally, we’ve set three upside targets. Upon reaching the first target, we plan to secure 50% of the profit and simultaneously eliminate the trade’s risk. This approach allows us to manage the trade with confidence, knowing that we’re in a strong position for potential gains.
Let’s monitor this setup together and enjoy the process. Happy trading!

DUSKUSDT.1DThe daily chart for DUSK/USDT (Dusk Network paired with US Dollar Tether) presents several crucial technical aspects, which I'll analyze in detail:
Trend Analysis
The overall trend has been bearish, with DUSK/USDT experiencing a significant downward trajectory since June. However, recent price action suggests a potential reversal as the price has risen above the descending trendline S1, indicating a possible shift in momentum.
Support and Resistance Levels
R1 ($0.2053): This level represents immediate resistance. It has recently been approached, indicating a potential struggle or breakout point.
R2 ($0.2459): This is the next significant resistance level. A break above R1 could lead to a test of R2, which aligns with earlier price points that acted as resistance in May and June.
S1 ($0.1673): Currently acts as support after the price moved above it. It's crucial to monitor if the price retraces, as a fall below could signal a continuation of the bearish trend.
Technical Indicators
MACD: The Moving Average Convergence Divergence shows a bullish crossover, with the histogram indicating growing bullish momentum. This is a positive sign that supports the potential for further upward movement.
RSI: The Relative Strength Index is around 40.63, suggesting that there is still room for upward movement before the asset becomes overbought.
Current Market Position
The current price of DUSK/USDT is $0.2029, just below the R1 resistance level. This positioning is crucial as it tests the resolve of the recent bullish push.
Trading Strategy
Given the break above the trendline S1 and the bullish signals from the MACD and RSI, my current strategy would be cautiously optimistic. I would consider entering a long position if there's a daily close above R1, targeting R2 while keeping a tight stop-loss just below the S1 support level to manage risks.
Conclusion
In conclusion, DUSK/USDT shows signs of a potential reversal from its previous bearish trend. Monitoring how it behaves near the R1 level will be key to confirming if the bullish sentiment has enough strength. This setup warrants a dynamic trading strategy that can adapt to changes as they occur, especially if new highs are made or if the price fails to sustain above S1.

Trade Setup: DUSK Long PositionMarket Context:
$DUSK is potentially forming a double bottom in a high-conviction zone, suggesting a possible bounce. A break above $0.20, followed by a retrace to support, could signal a continuation of bullish momentum.
Trade Setup:
Entry: Around $0.19 - $0.20.
Take Profit:
First target: $0.283
Second target: $0.35
Third target: $0.4083
Stop Loss: Daily close below $0.16.
📊 Look for confirmation of a higher high and reclaim of support for bullish momentum. #DUSK #CryptoTrading #TechnicalAnalysis 🎯

DUSK ANALYSISBelow the price is the liquidity pool. The pool is expected to be swept soon.
We have a bearish CH on the chart, which indicates an internal pullback.
It is expected that we will move from the supply side to the demand side.
Closing a daily candle above the invalidtion level will violate the analysis
Note that the financial market is risky, so:
Do not enter any position without confirmation and trigger.
Do not enter a position without setting a stop.
Do not enter a position without capital management.
When we reach the first TP, save some profit and try to move the stop continuously in the direction of your profit.
If you have any comments please post them, comments will help us improve our performance
Thanks

Dusk ShortDusk after testing near support line break the support. Once it start dumping we will see the dusk near 0.18 in near future.
