DUST

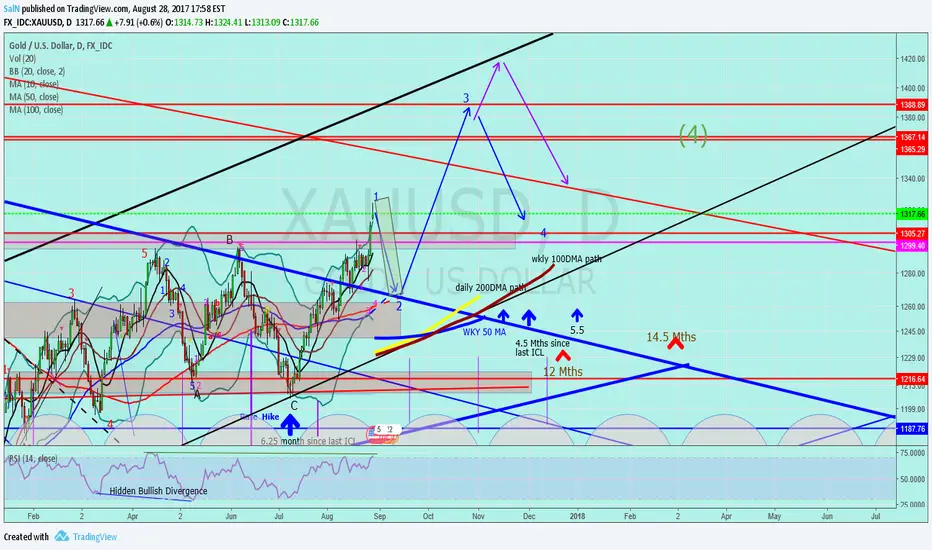
Jnug to Gold "A little more of a drop before the bounce"For the Gold chart, I am anticipating a little more of a drop to test the blue trend long term blue downtrend line. It appears to m that we have been making a series of three wave patterns since early 2016. We may very well still be in a triangle pattern. The pink line with a pink arrow at the top of the page marks the top of both 2016 and 2017. The blue uptrend line with a blue arrow marks the long term uptrend line from the December 2015 low. If I am correct then we should be in the middle of three waves down to possibly drop back into that earlier wedge. The black uptrend line with black arrow marks this years trend line and should be broken for the end of year yearly cycle low. The FIB measurement is an approximation for the top of the bounce for this three waves (1300ish) and as you can see the 100% move down would be the uptrend line. In the longer term view this still looks like we are in this triangle and in the D wave of an ABCDE. Lets see how this plays out over the next couple weeks. I think we will get the RSI to touch the oversold level.
For Jnug, maybe we will be getting something like this in the coming weeks. GL


DUST 9-26-17 PredictionPullback was Hit!
Support didn't Hold, but still above 90 EMA.
Now outside Channel...
Possible Bounce Back up to Breakdown of 24.50 ?

DUST 9-25-17 Prediction: Still Bullish?Pullback was Hit!
Still above 30 & 90 EMA's. Forming a short term
Descending Wedge - looks Bullish to me
But outside Channel now... Caution!
Might require more Pullback to $24 area, but will support hold?

DUST 9-21-17 Prediction after yesterday's crazy actionWow, yesterday's BIG up move was out of nowhere@! Up 2 points or so in 30 mins.
DUST is back! and in the Up Channel again.
I think a slight Pullback is due, getting way to far from 30 & 90 EMA's.

Jnug to Gold "FOMC meeting helps the DCL"Well, it has been a long very stretched out daily cycle. And it is clear now that we are dropping into the DC low. I have drawn on my chart my approximate price target for Jnug before a bounce. I think we will hit the 100 DMA. But I am using the GDXJ chart to help me a little more. Here is the GDXJ chart zoomed out a bit
And here it is zoomed in a bit.
As you can see we made a big gap today. So with that said, here are my thoughts. We may bottom from this DCL tomorrow or Wednesday. I do not think that we will get that rate hike on Wed and that should create a short lived pop in both Gold and miners. (If you are wondering what happened to Jnug when they hike rate last time, just look back at June 14th and you can see that we dropped 35% in one day). So I am expecting a pop but not 35%. As you can see from the GDXJ chart, we have the 50 DMA and the weekly 100 MA overlapping. I do not think we will bust through that level unless we were to have a surprise rate hike. So when I see GDXJ hit that level and fill that gap at $34, I will sell my JDST and buy Jnug. I am taking a chance to rebuy Jnug but I feel comfortable enough to do it especially with that gap above. I should have listened to my own advice when I said I thought we bottomed for that last DCL. I should have sold my JDST and bought Jnug. Oh well. Live and learn.
Another thing to keep in mind is that we are not making a right translated high for the year in miners. That is significant because a left translated high is bearish for the remainder of the year. That is ...unless you think that we are somehow going to have a huge unprecedented bullish move upward this late in the yearly cycle. The last missile launch from North Korea was ignored by the markets. The markets no longer fear that Kim is going to blow anything up. Trump is mostly ignoring him and is even mocking Kim by calling him "rocket man". And so gold dropped more. This is a very difficult gold market to say the least. We are essentially sideways which is the worst type of market to try to time the dips and peaks...as we just found out this last cycle. So I can only do the best I can for the time being until something either more bullish or bearish trends. This cycle is stretched so I adjusted my cycles below to match this DCL. Assuming this holds for the remainder of the year, I drew my arrows as I see it at this point, with the yearly cycle low due in late December to early February. I also forgot to mention that we have a bullish divergence on the RSI 14. SO a pop is in order.
Lastly, if there is no rate hike on Wed, then everyone is going to feel certain that there will be a hike in December. And just like before, gold will fall until that meeting. That and the pressure of the yearly cycle low being due. These two forces combined are just too powerful.
If you have any other ideas, feel free to post them as I do not claim to have all the answers.

DUST 09-19-17 predictionWow exceeded Friday's prediction of $23.60, almost hit $24.
Looks like DUST needs a Pullback... let's see if it goes back down to new target area.
I like it when I guess correctly :)

DUST - 9-15-17 Pullback PredicationI think the downtrend resumes based on the Triple Top, it couldn't close above 22.50. If so, I could see it moving down to 21.30 or as low as 21.00 area.

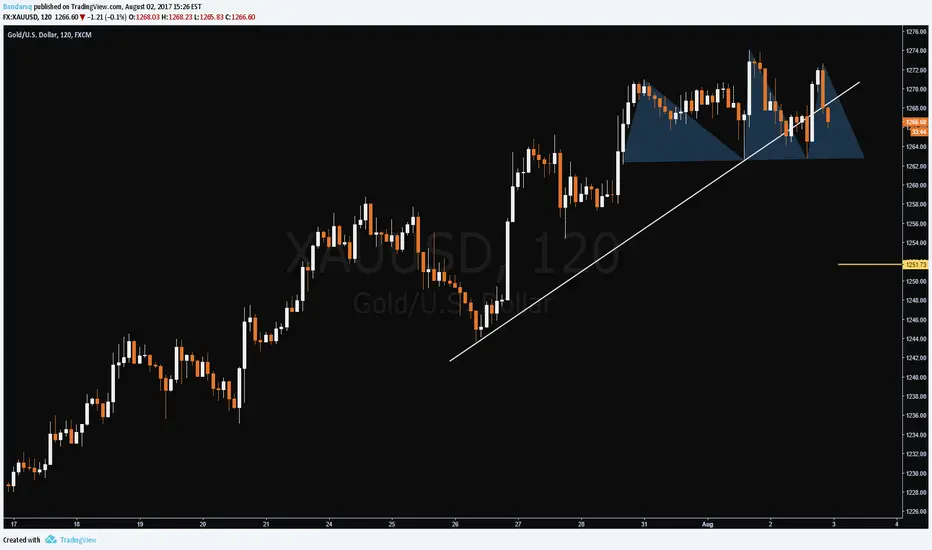
False breakout? Or just a back test to old channel?Watching possible breakout here near 1315. Overshoot? False or are we testing the breakout to see higher highs?
Keeping this in mind too:

Jnug to Gold "can't ignore the breakout any longer"Today was a big deal to me. North Korea just fired a missile over Japan causing gold to spike and that is good enough for me for this breakout. So the question for those that are in JDST or Dust is how to get out. We will have a daily cycle low very soon. I expect gold to drop back down to the 1270ish area and retest that long term trend line for the end of the daily cycle. I am still estimating that to occur around September 5th or maybe a little bit after that. At that point, wherever you are , you should sell your short and buy Jnug. So even though you are down right now, we can still recover much of these losses. This breakout and next bullish push up should propel Jnug up very quickly. You will make up those losses very quickly and then some. If this is in fact the bull market for gold, then understand that there are at least 3 -4 more years of climbing to do with gold. And Jnug will climb much faster and higher than gold. Towards then end of this bull cycle, Jnug will push up much faster than it did in the 2016 run. So we will have to lick our wounds a bit and buy the dip.
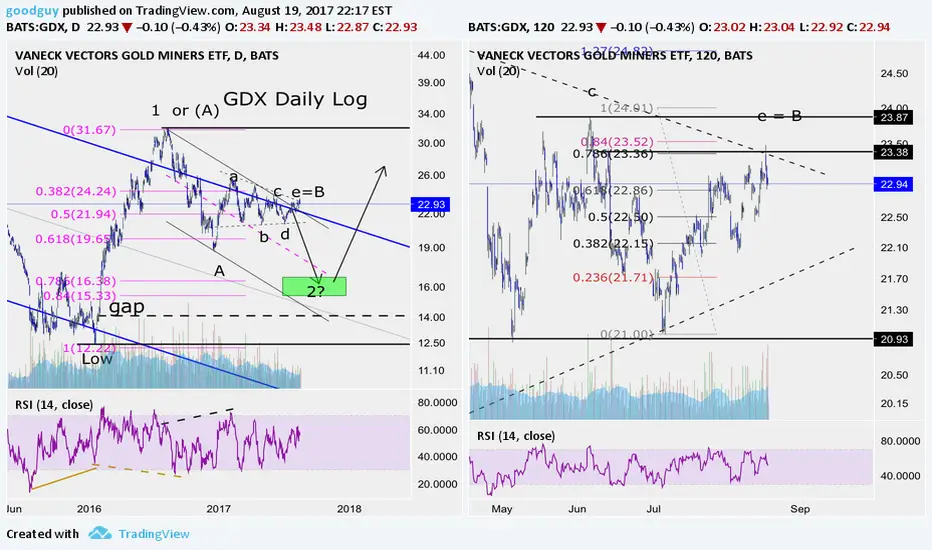
GDX: Gold miners. Time to finally drop? I think so Although I am longer term bullish I am intermediate term bearish and short. I think the sideways triangle is very likely complete with wave "e" going to .78 of wave"c" then reversing intraday for a bearish engulfment candle for the day Would not be be surprised to see it open lower Monday then bounce to retest Friday's high but fail. If price goes above "c" then I'm wrong. Hope this will be helpful.
NUGT long ideaNUGT and the mining sector GDX, could be a buy here. The sector first started moving higher last week, now a pullback to support at the SMA. Also looks like a copy of the previous run higher (see the gold candles). Im buying some here, I will sell if tomorrow is a down day. NUGT is 3X so you have to protect your cash.

Jnug to Gold "This is going down"GOLD ! That was a huge let down bearish reversal candlestick on Friday with huge bearish volume. This is not breaking out this time. These banksters are wicked evil when it comes to setting everyone up to go long. But I did not fall for it. I believed in my cycles and we are just too late for a breakout rally like everyone is talking about. We will drop until around September 4th - 7th. And I do not expect it to drop below the 1230ish range before a bounce. In my opinion September is its last chance for that breakout above the 1305 range for this year. If it fails again then it will indeed drop hard into the end of the year at the least. If you zoom out you would see that the yearly cycle low is fast approaching and if gold does not make a higher high than the 2016 top then that would suggest that we are back into some sort of bearish trend. You know...lower highs. Like I said.....be cautious here folks. Patience is not such a bad thing here. You could always play this drop and then short term bounce and then wait and see what happens. But your trading is up to you not me. So GL.
Jnug is also going down. I think its in a channel. So if it stays in the channel for this drop then I show the yellow ovals for my first price target around the end of the first week of September. If it breaks through that then Jnug could reach the $12.45 range. I am not sure how well this will bounce though. IT would have to get through that downtrend line and red resistance zone before heading back up to the $18 range. We will see. That's all folks. Short and sweet.

Gold Daily GartleyAll is on chart. Might not reach this level (D) if the major down trend holds. If it breaks, look for D or might be small pullback before larger bull or false break out and we see and down turn.

Daily Gold - expecting a tmep pullback before higherAll is on chart. Will post hourly charts during the week.

Jnug to Gold "More chop ahead before a bigger drop"Before I get into it, I just wanted to say, isn't is funny how this dumped? Remember how I was saying that big green volume spikes have usually meant that Jnug was at or very near a top. Its not 100% that way but its like 95% of the time. Good thing to remember.
So I have been really trying to find the cycles for Jnug. And I am bummed to say that I did not find it in time for the last bottom last month at just under $15. I wish I had made the adjustment. Oh well. I did not sell and have not lost money. So if my cycles are about right, then I think we are almost finished with the cycle for Jnug. I really do not feel that we are going to get too much more of a drop before a short term pop and then deeper drop. Maybe a couple more days down. The reason it partly to do with gold. This is only going to be a half cycle downturn for gold and that does not last long. So I have thought that Jnug may very likely follow the blue arrows. If we are lucky then we drop and follow the red arrow. There are a lot of potential channels that we could be trading in and it is hard to figure out which one we are in. But since I am expecting gold to make another try at a breakout, and fail, then I am expecting Jnug to also pop a little. Speaking of gold trying to breakout again. Gold is really running out of time for this Daily cycle to breakout. If it does not do it in the next week or two then it will probably drop pretty hard. So as far as gold, I cant see this half cycle low reaching past the 1240 mark, which is also where the 50 week MA is. Then I am expecting that pop. BUT, if it fails to breakout and if we drop to the bottom of that wedge, then that would indeed be a lower low, and I would be willing to bet that gold tanks hard. We have a double head and shoulders pattern that could play out. And if that plays out then I would expect the much larger head and shoulders to almost certainly play out. See the gold chart below
I also cant get out of my head the fact that the 50 week MA is so so so close to crossing below the 200 weekly MA. Yep, that would do it. It seems like this next two weeks or so is going to tell us the future for gold. Let us also not forget that there is another Fed meeting on September 20th and with the NFP and Unemployment doing so well, I can see that meeting starting to weigh on gold in a few weeks. I do not expect the Fed to raise rates in September and so I think we will get the same reaction out of gold that we just got. A short term rally for a few days and then a drop. If in mid to late September, price is where my arrows are, then there is yet another super strong force that will start pulling gold down and that is the intermediate cycle wanting to make its low. I believe that after two long 6.25 months Intermediate cycles, I do not think that we are going to get a 3rd long one. I am expecting this one to be on the short side with a maximum duration of 5.5 months. I am kind of leaning more towards the 5.5 months. The reason is that 5.5 months would mark 12 months since the last yearly cycle low. (Yearly cycles run 12 - 14.5 months). So we either get a very short 4 month long ICL so that we can have another short ICL to hit the 14.5 month YCL. Or more likely IMO, we have a 5.5 month ICL and that would line up perfectly for another 12 month YCL. Just to give you an idea, ICL drops should have gold dropping for 3 - 5 weeks straight. So gold should roll over in November.
So now you can see the urgency for gold to breakout, if its going to do it. Otherwise, this ship is going to sink and take Jnug with it. And my silver chart is not helping convince me that we are in a bull market yet either since silver and gold a somewhat moving in the same direction. Gold Volitility is at an all time low. In other words, when this breaks, don't be on the wrong side of it. I hope I did not forget anything. I will update if I remember. GL.

DUST long ideaFairly obvious the US Dollar DXY is rallying here. Will probably last a week or so. Im taking a starter position in DUST as a hedge against my NAK position.


Jnug to Gold "Breakout or Breakdown?"This is a important week and especially Fridays economic reports. I can see a case for both Bullish and Bearish gold. Being so close to that trend line again, it would seem safe to wait before making any bets. But I am still leaning bearish. One of the reasons is because of technical, but an even bigger reason is that the dollar has been dropping hard for the last several months and gold has essentially been trading sideways. With the dollar at very over sold levels right now and at strong support, I don't think it is going to drop through yet. As a matter of fact, there is a huge bullish divergence on the weekly chart for the dollar from its May 2016 low to today. see the dollar chart
Nothing is guaranteed but that is significant. If the dollar bounces, it seems likely that gold will react quite a bit in a negative manner. Another factor is that golds volatility index is at its lowest since the 2011 gold top and much lower than the 2013 gold top. I am wondering if that means that a drop in gold like 2011 - 2012 or 2013 is on the table. And then there are the miners. These stocks have been trading with lower highs and not showing a lot of strength with the gold rallies. If you look at the Jnug chart, you can see that we had a little volume spike on July 26th. Looking back, when Jnug has had large green volume spikes, it has usually meant that we were at or near a top before a large drop. That does not mean that it will stay consistent, but is worth noting. Volume has been dropping off which means a big move is coming. And with the close of the DOW above 22,000 today, I am wondering if money might finally start flowing out of gold and into equities. Hard to tell at this point. But we are due for at least a half cycle drop in gold. And Jnug seems ready for the same thing.
On the opposite side of the argument, gold is so close to the trend line, any significant bad news or bad economic data could be the trigger for the gold breakout. So stay alert because if you are short like me and this thing takes off, then we may have to take a loss. I hope not but we shall see. GL

Platinum about to lift off? These two markets look interesting together because of the similar price action. Notice how rice was in a descending triangle followed by a breakout. These are typically bearish patterns, but not always, clearly. I believe platinum is in the same consolidation phase before it breaks out. Notice it took rice approximately two years to break out from its established support. Platinum seems like it's on the verge of doing the same. I've seen some traders present shorting opportunities in platinum. I think that's a big mistake.
Other than that, what does platinum have to do with rice? I'd say nothing. There is no inverse or positive correlation whatsoever. Perhaps there is something more between the two, but that is not the point of the analysis.

Gold Channels and EWAll is on chart. Are we finishing 5th wave? Watch for channel break out for direction change.
