The Market Matrix - DXY, Gold, NAS & Crude for Feb 7 2025This weeks edition of The Market Matrix. Covering Gold, DXY, Nasdaq & Crude Oil.
Dx1

DXY: rebounding at the bottom of the Megaphone.The U.S. Dollar Index is neutral on its 1D technical outlook (RSI = 48.335, MACD = 0.03, ADX = 16.853) as it took a turnaround on the HL trendline of the 2 month Bullish Megaphone. The 4H MACD will form a Bullish Cross today and once the 4H MA50 breaks, we will have the buy trigger for the new bullish wave. We expect this to test at least the LH trendline (if not the R1 Zone), which is where January's wave peaked, marginally over the 0.786 Fibonacci. Go long (TP = 109.500).
## If you like our free content follow our profile to get more daily ideas. ##
## Comments and likes are greatly appreciated. ##

The Market Matrix - Gold, Crude, DXY & Nasdaq for Feb 1 2025This weeks edition of The Market Matrix.
Disclaimer
The information provided in this content is for educational and informational purposes only and should not be construed as financial advice, investment recommendations, or an offer to buy or sell any securities or financial instruments.
Trading financial markets involves significant risk, including the potential loss of capital. Past performance is not indicative of future results. You are solely responsible for your trading decisions and should conduct your own research or consult with a licensed financial advisor before making any financial decisions.
The creator of this content assumes no liability for any losses or damages resulting from reliance on the information provided. By engaging with this content, you acknowledge and accept these risks.

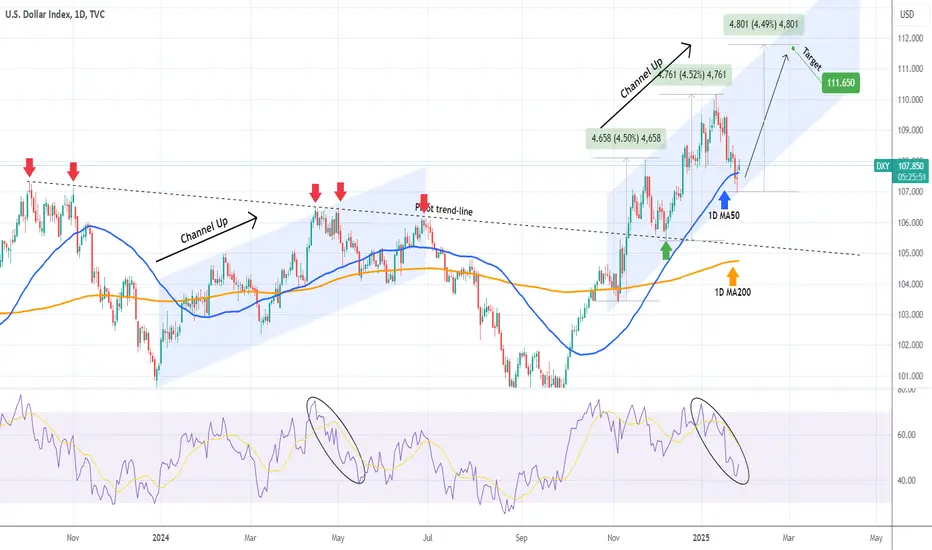
DXY rebounding on the 1D MA50 and bottom of Channel Up.The U.S. Dollar Index (DXY) has been trading within a Channel Up since the November 05 2024 Low and the break-out above the 1D MA200 (orange trend-line). Yesterday it made a new Higher Low exactly at the bottom of the Channel and shortly after breaching the 1D MA50 (blue trend-line).
This MA recovery confirms the start of the pattern's new Bullish Leg. The previous two delivered a rise of exactly +4.50%, and as such we will be looking for a similar Target at 111.650.
Note that, even though the 1D RSI resembles the May 15 2024 Low, which despite an initial rebound, it was rejected on the Lower Highs trend-line at the time, now the long-term trend has shifted to bullish as that Lower Highs trend-line turned into Support on the December 06 2024 contact.
-------------------------------------------------------------------------------
** Please LIKE 👍, FOLLOW ✅, SHARE 🙌 and COMMENT ✍ if you enjoy this idea! Also share your ideas and charts in the comments section below! This is best way to keep it relevant, support us, keep the content here free and allow the idea to reach as many people as possible. **
-------------------------------------------------------------------------------
💸💸💸💸💸💸
👇 👇 👇 👇 👇 👇
[[flash crash]]gm,
i’m reaching out today to give you a fair warning based on a concerning cross-market chart structure. the dxy is showing strong signs of strength and looks like it’s gearing up for an upside squeeze, potentially setting the stage for a breakout to levels we haven’t seen in decades.
the implications of this move could trigger a flash crash in both the stock and crypto markets world-wide, reminiscent to that of the covid crash. this time, however, i believe the catalyst will be the combination of elevated rates, inflation, and the looming debt ceiling crisis.
don’t fear the crash,,, it will present a rare buying opportunity for those who are in tune with this wilder market. a strategic player, one who profits from the collapse of this fragile economy, will thrive in these conditions.
---
if my forecast is correct, we’ll see the TVC:DXY explode up to 127,,,
while CRYPTOCAP:BTC would lose roughly half of its current value.
🌙

DXY: Ascending Triangle topping soon. Excellent sell opportunityThe U.S. Dollar Index is on a steady bullish 1D technical outlook (RSI = 60.447, MACD = 0.640, ADX = 33.835) as with the exception of November's last week, it has been rising nonstop since September 30th 2024. The price is near the HH Zone of the Ascending Triangle, the 1W RSI has double topped and we are, or getting close to, the new long term top. Technically the 1W RSI is already similar to the October 9th 2023 top. The risk now is lower in going short. Aim for the 1W MA200 (TP = 103.000), which was the level that offered the late September support.
## If you like our free content follow our profile to get more daily ideas. ##
## Comments and likes are greatly appreciated. ##

DXYDXY - U.S Dollar Index
Bullish Channel as an Corrective Pattern in Short Time Frame
Break of Structure
Completed " 12345 " Impulsive Waves
Change of Characteristics
Strong Support

dxy drops to $88Gm.
It has taken us a while to get to where we are today, and I’m excited to share an update on the DXY this fine morning as I sip the tastiest coffee in all the lands.
Two years ago, around this time, I called the top on the DXY via:
We have yet to surpass that high, and today I bring you an exciting update. The DXY has officially confirmed the drop that is to come by rejecting a target we've been eyeing for the last quarter of the year.
While there’s always a chance it could go slightly higher, I’ve included one target above the recent rejection.
If my primary theory plays out, the DXY will see a sharp decline below $90 by the end of 2025. This will also coincide with the creation of a "top" in the global liquidity index.

DXY Best level for a long-term short.The U.S. Dollar index (DXY) has been trading within a 1.5 year Channel Up pattern (since July 14 2023) and just 2 weeks ago it formed a Golden Cross on the 1D time-frame. Having hit the pattern's top a week earlier, the current rebound seems to technically be part of the Lower Highs/ Lower Lows top formation, similar to October 03 - November 01 2023 peak.
That was 1 year again, a peak formation that was also formed after a 1D Golden Cross. This indicates that the long-term pattern (Channel Up) is highly symmetrical and as the 1W RSI is also declining after a rejection on the 70.00 overbought barrier, we consider the current level the best possible short entry.
The Bearish Leg that followed the 2023 High extended as low as the 0.786 Fibonacci level. As a result, we expect to see at least 102.000 (just above the 0.786 Fib) before any signs of a rebound.
-------------------------------------------------------------------------------
** Please LIKE 👍, FOLLOW ✅, SHARE 🙌 and COMMENT ✍ if you enjoy this idea! Also share your ideas and charts in the comments section below! This is best way to keep it relevant, support us, keep the content here free and allow the idea to reach as many people as possible. **
-------------------------------------------------------------------------------
💸💸💸💸💸💸
👇 👇 👇 👇 👇 👇

Dollar Index Alert: Reversal Pattern Emerging – Learn MoreLuckily, I spotted a classic reversal pattern right on the edge of triggering.
The combination of three peaks, with the tallest in the middle, has formed a Head & Shoulders chart pattern on the Dollar Index futures daily chart.
The right shoulder is almost complete, and the bearish trigger will be activated if the price breaks below the Neckline (the line connecting the valleys of the Head), which sits under 105.30.
The target is calculated by subtracting the height of the Head from the Neckline breakdown point, giving us a target around 103.10.
The RSI indicator is also on the edge. Watch for a breakdown here as additional confirmation.

DXY DOLLAR INDEX : My vision hello guys not gonna lie i was bearish on dxy last quarter my first target was hit but suddenly price showed signs of bullishness i see price going up for previous year high.

is this the top?dx1!, dxy, us dolla - is nearing a top.
do with this information what you will, but thought i'd let you know just in case you were wondering.
---
it is possible this fifth wave sees an expansion,
and if it does, the situation in the global markets can substantially worsen.
>let's not go there unless we need to.
✌

What if the USD rally is only just getting started?The USD rally has entered its seventh week and continues to defy its seasonal tendency to weaken in Q4. And that is simply because the macro backdrop 'Trumps' its average performance this time of the year. Today I take a step back to admire the bigger-picture view of the USD index, to show why I think this rally could still just be getting started.
MS

DXY topped on the 1-year Channel Down. Strong downside potentialThe U.S. Dollar index (DXY) has been trading within a Channel Down pattern since the October 03 2023 High (13 months) and yesterday got the first red 1D candle after almost touching the pattern's top (Lower Highs trend-line) the day before.
As the 1D RSI has dropped significantly after being overbought 2 weeks ago, this is a very similar top formation to the Highs of April 16 2024 and October 03 2023. As a result this is the earliest possible sell entry we can take to target long-term the new Lower Low of the Channel Down.
The previous two Bearish Legs priced their Lows after roughly a -6.00% to -6.25% decline, just above the 1.1 Fibonacci extension. As a result, our Target is 99.800.
-------------------------------------------------------------------------------
** Please LIKE 👍, FOLLOW ✅, SHARE 🙌 and COMMENT ✍ if you enjoy this idea! Also share your ideas and charts in the comments section below! This is best way to keep it relevant, support us, keep the content here free and allow the idea to reach as many people as possible. **
-------------------------------------------------------------------------------
💸💸💸💸💸💸
👇 👇 👇 👇 👇 👇

It could be the euro's time to shineThis may not be a popular theme, but that is usually the case at turning points. Like it or not, EUR/USD bears have failed to break the August low, and the rally on the USD index and yields looks exhausted. Every trend needs a retracement, and I suspect a small one, at a minimum, is due.
MS.

USD, yields surge on Fed pushback, Trump rebound After just one day of retracing on Friday, the USD bull regained momentum on Monday thanks to Fed members continuing to push back on aggressive easing. Markets are also pricing in a Trump win with some polls suggesting he is ahead in three key states and some bookies even touting for him to win. In the current climate, USD/JPY could be at 152 before we know it.
MS

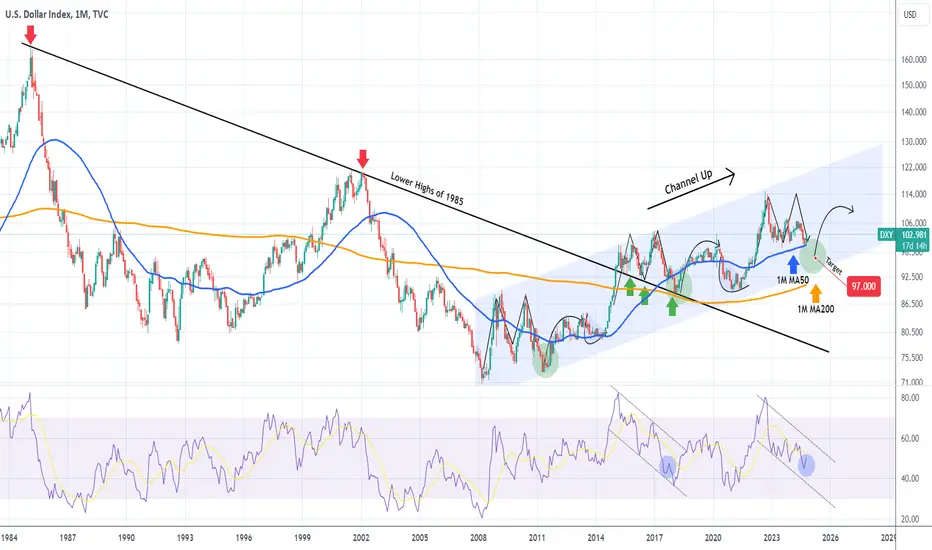
DXY Rebounding on the 1M MA50. But for how long?The U.S. Dollar index (DXY) is on a strong green 1M candle, already halfway through the month of October, as it is rebounding after making an exact test of the 1M MA50 (blue trend-line), the long-term Support.
On this chart we can see the DXY's multi-year price action. Even though it was on a heavy downtrend since the February 1985 High, it managed to break above it in January 2015 and sustain a strong Channel Up, coming off the March 2008 bottom of the disastrous Housing Crisis.
Within this strong Channel Up, we see a repeated pattern as long as Bullish and Bearish Legs are concerned. As you can see, the bottoms have been formed significantly below the 1M MA50, so this indicates that it is not time to buy yet.
If anything, a controlled short is justified and as we get closer to the bottom of the Channel Up, start buying on a multi-year basis (as long as the 1M MA200 (orang trend-line) holds). Based on the 1M RSI, where the similarities with the previous Leg are more obvious, we should be around levels similar to October 2017, so starting next month or December, we should start resuming the downtrend and a 'modest' level to target is 97.000.
-------------------------------------------------------------------------------
** Please LIKE 👍, FOLLOW ✅, SHARE 🙌 and COMMENT ✍ if you enjoy this idea! Also share your ideas and charts in the comments section below! This is best way to keep it relevant, support us, keep the content here free and allow the idea to reach as many people as possible. **
-------------------------------------------------------------------------------
💸💸💸💸💸💸
👇 👇 👇 👇 👇 👇
DXY: Still bullish but be ready to sell at the right price.The U.S. Dollar Index is heavily bullish on its 1D technical outlook (RSI = 65.833, MACD = 0.380, ADX = 45.822) as it has been rising strongly since the Sep 27th Low, not over its 1D MA50. The price action is identical to the rebound that was initiated on December 28th 2023 and reached the 0.618 Fibonacci level only to get rejected there back to the 0.5 Fib. Consequently we will remain bullish, aiming at the 0.618 Fib and the 1D MA200 (TP = 103.850) and then switch to shorting aiming a little higher than the 0.5 Fib (TP = 102.500).
## If you like our free content follow our profile to get more daily ideas. ##
## Comments and likes are greatly appreciated. ##

The dollar surge takes a breather, pullback pending?We finally saw the USD rebound I was beating the drum about back in September. But now it's hit a decent resistance zone, I weigh up its potential to hold its ground or producer a deeper pullback. Markets covered include the USD index, EUR/USD and gold.
MS.

DXY Sell this Oct-Nov dead-cat-bounce and target 97.000.Last time we looked into a such a long-term (multi-year) time-frame on the U.S. Dollar Index (DXY) was 10 months ago (December 15 2023, see chart below) where we gave the most optimal buy entry at the time:
We now take it to the 1M time-frame where the long-term trend gets more clear and the pattern as you can see is a Channel Up since the March 2008 bottom (U.S. Housing Crisis). The most recent Higher High was back in September 2022 and since then the index has been on a decline in an attempt to form the bottom on the Higher Lows trend-line of the Channel Up.
As you can see, we are in the later stages of this (multi-year) Bearish Leg but last month (September) it hit its 1M MA50 (blue trend-line) for the first time since January 2022 and held it. This is expected to delay the Lower Low for a while but most likely won't invalidate it as if it closes a 1M candle below it, we expect to test the bottom by Q2 2025.
Both the Bearish and Bullish Phases seem to be consistent within this 16-year Channel Up, having a fair degree of symmetry. The Bearish Phases have previously come in the form of successive Channel Down patterns (dashed), so if this analogy continues to hold this time also, we should be half-way through the second currently.
All those Channel Down patterns dropped to at least the 1.236 Fibonacci extension from the first pull-back they had. This consistency is remarkable. Such pattern suggests that after the current rebound is completed (technically it shouldn't exceed the 1W MA50 (red trend-line), the price could decline to 96.000.
Our Target is a bit higher at 97.000, which would make an ideal Higher Low on this 16-year old Channel Up.
After that, the confirmation to buy (which naturally will tell us that the bottom is already in) would be a 1M MACD Bullish Cross below the 0.0 mark. As you see, this took place 5 times these 16 years, all of which have been excellent buy entries with the lowest risk possible.
-------------------------------------------------------------------------------
** Please LIKE 👍, FOLLOW ✅, SHARE 🙌 and COMMENT ✍ if you enjoy this idea! Also share your ideas and charts in the comments section below! This is best way to keep it relevant, support us, keep the content here free and allow the idea to reach as many people as possible. **
-------------------------------------------------------------------------------
💸💸💸💸💸💸
👇 👇 👇 👇 👇 👇

U.S. Dollar Index is near to fall. Soon..The US Dollar Index (DXY), which measures the value of the US Dollar (USD) against basket of other six major currencies, extends its losses for the 5th consecutive week in a row, hovering below 102 points during the U.S. regular hours on Monday, August 19.
Over the past week, Gold spot (XAUUSD) has topped $2500 per ounce psychological high also, minting new all the history peak, while Forex Eur/Usd (EURUSD) pair just has flashed a positive 2024 YTD return, jumping above 1.10 psychological degree.
The US Dollar continues to weaken following dovish comments from Federal Reserve (Fed) officials, which have increased a new portion of expectations for an interest rate cut by the central bank in September. Furthermore, last week’s US economic data revealed that both the Producer Price Index (PPI) and Consumer Price Index (CPI) suggest that inflation is easing.
Federal Reserve Bank of San Francisco President Mary Daly stressed on Sunday that the US central bank should adopt a gradual approach to lowering borrowing costs, according to the Financial Times. Daly countered economists' concerns that the US economy is facing a sharp slowdown that would warrant rapid interest rate cuts.
Additionally, Federal Reserve Bank of Chicago President Austan Goolsbee cautioned that central bank officials should be careful not to maintain a restrictive policy longer than necessary. Although it's uncertain whether the Fed will cut interest rates next month, failing to do so could negatively impact the labor market, according to CNBC.
Additionally, the decline in the US yields contributes to downward pressure for the Greenback. 2-year and 10-year yields on US Treasury bonds stand at 4.05% and 3.85%, respectively, at the time of writing.
This week, all eyes will be on Federal Reserve Chair Jerome Powell's upcoming speech.
In a bottom line, the major technical graph for the US Dollar Index (DXY) indicates on possible huge decline for the next upcoming 12 to 18 months.
The secondary RSI(14) graph indicates also, the bearish sentiment prevails.

DXY hit the 1W MA200 for the 1st time in 8 months! Will it hold?The U.S. Dollar index (DXY) following the Fed's -0.50% Rate Cut, hit on Wednesday its 1W MA200 (orange trend-line) for the first time in 8 months (since the week of January 10 2024). This is obviously the strongest Support on a long-term basis and technically should attract the first wave of buying pressure.
However, the multi-year pattern, being a Channel Up, suggests that given some more weeks it should break and go for a Higher Low (blue Arc). As you can see on this pattern, every time the 1W MA200 was tested during a Bearish Leg, it broke.
The last two Bearish Legs initially made a dead-cat-bounce and then priced the Low just above the 1.236 Fibonacci extension. The 1W RSI in particular provides very useful insight on this, as on the first oversold (below 30.00) Low it makes the bounce and then on the second RSI low, which is a Higher Low i.e. a Bullish Divergence, the price bottoms and rebounds long-term.
As a result, with the 1W RSI bouncing on the 30.00 oversold barrier, we expect the price to rebound for a few weeks and then resume the downtrend towards the 1.236 and the bottom of the multi-year Channel Up. Our Target is 97.000.
-------------------------------------------------------------------------------
** Please LIKE 👍, FOLLOW ✅, SHARE 🙌 and COMMENT ✍ if you enjoy this idea! Also share your ideas and charts in the comments section below! This is best way to keep it relevant, support us, keep the content here free and allow the idea to reach as many people as possible. **
-------------------------------------------------------------------------------
💸💸💸💸💸💸
👇 👇 👇 👇 👇 👇

Why the US dollar bear should tread with careThe USD saw a sharp reversal higher despite a 50bp cut, simply because the markets were positioned for a more dovish dot plot. I have argued in prior analysis the USD exposure is a bit stretched over the near-term, so perhaps shorting the USD is getting a bit stale. We also have several key markets at inflection points after a risk event. Matt Simpson takes a technical look.
