future of the DXYHi to every one
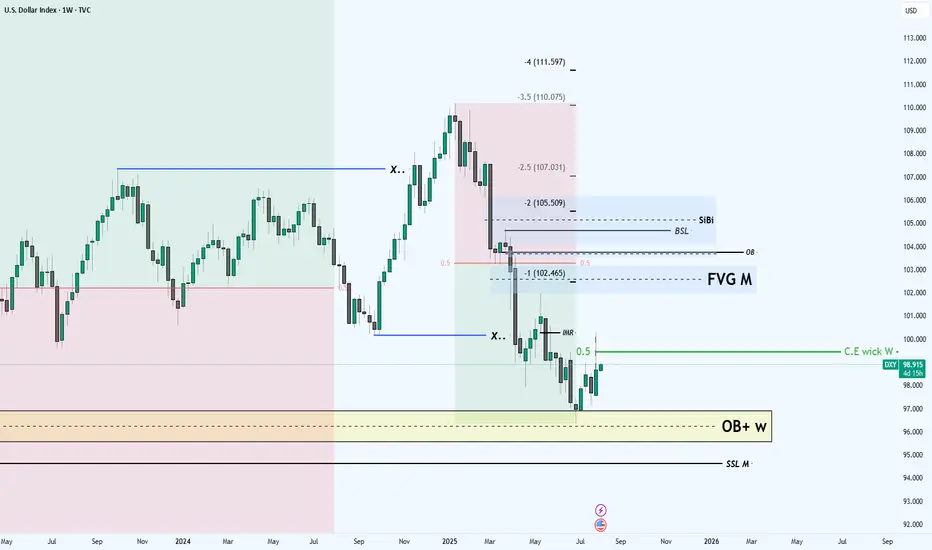
In the DXY we are in the middle of the decisioning area which means
we should wait for the market to show its hands
First sensitive level that i am looking for is the C.E of the weekly candle(Prev.week)
IF we get resistance at that level we can wait for the price to deep into the SSL M level
Other wise i don't see any indication and obstacle for the DXY to reach the OB level above the 0.5 mid level of the range
this is my the first low hanging fruit objective which is high probability
after that my ultimate objective is the SiBi to be rebalanced
This was the technical perspective
BUT
things are happening around the world the most important one is the
USA central bank Interest Rate Cutting Decision which can leads the DXY to go lower without retracting to the 0.5 of the range
this factor also should be considered BUT overall i am bullish for DXY
DXY
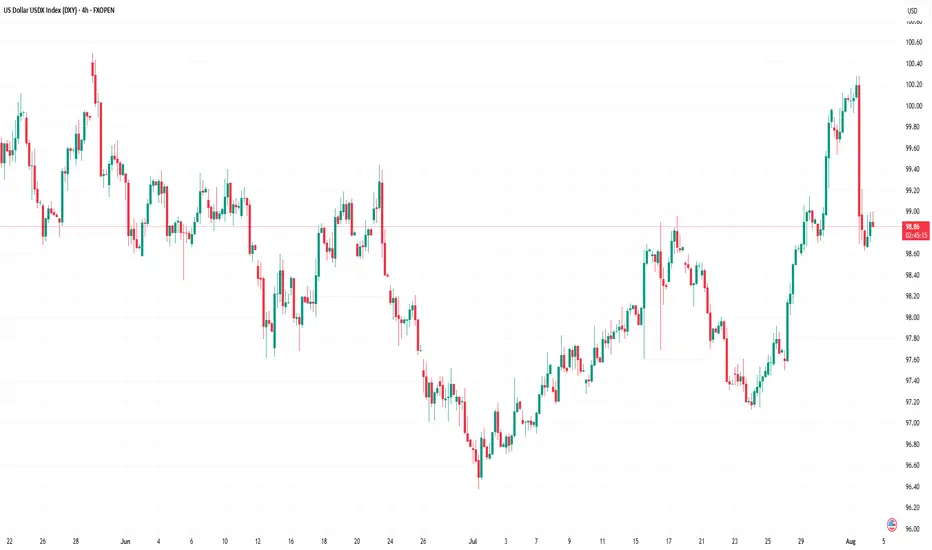
US Dollar Index (DXY) Plummets Following Labour Market DataUS Dollar Index (DXY) Plummets Following Labour Market Data
The US Dollar Index (DXY) fell by approximately 1.4% on Friday after the release of disappointing US labour market figures. According to Forex Factory:
→ The unemployment rate rose from 4.1% to 4.2%;
→ The Nonfarm Employment Change figure came in at 73K, well below the forecast of 103K. This is the lowest level of job creation in the nonfarm sector in 2025 and is roughly half the previous month’s reading (prior to revisions).
→ Furthermore, revisions for May and June were significantly more severe than usual. The May figure was revised downward by 125,000 — from +144,000 to +19,000. Similarly, the June figure was revised down by 133,000 — from +147,000 to +14,000.
These results point to a weakening labour market, which increases the likelihood of a rate cut aimed at supporting economic growth. In turn, expectations of a Fed rate cut are acting as a bearish driver for the US dollar.
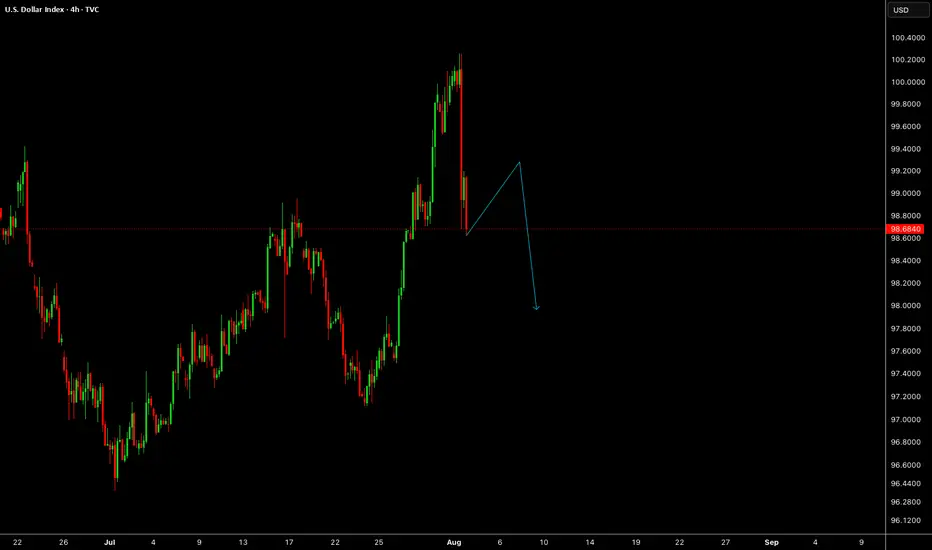
Technical Analysis of the DXY Chart
Six days ago, we highlighted two U-shaped trajectories (A and B), which together formed a bullish сup and рandle pattern on the US Dollar Index chart.
Following this, price action generated a notable upward impulse (as indicated by the arrow), breaking through the upper boundary of the pattern.
However, Friday’s news triggered the following developments:
→ A new top (4) was formed on the chart, accompanied by a false bullish breakout above the psychological level of 100.00;
→ The price declined to the 98.80 area. The downward move slowed here, as this zone had previously seen strong bullish activity during the breakout from the pattern’s upper boundary — likely explaining why the market is finding support here on Monday morning.
Overall, the technical picture has shifted towards a bearish outlook. Friday’s peak continues the summer sequence of lower highs and lows: 1 → 2 → bottom of pattern (A) → 4. This structure is part of a broader downtrend that has defined the market in 2025.
Should bearish sentiment persist, fuelled by Friday’s data, we can assume a further decline in the US Dollar Index towards the median line of the descending channel (shown in red), which has been drawn through the aforementioned price extremes.
This article represents the opinion of the Companies operating under the FXOpen brand only. It is not to be construed as an offer, solicitation, or recommendation with respect to products and services provided by the Companies operating under the FXOpen brand, nor is it to be considered financial advice.
EUR/USD - Bearish Outlook (05.08.2025)The EUR/USD Pair on the H4 timeframe presents a Potential Selling Opportunity due to a recent Formation of a Bearish Flag Pattern. This suggests a shift in momentum towards the downside in the coming Days.
Possible Short Trade:
Entry: Consider Entering A Short Position around Trendline Of The Pattern.
Target Levels:
1st Support – 1.1400
2nd Support – 1.1300
🎁 Please hit the like button and
🎁 Leave a comment to support for My Post !
Your likes and comments are incredibly motivating and will encourage me to share more analysis with you.
Best Regards, KABHI_TA_TRADING
Thank you.
Disclosure: I am part of Trade Nation's Influencer program and receive a monthly fee for using their TradingView charts in my analysis.

Gold – Eyeing the H4 FVG Before the Next Bull RunPrice has been consolidating within the current Asian range after running last week’s high and today’s daily high. The move into D-H lacked strong momentum, and with a large unfilled H4 Fair Value Gap (3,350–3,372) below, I’m anticipating a retracement to rebalance liquidity before resuming the bullish trend.
Key Notes:
D-H (~3,436) acting as short-term resistance.
Watching for a sweep of D-H to create excess on the DOM, then a potential breakdown toward the H4 FVG.
Bearish path targets: 3,397 → 3,372 → 3,350.
Bullish continuation requires a clean breakout and hold above D-H with volume.
This scenario could set up a stronger bullish leg later in the week, especially if the retracement aligns with London or NY session volatility.

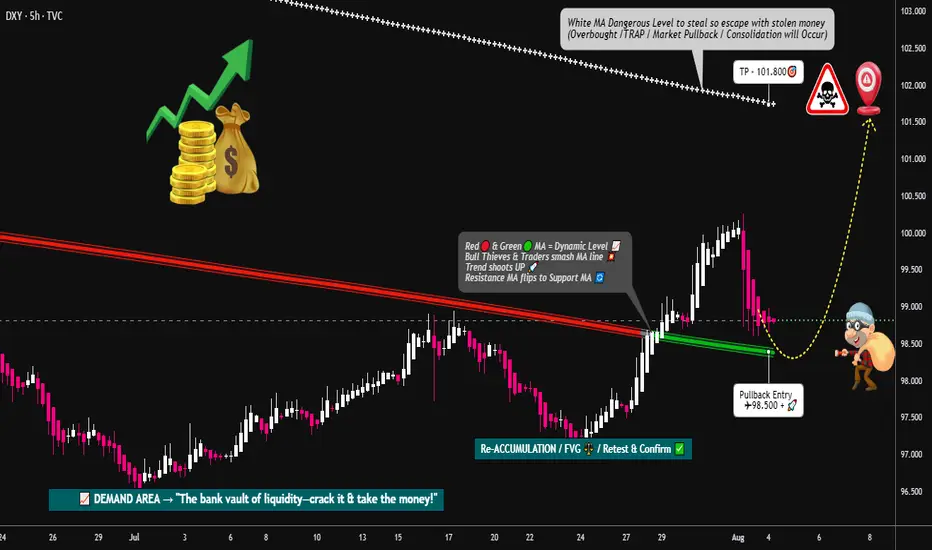
DXY Locked & Loaded: Robber's Gameplan for Profit Pullout💸💼 "DXY Market Heist Blueprint – The Thief's Bullish Escape Plan" 💼💸
Rob the Market, Not the Rules – Trade Smart, Trade Sharp, Trade Thief Style™
🌍 Hey Money Makers, Risk Takers & Market Robbers!
Hola! Ola! Bonjour! Hallo! Marhaba! 🙌
Let’s break into the DXY vault and swipe those profits with precision. 💼💸
🧠💡This Thief Trading Style™ Master Plan is a high-stakes operation backed by technical setups, macro-fundamentals, and robbery-level insights. Follow the blueprint laid out on the chart. Our target? The High-Risk Yellow ATR Zone – where the real treasure is buried.
💼 ENTRY: "The Vault Is Open – Grab the Bullish Bags!"
Enter long as price approaches key pullback levels within a 15–30 min timeframe. Use the most recent candle wick’s swing low/high for sniper-style DCA entries.
🔑 Layer multiple limit orders like a thief stacking getaway bags (aka the DCA / Layering Method). Be patient and precise.
🛑 STOP LOSS: "Don’t Get Caught by the Market Police"
📍 Place SL just below the nearest 4H swing low (example: 97.300) depending on your strategy (scalping/swing).
⚖️ Your SL should reflect your risk appetite, lot size, and how many limit orders you’re running. Thieves don’t risk it all on one job. 🎭
🎯 TARGET: 101.800 (or Escape Before the Sirens)
Once the target zone nears, decide whether to collect full loot or exit before resistance hits. We trade smart, not greedy. 🧠💰
📈 Why This Heist Makes Sense: Market Conditions Breakdown
Bullish momentum supported by macro drivers and intermarket forces
COT report and sentiment leaning in favor of USD
Dollar Index structure showing signs of reversal + trend confirmation
Consolidation trap zones hinting at institutional accumulation
💡 This is not just a blind entry—it's a well-researched and time-tested plan. Check the chart details and refer to:
🔗 Fundamentals | COT Reports | Sentiment Score | Quantitative Outlook
🚨 NEWS & POSITION MANAGEMENT ALERT
Before jumping in, beware of high-impact news!
🗞️ To keep your trades safe and stress-free:
Avoid opening new positions during major news releases
Use trailing SLs to protect gains
Monitor volatility triggers (economic calendar is your best friend!)
🏴☠️💥 BOOST THE ROBBERY – Hit That Like/Boost Button
The more you boost, the stronger the heist crew becomes! 💪🚀
Help fellow traders steal opportunities with the Thief Trading Style™ – calculated, bold, and sharp.
🔥 Let's continue to outsmart the markets and make each trade count. Stay tuned for the next heist update – fresh trades, deeper insights, and bigger bags. 🤑💼
🔔 Disclaimer: This plan is not financial advice. Use it for educational and entertainment purposes. Always conduct your own analysis and manage risk accordingly.
📌 Markets shift quickly. Stay adaptable, informed, and always ready to pivot.
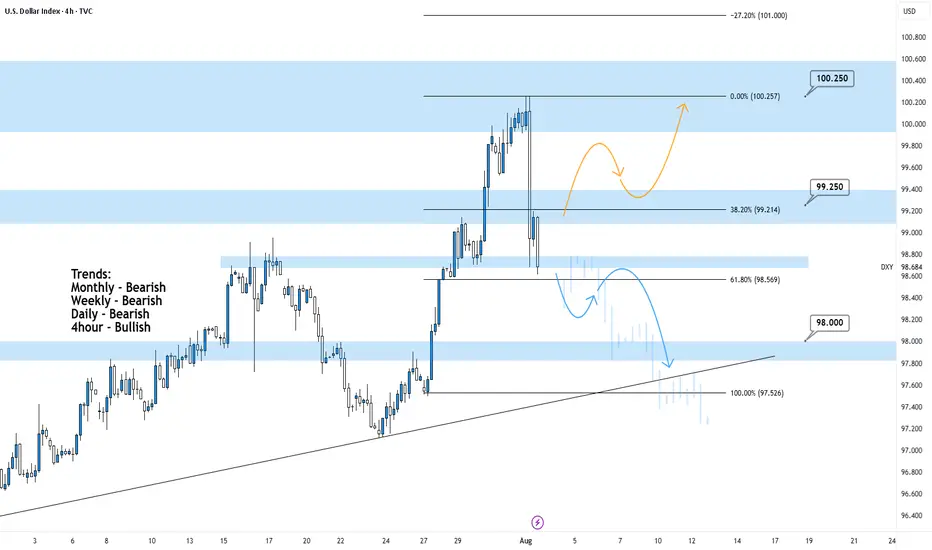
DXY 4Hour TF - August 3rd,2025🟦 DXY 4H Analysis Neutral idea
📅 August 3, 2025
🔹 Top-Down Trend Bias:
• Monthly – Bearish
• Weekly – Bearish
• Daily – Bearish
• 4H – Bullish
The dollar index is in a larger bearish cycle but just bounced from near-term resistance around 100.250. While the 4H shows temporary strength, we’re trading into major resistance and we may see it short lived.
🔍 Key Levels to Watch
• Support: 98.00
• Resistance Zones: 99.25 and 100.25
• 61.8% Fib: 98.57
Price is currently testing structure after rejecting from the 100.25 resistance zone. This area remains a strong ceiling unless the higher timeframe structure shifts.
✅ Scenario A: Bearish Continuation (Blue Path)
1. Bearish Structure confirmation below the current zone
2.If bearish rejection confirms, expect price to continue toward 98.00, possibly 97.50
3.Clean confluence with the higher timeframe trend
⚠️ Scenario B: Bullish Extension (Orange Path)
1.If price breaks and holds above 99.25, we may see a continuation toward 100.25
2.Short-term bullish strength, but against HTF bias
3.Must treat as a counter-trend idea unless confirmed with HTF structure shift
🧠 Final Notes
• 98.50 is the key decision zone, watch reaction closely
• Trend remains bearish on all major timeframes
• Don’t force the long, lean bearish unless structure proves otherwise
Gold | Oil | Dollar | Silver | Natural Gas Price ForecastGold | Oil | Dollar | Silver | Natural Gas Price Forecast
COMEX:GC1! COMEX:SI1! AMEX:UNG PEPPERSTONE:NATGAS

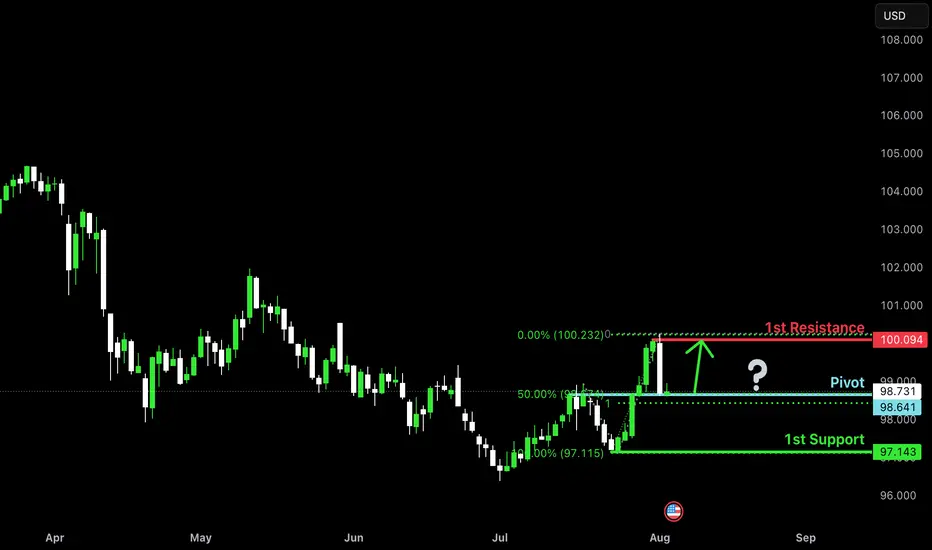
Bullish bounce off pullback support?The US Dollar Index (DXY) is reacting off the pivot, which is a pullback support that lines up with the 50% Fibonacci retracement and could bounce to the 1st resistance.
Pivot: 98.64
1st Support: 97.14
1st Resistance: 100.09
Risk Warning:
Trading Forex and CFDs carries a high level of risk to your capital and you should only trade with money you can afford to lose. Trading Forex and CFDs may not be suitable for all investors, so please ensure that you fully understand the risks involved and seek independent advice if necessary.
Disclaimer:
The above opinions given constitute general market commentary, and do not constitute the opinion or advice of IC Markets or any form of personal or investment advice.
Any opinions, news, research, analyses, prices, other information, or links to third-party sites contained on this website are provided on an "as-is" basis, are intended only to be informative, is not an advice nor a recommendation, nor research, or a record of our trading prices, or an offer of, or solicitation for a transaction in any financial instrument and thus should not be treated as such. The information provided does not involve any specific investment objectives, financial situation and needs of any specific person who may receive it. Please be aware, that past performance is not a reliable indicator of future performance and/or results. Past Performance or Forward-looking scenarios based upon the reasonable beliefs of the third-party provider are not a guarantee of future performance. Actual results may differ materially from those anticipated in forward-looking or past performance statements. IC Markets makes no representation or warranty and assumes no liability as to the accuracy or completeness of the information provided, nor any loss arising from any investment based on a recommendation, forecast or any information supplied by any third-party.
DXYDXY has given us a drop last week, lets wait for a correction to trade another drop.
Disclosure: We are part of Trade Nation's Influencer program and receive a monthly fee for using their TradingView charts in our analysis.
GOLD - WAVE 5 BULLISH TO $3,734 (UPDATE)As I said on our last update, this 'Gold Bullish Scenario' remains valid as price has still failed to close below $3,245 (Wave 2) low.
As long as Gold remains above Wave 2 high ($3,245), this Gold bullish bias remains an option. As traders we always have to be prepared to adapt to different market conditions.

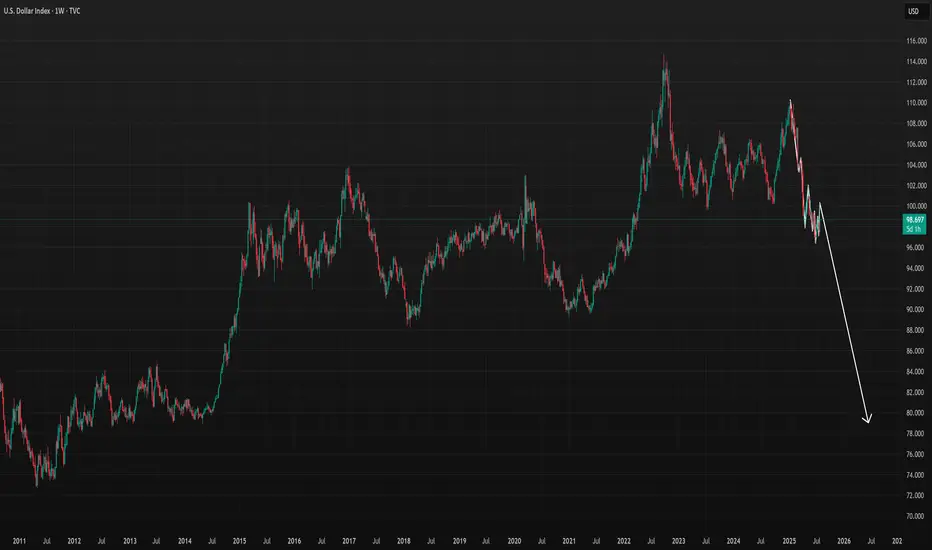
DXY to go extremely low due to Tariffs and Market ManipulationDXY to go extremely low due to Tariffs and Market Manipulation Reports
- The US Debt is almost over $38 Trillion in under 3 months
- Continue to monitor for weekly bearish signals on the chart
TVC:DXY
OANDA:USDCAD
OANDA:NZDUSD
DXY Analysis todayHello traders, this is a complete multiple timeframe analysis of this pair. We see could find significant trading opportunities as per analysis upon price action confirmation we may take this trade. Smash the like button if you find value in this analysis and drop a comment if you have any questions or let me know which pair to cover in my next analysis.

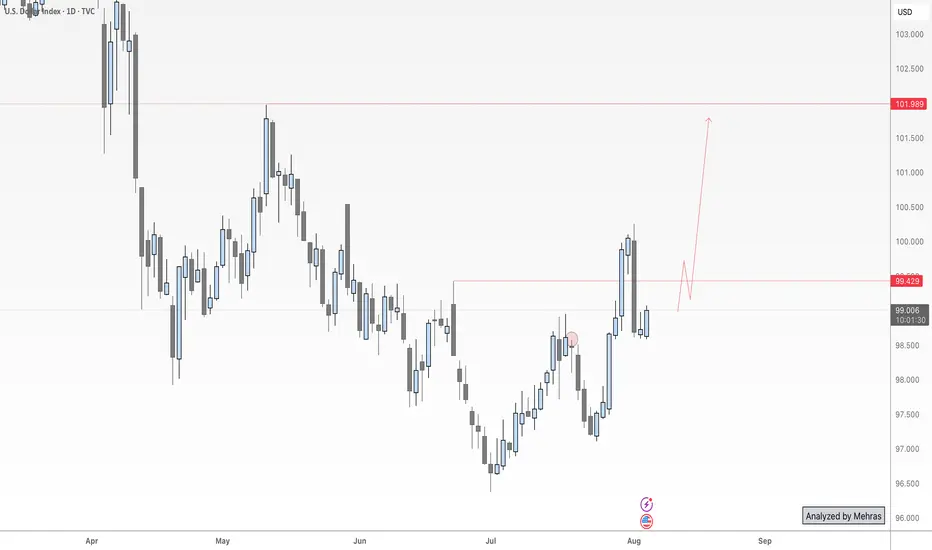
Dollar Index Update – Holding Gains After NFP Data📈 DXY Outlook – Ready for the Next Leg Up?
Last Friday, as NFP data hit the market, I published an analysis highlighting this exact move—and so far, price has respected the roadmap perfectly.
Now, with momentum building and structure aligning, the Dollar Index looks poised to continue its bullish run—first toward the 101 zone and potentially higher toward 102.
But here’s the key point for swing traders and risk-conscious setups:
🔍 If we’re aiming for higher targets with minimal drawdown, tonight’s daily candle close will be crucial.
A bullish close above yesterday’s high would not only confirm strength, but significantly reduce entry risk for long positions.
So, whether you’re already in the trade or waiting for confirmation, patience tonight could pay off.
Let’s see if the bulls can seal the deal with a strong daily close.
🔁 This analysis will be updated whenever necessary.
Disclaimer: This is not financial advice. Just my personal opinion.
DXY: Absolute Price Collapse Ahead! Short!
My dear friends,
Today we will analyse DXY together☺️
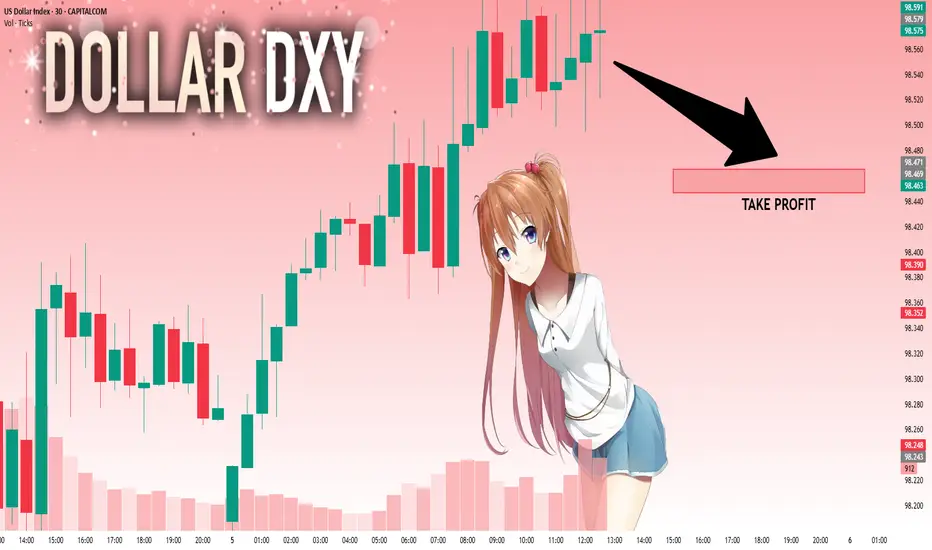
The market is at an inflection zone and price has now reached an area around 98.553 where previous reversals or breakouts have occurred.And a price reaction that we are seeing on multiple timeframes here could signal the next move up so we can enter on confirmation, and target the next key level of 98.471.Stop-loss is recommended beyond the inflection zone.
❤️Sending you lots of Love and Hugs❤️
Further downside for GBPUSDGBPUSD broke the ascending price channel on the daily chart and currently I do not see any opportunity to enter the long position because after this break the pair will head to the order flow area of 1.29990 from which the price may rebound or deal with it as a retracement zone

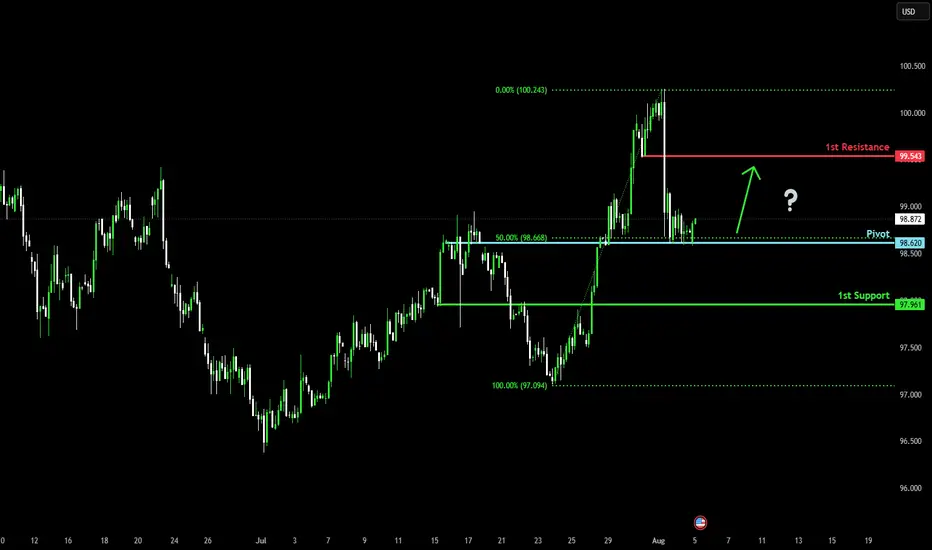
Bullish bounce off 50% Fibonacci support?US Dollar Index (DXY) is reacting off the pivot, which acts as a pullback support and could bounce to the 1st resistance.
Pivot: 98.62
1st Support: 97.96
1st Resistance: 99.54
Risk Warning:
Trading Forex and CFDs carries a high level of risk to your capital and you should only trade with money you can afford to lose. Trading Forex and CFDs may not be suitable for all investors, so please ensure that you fully understand the risks involved and seek independent advice if necessary.
Disclaimer:
The above opinions given constitute general market commentary, and do not constitute the opinion or advice of IC Markets or any form of personal or investment advice.
Any opinions, news, research, analyses, prices, other information, or links to third-party sites contained on this website are provided on an "as-is" basis, are intended only to be informative, is not an advice nor a recommendation, nor research, or a record of our trading prices, or an offer of, or solicitation for a transaction in any financial instrument and thus should not be treated as such. The information provided does not involve any specific investment objectives, financial situation and needs of any specific person who may receive it. Please be aware, that past performance is not a reliable indicator of future performance and/or results. Past Performance or Forward-looking scenarios based upon the reasonable beliefs of the third-party provider are not a guarantee of future performance. Actual results may differ materially from those anticipated in forward-looking or past performance statements. IC Markets makes no representation or warranty and assumes no liability as to the accuracy or completeness of the information provided, nor any loss arising from any investment based on a recommendation, forecast or any information supplied by any third-party.
US dollar gets hit by weird disappointing NFP numbersLast Friday the US delivered not its best NFP reading. US dollar bears jumped into action. Let's dig in!
MARKETSCOM:DOLLARINDEX
TVC:DXY
FX_IDC:EURUSD
FX_IDC:USDJPY
FX_IDC:USDCAD
Let us know what you think in the comments below.
Thank you.
75.2% of retail investor accounts lose money when trading CFDs with this provider. You should consider whether you understand how CFDs work and whether you can afford to take the high risk of losing your money. Past performance is not necessarily indicative of future results. The value of investments may fall as well as rise and the investor may not get back the amount initially invested. This content is not intended for nor applicable to residents of the UK. Cryptocurrency CFDs and spread bets are restricted in the UK for all retail clients.

XAUUSD - Will Gold Continue to Rise?!Gold is trading above the EMA200 and EMA50 on the 4-hour timeframe and is trading in its medium-term ascending channel. A correction towards the demand zone would provide us with a better risk-reward buying position, and if it rises, we could consider selling it in the supply zone.
After a relatively quiet summer, the release of disappointing U.S. employment data brought a sharp shift in the gold market’s momentum, sparking a wave of optimism among Wall Street analysts. Gold ended the trading week near the short-term resistance level of $3,350—an area that, according to Kitco’s weekly survey, reflects a surge in bullish sentiment among market analysts.
This market turnaround happened rapidly. At the start of the week, gold came under selling pressure as economic data revealed that U.S. GDP grew by 3% in the second quarter. However, many economists questioned the reliability of this growth, noting its heavy dependence on volatile trade balance figures, which makes it a poor indicator of sustainable economic strength.
Midweek, another headwind emerged for gold. The Federal Reserve decided to keep interest rates unchanged, and in a press conference, Fed Chair Jerome Powell stated that no decision had been made yet regarding the September meeting. His cautious tone was captured in the statement: “We haven’t made any decisions about September.”
However, these remarks quickly lost weight. Just two days later, U.S. employment data significantly missed expectations, dramatically reshaping the outlook for monetary policy.
According to the Bureau of Labor Statistics, the U.S. economy added only 73,000 jobs in July—a number far below forecasts. Moreover, previous job gains for May and June were sharply revised downward, with a total of 258,000 jobs removed from earlier estimates. The updated figures showed only 14,000 jobs added in June and 19,000 in May. This disappointing data alone was enough to reignite expectations of a rate cut at the September meeting—an outcome that immediately boosted gold demand.
David Morrison, adopting a cautious stance, emphasized that although the jobs data favored gold, the market remains stuck in a narrow trading range, with limited evidence of a sustained short-term rally.
He explained, “Despite the significant gains last week, gold is still consolidating within a defined range. To break above $3,400 again—and more importantly, to hold it during any retracements—we’ll likely need a period of corrective volatility and price consolidation.”
Morrison also pointed out that the recent gold price rally was driven more by a sharp decline in the U.S. dollar than by internal factors within the gold market. “This sudden spike was largely a result of the unexpected downturn in the dollar following the release of the weak non-farm payroll report (NFP),” he said.
He further warned against over-interpreting a single data point: “Yes, the report has increased the odds of a rate cut in September, but we’re dealing with highly volatile data. It’s just one number—alongside a negative revision—and it can’t alone dictate the course of monetary policy.”
Meanwhile, investment bank Citi has raised its three-month gold price forecast from $3,300 to $3,500 per ounce. The expected trading range has also shifted—from $3,100–$3,500 to $3,300–$3,600.
According to Citi, this upward revision is driven by weak U.S. economic growth, heightened concerns about inflation linked to tariffs, and a weakening U.S. dollar. The bank also cited poor labor market data in Q2 and growing doubts about the credibility of the Federal Reserve and the Bureau of Labor Statistics. At the same time, investment demand for gold remains strong, with steady central bank purchases helping to sustain the metal’s favorable market position.

EURUSDHello Traders! 👋
What are your thoughts on EURUSD?
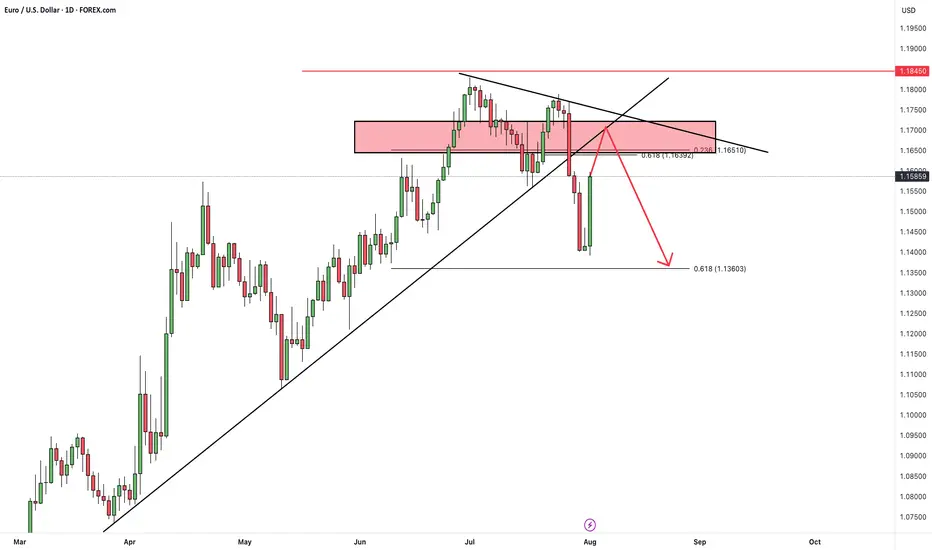
After last week's sharp decline, EUR/USD rebounded slightly on Friday, initiating a corrective move to the upside.
We anticipate this retracement to extend over the next few days, likely reaching the broken trendline and former support zone, which now acts as resistance.
As long as the pair remains below this resistance area, the bearish outlook remains valid.
Once the pullback is complete, we expect renewed downside pressure toward the next support levels.
💬 Is this just a corrective move before another leg down? Let us know your thoughts below! 👇
Don’t forget to like and share your thoughts in the comments! ❤️
Gold Daily Bias – Bulls Have the Ball, But Watch the TrapGold Daily Chart – August Outlook
Bias is still bullish for August.
Price is holding well above the big 3M FVG ($2,900–$3,100).
Strong bounce from Weekly Low ($3,331) heading toward Weekly High ($3,416).
Above $3,416 we’ve got $3,451 (M-H) and ATH ($3,508) as liquidity targets .
Seasonal tailwinds could help push us higher into Q4.
Blind spots to watch:
Still range-bound between $3,330–$3,450 for months — no clean break yet.
Unfilled FVG near $3,210 could be a draw if we reject from resistance.
August liquidity is thin — spikes can reverse fast.
Triple-top risk if we reject near $3,450 again.
Game plan:
Bullish if we get a daily close above $3,416 (confirmation) and ideally above $3,451 to aim for ATH.
If breakout fails, I’ll target range play back toward $3,290–$3,210.
Bias = bullish, but I’m staying nimble.

US Dollar Index: Was Friday the Start of a Pullback Or Reversal?Welcome back to the Weekly Forex Forecast for the week of Aug 4 - 8th.
In this video, we will analyze the following FX market:
USD Index
The DXY had a strong week, but turned bearish Friday on weak jobs numbers. Was this just a retracement from the impulsive move up? Will price now find support for another bullish leg?
It all comes down to the +FVG, whether it holds or folds.
Look for price to continue down to discount prices early in the week... and then find it's footing on support.
Enjoy!
May profits be upon you.
Leave any questions or comments in the comment section.
I appreciate any feedback from my viewers!
Disclaimer:
I do not provide personal investment advice and I am not a qualified licensed investment advisor.
All information found here, including any ideas, opinions, views, predictions, forecasts, commentaries, suggestions, expressed or implied herein, are for informational, entertainment or educational purposes only and should not be construed as personal investment advice. While the information provided is believed to be accurate, it may include errors or inaccuracies.
I will not and cannot be held liable for any actions you take as a result of anything you read here.
Conduct your own due diligence, or consult a licensed financial advisor or broker before making any and all investment decisions. Any investments, trades, speculations, or decisions made on the basis of any information found on this channel, expressed or implied herein, are committed at your own risk, financial or otherwise.

EUR/USD Reversal or Trap? 4H Clean Breakdown InsidePrice just tapped into a high-probability sell zone after a corrective Wave 2 structure. With sellers already active at 1.16342 and 1.17635, this setup is not just textbook—but a potential goldmine for swing traders.
🔻 Is this Wave 3 continuation about to begin?
🔍 Liquidity swept. Zones respected. Structure still bearish.
⚠️ Many traders will miss the bigger picture here—will you?
👇 Drop your thoughts:
Are we about to break 1.13000?
Do you agree with the Elliott Wave count?
What’s your bias on DXY?
💬 I personally reply to every comment—let’s build this chart together.
🔥 If you caught the entry, show your entry point and reasoning—let’s level up as a team.

