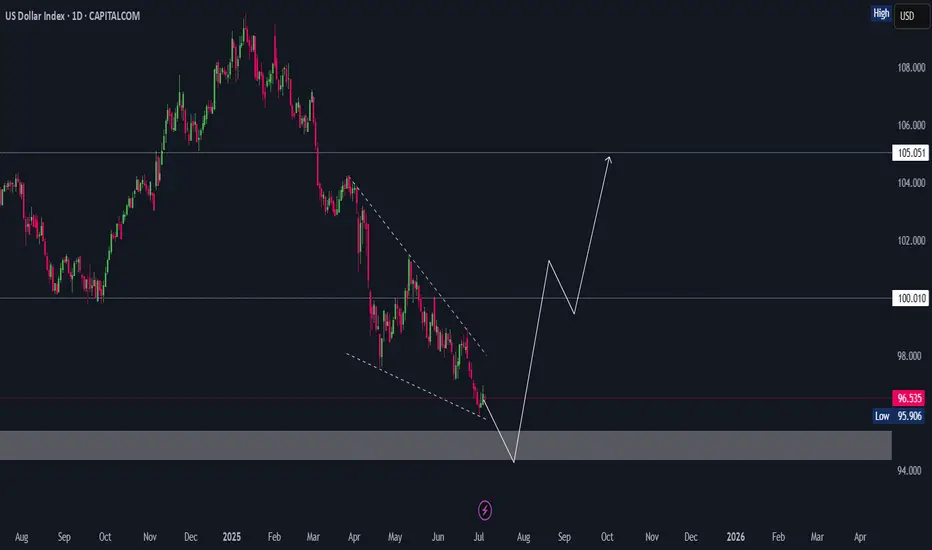
Major resistance level ahead?US Dollar Index (DXY) is rising towards the pivot and could reverse to the 1st support.
Pivot: 97.90
1st Support: 96.46
1st Resistance: 98.57
Risk Warning:
Trading Forex and CFDs carries a high level of risk to your capital and you should only trade with money you can afford to lose. Trading Forex and CFDs may not be suitable for all investors, so please ensure that you fully understand the risks involved and seek independent advice if necessary.
Disclaimer:
The above opinions given constitute general market commentary, and do not constitute the opinion or advice of IC Markets or any form of personal or investment advice.
Any opinions, news, research, analyses, prices, other information, or links to third-party sites contained on this website are provided on an "as-is" basis, are intended only to be informative, is not an advice nor a recommendation, nor research, or a record of our trading prices, or an offer of, or solicitation for a transaction in any financial instrument and thus should not be treated as such. The information provided does not involve any specific investment objectives, financial situation and needs of any specific person who may receive it. Please be aware, that past performance is not a reliable indicator of future performance and/or results. Past Performance or Forward-looking scenarios based upon the reasonable beliefs of the third-party provider are not a guarantee of future performance. Actual results may differ materially from those anticipated in forward-looking or past performance statements. IC Markets makes no representation or warranty and assumes no liability as to the accuracy or completeness of the information provided, nor any loss arising from any investment based on a recommendation, forecast or any information supplied by any third-party.
DXY

DXY: Bears Are Winning! Short!
My dear friends,
Today we will analyse DXY together☺️
The recent price action suggests a shift in mid-term momentum. A break below the current local range around 96.860 will confirm the new direction downwards with the target being the next key level of 96.760.and a reconvened placement of a stop-loss beyond the range.
❤️Sending you lots of Love and Hugs❤️

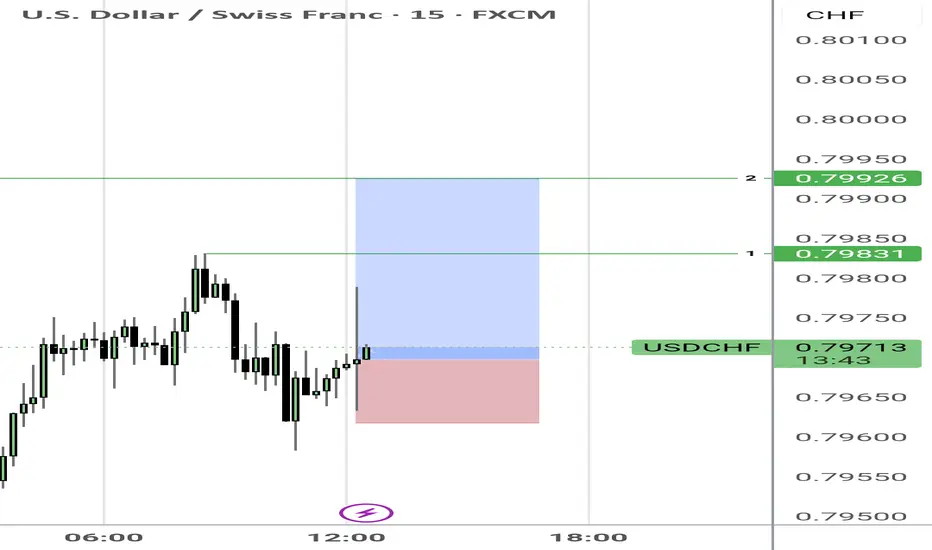
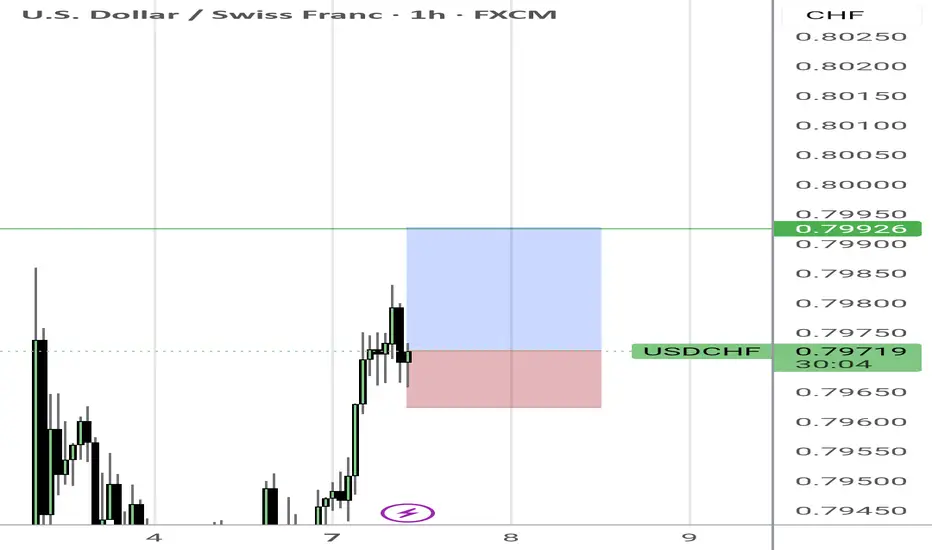
Usdchf long scalpI like the clear rejection of last time's bias at 50% of range.
We are hovering near equal highs.
I like to simulate a buy from here. This is the second simulation.
Follow for more. I plan to simulate 100 simulations of trades for entertainment purposes if I get the support.
SELL USDJPYIn todays session we are monitoring USDJPY for selling opportunity. Our entry is at 145.746 and our stops are above 146.357 . Our targets is 143.376. Use proper risk management. Cheers

What’s EURUSD Telling Us on the 30-Minute Chart?🌅 Good morning, my friends,
EURUSD just made a pullback within the last 30 minutes, so I entered a sell position based on that move.
🎯 Targets:
- TP1: 1.17607
- TP2: 1.17475
- TP3: 1.17174
🛑 Stop Loss: 1.17938
📊 Risk/Reward Ratio: 2.00
Your likes and support are what keep me motivated to share these analyses consistently.
Huge thanks to everyone who shows love and appreciation! 🙏

On Swing Traders’ Radar: Gold Pattern Alert on the Daily Chart!Dear Traders,
In my daily gold analysis, I’m observing a Head and Shoulders pattern nearing completion. The neckline is currently positioned around the 3,247.00 level.
If this neckline breaks to the downside, gold could potentially drop toward the 3,150.00 area.
Since this is a one-day analysis—aligned with a swing trading style—it may take some time for the setup to fully play out.
I meticulously prepare these analyses for you, and I sincerely appreciate your support through likes. Every like from you is my biggest motivation to continue sharing my analyses.
I’m truly grateful for each of you—love to all my followers💙💙💙

07.07.25 Morning ForecastPairs on Watch -
FX:AUDCAD
FX:USDJPY
FX:EURUSD
A short overview of the instruments I am looking at for today, multi-timeframe analysis down to what I will be looking at for an entry. Enjoy!

Will The new Week kick off more bullish Pressure for GOLD?looking for more bullish activity this week but need to sit on my hands for now to see if they establish a Low for the week first. Once we see that and start to see HH's made then we can consider a entry to get in on the move. I cant rush it though. Have to be patient.

DXY Bullish IdeaDXY has been printing Lows since past weeks and is currently testing a good long term support. A good bounce is expected in dollar.
Gold | Oil | Dollar | Silver | Natural Gas July 2025 Forecast.July 2025 Forecast.
Gold | Oil | Dollar | Silver | Natural Gas
NYMEX:NG1! COMEX:GC1! COMEX:SI1! AMEX:UNG

DXY 4Hour TF - July 6th, 2025DXY 7/6/2025
DXY 4hour Bearish Idea
Monthly - Bearish
Weekly - Bearish
Dailly - Bearish
4hour - Bearish
All timeframes are suggesting we are sitll very much bearish. Going into this week we can spot two scenarios that will consider DXY either bullish or bearish.
Bearish Continuation - Ideally we can see price action stay below our 97.500 resistance zone which is also our 38.2% fib level. Look for price action to reject 97.500 with strong bearish conviction. This will most likely confirm a bearish dollar for the week ahead. Keep in mind, price action can push up to the 98.000 zone and still remain bearish.
Reversal - This is the less likely move for the week ahead but not impossible. For us to consider DXY bullish again on the 4hour timeframe we would need to see price action push above our 98.000 resistance area with a confirmed higher low above. Look for strong bullish rejection above & off of 98.000 acting as support. This is the first step for DXY in becoming bullish again.

$DXY: New lows begets new lows. $USM2: Why is it increasing? Here we are again with one more TVC:DXY chart analysis. I think the US Dollar does not fail to surprise us week after week. Making new lows every week is giving a boost to the Equity markets. The SP:SPX and NASDAQ:QQQ are at ATH. In my articles on April 18 and June 16
Perfect trade setup: AMEX:GLD to 325; DXY to 95 for AMEX:GLD by RabishankarBiswal
TVC:DXY weakness and EM markets: NSE:NIFTY more upside? for NSE:NIFTY by RabishankarBiswal — TradingView
We have time and again said that in the near term TVC:DXY chart looks weak and could touch 95 by end of July. I think it might be achieved earlier. We have looked at the consequences of 95 handle on TVC:DXY on various asset classes like AMEX:GLD , NSE:NIFTY and EMs. These asset classes are reaching ATH every single week. But we have seldom investigated the reason behind the weakness in $DXY. Looking through my macro charts I found an amazing chart which might explain most of this weakness.
The ECONOMICS:USM2 is almost at 22 T $ surpassing its previous high on March 2022. M2 is basically the total amount of money in circulation in the economy on top of the nominal M1. Higher M2 indicates higher amount of liquidity which is then channelized into riskier assets like CRYPTOCAP:BTC , AMEX:GLD , SP:SPX , NASDAQ:QQQ and EMS like $NIFTY. And with such high ECONOMICS:USM2 in circulation, it is very clear why TVC:DXY is making new lows each week. This can also explain why US Fed is hesitant to reduce rates. With M2 so high US Fed should not hurry.
Verdict: TVC:DXY to 95 by 31 July, Cycle low of 90 by year end. ECONOMICS:USM2 keeps increasing. US Fed stays put.

DXYDXY still needs more correction upside, once we see more upside we will see if dollar is ready for one last drop.
Disclosure: We are part of Trade Nation's Influencer program and receive a monthly fee for using their TradingView charts in our analysis.

July 7 - 1th: Sell The RIPs, Buy The DIPs! (PART 1)This is Part 1 of the FOREX futures outlook for the week of July 7 - 11th.
In this video, we will analyze the following FX markets:
USD Index, EUR, GBP, AUD, NZD, & CAD.
Last Friday was a bank holiday, so the price action is discounted. This Monday has no red folders on the calendar, so the environment is set for a day of misdirection. Be careful to take only trades that confirm your directional bias!
USD is still weak, and analyst have determined the FED will put off cutting rates until September. Tariffs wars may start up again July 9th. And Trumps Bill can add 3+ trillion to the debt.
None of this supports the USD!
Look to buy the dips xxx USD, and look to sell the rips vs USD xxx.
Enjoy!
May profits be upon you.
Leave any questions or comments in the comment section.
I appreciate any feedback from my viewers!
Like and/or subscribe if you want more accurate analysis.
Thank you so much!
Disclaimer:
I do not provide personal investment advice and I am not a qualified licensed investment advisor.
All information found here, including any ideas, opinions, views, predictions, forecasts, commentaries, suggestions, expressed or implied herein, are for informational, entertainment or educational purposes only and should not be construed as personal investment advice. While the information provided is believed to be accurate, it may include errors or inaccuracies.
I will not and cannot be held liable for any actions you take as a result of anything you read here.
Conduct your own due diligence, or consult a licensed financial advisor or broker before making any and all investment decisions. Any investments, trades, speculations, or decisions made on the basis of any information found on this channel, expressed or implied herein, are committed at your own risk, financial or otherwise.

DXY (Dollar Index) longs to shortsThe dollar has been bearish for several weeks, but we’re now starting to see signs of a potential retracement due to price being in oversold territory. Last week, DXY reacted from a key weekly demand level, suggesting that we could see some short-term bullish movement before any continuation to the downside.
I’ll be watching closely for price to either push higher into liquidity or retrace slightly deeper into more discounted demand zones for a cleaner long setup. This would also align with my short setups across other major pairs, making DXY strength a key narrative this week.
Confluences for DXY Longs:
DXY has been bearish for an extended period — now showing signs of accumulation on higher timeframes
Price may retrace upwards to collect liquidity before continuing its macro downtrend
Recently reacted from a major weekly demand zone
Imbalances and liquidity above, including Asia highs, remain untapped
P.S. If price fails to react from any of my current POIs, I’ll patiently wait for new zones to develop and adjust accordingly — always staying aligned with what price tells us.
Let’s stay sharp and crush the week ahead!

Relation between DXY BTC TOTAL#📄 Analysis of three price charts and comparison between dates and movement
◀️ So far, the anticipated rise in alternative currencies has not occurred, and the rise that has happened is considered small and weak since the bottom of 2022
📄 In the first price chart, we see the movement of the US Dollar Index (DXY)
🔽 Each time the index breaks below the 100.00 level, it has a path to test 90.00, and this path has been achieved twice before during the periods of 2017 - 2018 and 2020 - 2021, with each time lasting approximately 320 days
◀️ At the moment we are in, there has been a break below the 100.00 level in DXY, and we are currently on day 84 of this break
⭕️ In the first break between 2017 - 2018, Bitcoin moved up by 2128%, and alternative currencies moved up by 3030%
⭕️ In the second break between 2020 - 2021, Bitcoin moved up by 608%, and alternative currencies moved up by 1668%
⭕️ In the current third break, which is still in its early stages, Bitcoin has moved up by 48%, and alternative currencies have moved up by 23%
⌛️ This period may extend into the first quarter of 2026, and it is essential to monitor developments closely with daily and weekly follow-ups

Forex. Orderflow. [30.06--04.07]Covering forex pairs. Thoughts and weekly runs and GJ for possible expansion next week
Having a sore throat bear with that

GOLD - SHORT TO $2,800 (UPDATE)Gold closing the week below our 'premium resistance zone', running roughly 170 PIPS in profit. Hope you all are in sells & running in profit like my Gold Fund investors as this was called live for you.
Don't forget we could also have a possible liquidity zone sitting just above $3,400 like I told you all earlier this week. Just something to be careful of & stay prepared in advance.

BTC vs DXY – Macro Setup at a Crossroads
Looking at BTC and DXY on the weekly, we’ve seen 3 key periods so far. In the first two, the pattern was clear: BTC went up, DXY went down.
Now we’re in the third period: what’s next?
👉 Has the move already played out?
👉 Is it happening now?
👉 Has DXY bottomed and BTC topped, or will DXY go lower while BTC climbs?
Macro conditions may help guide us.
BTC looks strong — supported by ETF inflows, on-chain strength, and institutional demand.
DXY looks weak — with softer economic data and rising expectations for rate cuts.
In my view, tariffs are likely to weigh heavier on DXY than BTC, favoring more upside for BTC.
The recent Big Beautiful Bill could also add fuel to BTC while adding pressure on DXY.
Always take profits and manage risk.
Interaction is welcome.

US DOLLAR: Sell opportunity following channel breakPrice on DXY recently broke above a sharp descending channel, but the move lacked presence. There was no real follow-through and certainly no conviction behind the candles. It felt hesitant, as this is a great indication for us to use.
Instead of accelerating upward, price now hovers just above the breakout, this kind of behavior suggests rather a random push than a shift in sentiment. Without the strength to sustain above structure, I think we will see the price come back to the channel's lower border.
And when breakouts fail, they often trap early longs, preparing for a more committed move in the opposite direction.
A rejection from this level could send price into the 0.85800 level.

Dollar Testing The Channel Support It’s already Friday and the 4th of July, so US holidays are here, which means we could see thinner trading conditions later today. Still, the overall tone remains risk-on since yesterday, supported by better-than-expected Non-Farm Payrolls data and an ISM services reading at 50.8—still in expansion territory. So, there’s some optimism in the market, and this could continue if we get a positive outcome on the tariff front ahead of the July 9th deadline.
On the back of strong economic data, US yields are moving higher, but the Dollar Index is trying to come lower. It’s currently retesting the lower trendline of a corrective channel—likely due to the strong rally in US stock indexes, which are keeping the dollar under pressure.
On the daily chart, the Dollar Index still looks like it could head to new lows, but that move may not come today if holiday conditions slow down the market. We might have to wait until next week for a clearer breakout.
GH

Gbpusd long idea after reversalUpdate of previous call after we broke structure.
I see this one attacking buyside liquidity at equal highs formed on Tuesday.
Possible market maker buy model playing out here.
