Will Gold Break out for the New Month this week?I was anticipating these possible sweeps. with it being the end of the month I'm thinking I might need to do more watching for now than positioning. waiting for the market to show its hand on what it wants to do next.
DXY

Gold | Oil | Dollar | Silver | Natural Gas Price Forecast.Gold | Oil | Dollar | Silver | Natural Gas Price Forecast.
NYMEX:NG1! COMEX:GC1! AMEX:UNG COMEX:SI1!

DXY 4hour TF - June 29th, 2025DXY 6/29/25
DXY Bearish Idea
All significant timeframes (monthly,weekly,daily 4hr) appear bearish for now.
Last week on June 25th, 2025 we saw price action break through our 98.000 zone confirming more bearish movement. This week we have two likely options that we will wait for confirmation on.
Bearish Continuation - Ideally we keep with the trend and look for lower highs below 98.000 for further confirmation. If we can spot rejection from this zone it is likely we will see DXY continue bearish for the week ahead.
Reversal - This is less likely but still possible. Price action could punch back through the 98.000 resistance and begin retesting previous highs. If this happens look for candlestick confirmation above 98.000 and expect a more bullish DXY for the week ahead.

Skeptic | Weekly Watchlist : DXY Triggers & Pro SetupsLast week, DXY played out our bearish scenario perfectly, breaking the short trigger at 98.530 and delivering a strong downward move . With Higher Wave Cycle (HWC) and Minor Wave Cycle (MWC) now bearish, I’m leaning heavier on short positions with tighter risk management. Let’s break it down with no FOMO, no hype, just reason. 📊
Daily Timeframe: The Big Picture
The key support at 98.801 was decisively broken, and we’ve confirmed below it—the major trend is now fully bearish. The next daily support lies at 96.478 , but I expect range-bound action early this week, especially after last week’s big move. Patience is key—let the market form a clear structure before jumping back in.
Key Insight: The bearish trend is locked in, but early-week consolidation is likely. Wait for the market to signal its next move.
4-Hour Timeframe: Long & Short Triggers
Zooming into the 4-hour chart, let’s pinpoint Low Wave Cycle (LWC) and triggers for long and short setups:
Short Trigger: Break below 4-hour support at 96.995 , confirmed by RSI re-entering oversold. Want to wield RSI like a pro? Check out my RSI Masterclass —it’s a game-changer! 😏
Long Trigger: Break above resistance at 98.215 . This is riskier since it’s against the bearish trend—set a wider stop-loss and take profits quickly. Why? HWC and MWC are bearish, so the first uptrend wave risks stop-loss hunts or fakeouts. I’ll drop an HWC/MWC/LWC guide soon to optimize entries, stops, and more—stay tuned!
Pro Tip: For longs, expect volatility in the first wave. Shorts align with the trend, so they’re the safer play—focus on 96.995.
Final Vibe Check
This Weekly Watchlist sets you up to trade smarter, not harder. DXY’s bearish momentum is our focus, but patience will unlock the best setups. I’ll keep you updated daily as markets evolve. Protect your capital—max 1%–2% risk per trade, no exceptions. Want the HWC/MWC/LWC guide or another pair? Drop it in the comments! If this watchlist sharpened your edge, hit that boost—it fuels my mission! 😊 Stay disciplined, fam! ✌️
💬 Let’s Talk!
Which setup are you eyeing this week? Share in the comments, and let’s crush it together!

“The Dollar Job: Break-In Strategy for 99+ Profits”💸 “DXY Heist Blueprint: Thieves’ Bullish Breakout Play” 🏴☠️
🌟Hi! Hola! Ola! Bonjour! Hallo! Marhaba!🌟
Welcome, Money Makers & Silent Robbers 🕶️💼✨
This is our next big Thief Trading Heist Plan targeting the 💵 DXY Dollar Index Vault. Armed with both technical precision 🔍 and fundamental insight 📊, we're ready to strike smart — not just fast.
🎯 THE MASTER HEIST PLAN:
🟢 ENTRY POINT – “Heist Entry Protocol”
🎯 Wait for price to break above Resistance @ 99.000 and candle to close ✅
💥 Plan A: Place Buy Stop Orders just above breakout
📥 Plan B: For Pullback Pros, use Buy Limit at recent swing low/high (15m–30m TF)
📌 Tip: Set alerts — don’t get caught napping while the vault opens! ⏰🔔
🛑 STOP LOSS – “Thief’s Escape Hatch”
🧠 Use 4H swing low at 98.100 as SL
⚖️ Adjust based on your lot size and number of open positions
🚨 Don't rush to set SL for Buy Stop entries before confirmation! Patience is part of the plan. 😎
🎯 TARGET – “Mission Objective”
💰 First Exit Target: 100.000
🏃♂️ Optional: Escape earlier near high-risk zones (Blue MA Line Trap Area)
⚔️ SCALPERS' CODE – Stay Sharp!
Only scalp on the Long side.
🔐 Use Trailing SL to guard your loot!
💸 Big wallets? Jump early.
🧠 Smaller stack? Follow the swing crew for coordinated execution.
🌐 MARKET OUTLOOK: WHY THE VAULT’S OPENING
💡 Currently seeing bullish momentum in the DXY
📈 Driven by macroeconomics, sentiment shifts, and intermarket pressure
📰 Want the full debrief? Check our analysis across:
COT Data
Geopolitics & News
Macro Trends & Sentiment
Fundamental Forces
📎🔗 See full breakdown
⚠️ TRADE MANAGEMENT ALERT
🚫 Avoid opening new trades during high-impact news
🔁 Always use Trailing Stops to lock in profits
❤️ Support The Heist – Boost the Plan!
Every boost powers our underground crew 🐱👤.
We rob the markets, not the people. 💼💰
Like & Boost to help grow the Thief Trading Gang 👊💥
Stay tuned, robbers – more heist plans dropping soon.
💸🚀📈🤑

DXY Swing Short! Sell!
Hello,Traders!
DXY keeps falling down
And the index broke the
Key wide horizontal level
Around 97.800 which is now
A resistance and the breakout
Is confirmed so we are very
Bearish biased and we will
Be expecting a bearish
Continuation on Monday
Sell!
Comment and subscribe to help us grow!
Check out other forecasts below too!
Disclosure: I am part of Trade Nation's Influencer program and receive a monthly fee for using their TradingView charts in my analysis.

RSI Flashes Warning on EURUSD: Critical Level Under Watch!Good morning traders,
If the EURUSD pair breaks below the 1.16729 level due to an RSI divergence, the next potential target could be around 1.16093.
Keep in mind that a break below 1.16729 may also signal a potential trend reversal.
I've marked the pivot points for you on the chart for better clarity.
Additionally, it's crucial to keep an eye on current economic data and news releases as part of your fundamental analysis.
I meticulously prepare these analyses for you, and I sincerely appreciate your support through likes. Every like from you is my biggest motivation to continue sharing my analyses.
I’m truly grateful for each of you—love to all my followers💙💙💙

Elliott Wave Analysis for EUR/USD - Bullish OutlookPEPPERSTONE:EURUSD
This analysis is based on the application of Elliott Wave principles for the EUR/USD market on a weekly timeframe.
💡 Wave Identification:
Corrective Cycle (ABC): After a peak marked by wave B, the market completed a 5-wave downward structure (waves 1 to 5), forming wave C, signaling a possible end of the correction.
Potential Reversal Zone (2/B): The current point is a strategic level where a bullish rebound is anticipated.
📊 Projection:
A bullish impulse is expected from point C. The initial target lies in the 1.1140 - 1.1217 zone, corresponding to key resistance levels and Fibonacci projections.
🧠 Conclusion:
A breakout above 1.0440 could confirm a significant bullish impulse, suggesting buyers are regaining control.
⚠️ Disclaimer : This analysis is not financial advice. Always conduct your own research before investing.

DXY STRONG DOWNTREND CONTINUES|SHORT|
✅DXY is going down currently
In a strong downtrend and the index
Broke the key structure level of 98.000
Which is now a resistance,
And after the pullback
And retest, I think the price
Will go further down next week
SHORT🔥
✅Like and subscribe to never miss a new idea!✅
Disclosure: I am part of Trade Nation's Influencer program and receive a monthly fee for using their TradingView charts in my analysis.

NASDAQ Potential UpsidesHey Traders, in today's trading session we are monitoring NAS100 for a buying opportunity around 22,380 zone, NASDAQ is trading in an uptrend and currently is in a correction phase in which it is approaching the trend at 22,380 support and resistance area.
Trade safe, Joe.

Dollar Bullish Correction To $103 - $105While we expected to see some Dollar upside in Q2, the economy was in such a bad state that the Dollar could not hold its value. Since the start of 2025 the Dollar is down 12% and this is only the beginning.
I believe we will see more downside in the future. But for the coming quarter there is a chance for the Dollar to get some breathing space & recover in the short term. Overall, the trend of the Dollar remains bearish, so what we want to keep an eye on is small pumps (short term recovery) into price zones which will allow us to short the Dollar back down.
I want to see a dip lower towards $96 - $94 before sellers lose bearish momentum. If this move takes place, then we can slowly see buyers step back into the market & start pushing back to the upside. Once price hits our ‘Supply Zone’ of $103 again, it’ll give us a more clear indication of what the Dollar will do next; whether that’s a longer term uptrend or a continuation to the downside.

GBPUSD Potential DownsidesHey Traders, in the coming week we are monitoring GBPUSD for a selling opportunity around 1.37400 zone, GBPUSD is trading in a downtrend and currently is in a correction phase in which it is approaching the trend at 1.37400 support and resistance area.
Trade safe, Joe.

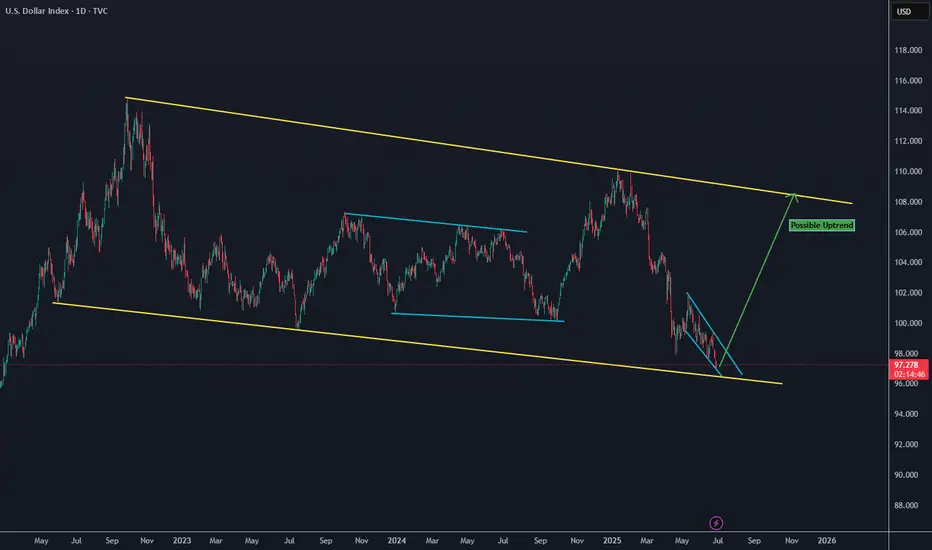
US DOLLAR INDEX BOTTOMING?DXY looking for bottom and reversal around 97.
possible target : 108+
stop trade below 96.
good luck.

GOLD - SHORT TO $2,800 (UPDATE)Our original sell bias from $3,347 which I posted live for you all, is now running in deep profits! Market is now down & running 810 PIPS in profit in just 2 days.
We have broken structure to the downside, crossing below our previous 'Wave E' low, indicating & acting as stronger confluence that Gold will carry on down towards our $2,800 target. Huge profits en-route for us all in this free channel.

Make Dollar Great AgainDXY Big Picture
While looking at other DXY charts to use a clean chart for HTF, I saw that it touched historical trend support. It didn't touch only on the TVC chart, so I am adding it with the other charts and accepting that it touched the trend.
According to the fractal I added in August last year, the price is moving very well.
I expect a correction from these areas. I think we have reached the reversal areas due to both the momentum in the declines and the oversold.
The decline fatigue I mentioned is more evident in LTF charts. The price cannot reach the EQ zone of the decline channel that has been going on since February on the daily chart. Although it is a very inclined channel on the 4h chart, it can no longer reach the channel bottom. For this reason, I think this region is where reversal should be sought. After the first 0.38 of this decline, I think a pullback to 0.5 is possible.

WHAT IS THE EXPECTED RETURN and DURATION of this GOLD Bull Run?Well, when measured against the DXY index, a clear trend becomes apparent.
A Golden Bull typically lasts about 40 quarters, which is essentially 1 decade (give or take a quarter).
Similar to #Bitcoin and its cyclical bull markets within a larger secular bull, the returns tend to decrease over time.
However, it seems that a triple-digit Gold price relative to the DXY is on the horizon at the very least.
What would that look like if the DXY were to hit a new low around 69? This would suggest a Gold price of $6900 at a ratio of 100:1.
A Gold price of $12K with a DXY of 80 only requires a ratio of 150...
Thus, a five-digit Gold price is certainly within the realm of possibility.
I have forecasts that extend as high as $12K.

GOLD - SELL TO $3,288 (1H VIEW)Still looking for a move lower into the $2,787 - $3,276 zone, to take out the June low, like I mentioned to you all a few days ago.
Tomorrow is Friday so be careful as price action could be choppy & use strict risk management.
⭕️Imbalance Left Below $3,300 Psychological Number.
⭕️Either Wave 2 or Wave C Not Complete of Major Impulse Move Down.
⭕️Sellers Holding Below Resistance Zone.
TP: $3,288

DOLLAR INDEX (DXY): Critical Moment
With an unprecedented pace of weakness of US Dollar,
DXY Index is now testing a historic weekly support cluster.
If the market breaks it today and closes below that, it will
open a potential for much more depreciation.
Next historic support will be 95.5 and a downtrend will continue.
Today's US fundamentals can be a trigger.
Please, support my work with like, thank you!

USDCAD - Outlook Short on all IndicatorsUSDCAD - Outlook Short on all Indicators
TVC:DXY
FRED:TREASURY
ECONOMICS:USGD
US CONS
- The US Treasury is under $353.5 Billion.
- DXY will continue to fall.
- The Decline of the US Dollar will continue.
- US Debt has exceeded $36 Trillion
- US Federal Debt Deficiency of over $2 Trillion (Must be paid prior to Interest Payments)
- US Federal Interest (over $1 Trillion)
- War in Iran
- USD could be converted to GOLD and moved to BTC
- Moody's US credit rating reduce.
- Interest Rate Cuts
US PROS
- Trump could get funding from another country.
- Interest Rate increases
- Positive FOMC in July

Dollar Index Bearish to $96 (UPDATE)I posted this DXY sell thesis yesterday for you all while price was still at $97.70. Since then sellers have taken out the previous Wave 3 low, creating a new daily low today at $96.90📉
We still have more downside yet to come towards our $96.60 target. So, use this 'DXY Sell Thesis' to help you with your trading, so once you can use this as a confluence to buy inverse correlated markets

DXY I AM MOVING TO 100 % LONG DXY WAVE 4 lowThe chart posted is my view of the DXY I am as bullish now as I was at 71 .Best of TRADES WAVETIMER 96.70 to 97.6

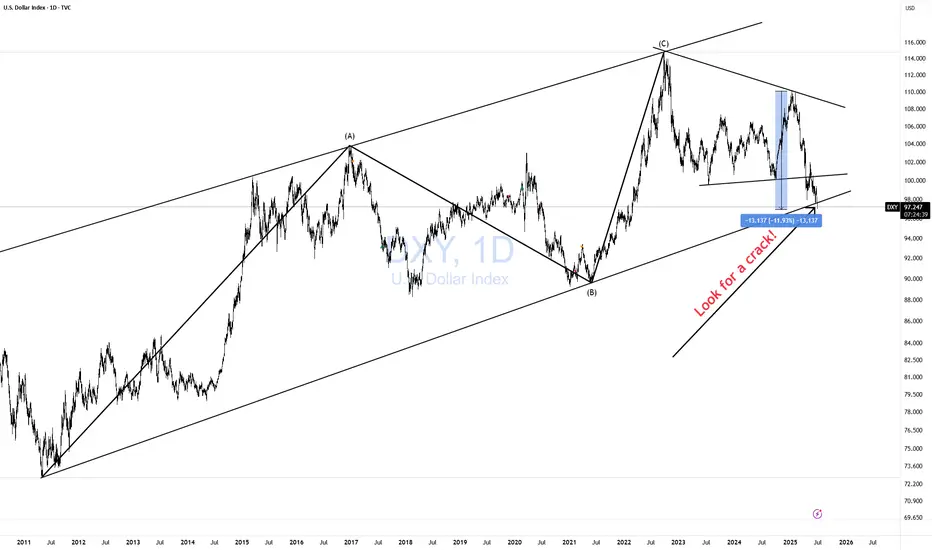
DXY CRACK! BAD JUJU!After Trump unilaterally imposed Tariffs (Taxes) on its citizens to buy imported goods from the rest of the world, promising 90 deals in 90 days, "in two weeks", the demand for the dollar payment system has collapsed by -12% reducing purchasing power for all $ holders'.
Imports of goods mean exporting $s to the rest of the world. As a world reserve currency (WRC), the US gets the benefit of seeing those $s invested back into the US. That creates demand for the $ payment system, and raises $ holders' purchasing power, reducing inflation.
What else happens? A bit complicated but I will try to explain. High demand for $ means the US indirectly exports inflation. Meaning, more $ for the same amount of goods and services. However, as a WRC, the US is not really exporting inflation. That is a bit inaccurate bc the US payment system as a WRC is actually includes a lot more goods and services from the entire planet. This makes sense if you think about it. However only going one way, meaning as long as the demand from the world for our payment system, more $ required by the world reflect more goods and services. As such not inflationary.
Now let's reverse it so you can see why it is not entirely accurate. Should the Global Economy (which is worth today about $100 trillion,) demand ever drop off. The $ value will collapse as people sell their $ holdings in exchange for other currencies. What you are seeing right now in this chart with a CRACK in it.
The US GDP is currently about $30 trillion. There is no way! A $ payment system designed for a $100T economy can suddenly absorb all those $ in a $30T economy. Inflation would skyrocket as more and more $ chase the same amount of goods and services ($30T). This is not rocket science. This is basic 3rd-grade arithmetic!
This CRACK! could be very bad JUJU!
CAUTION is in order. Don't let normality bias fool you. No matter how you feel about Trump. It is irrelevant to basic arithmetic.