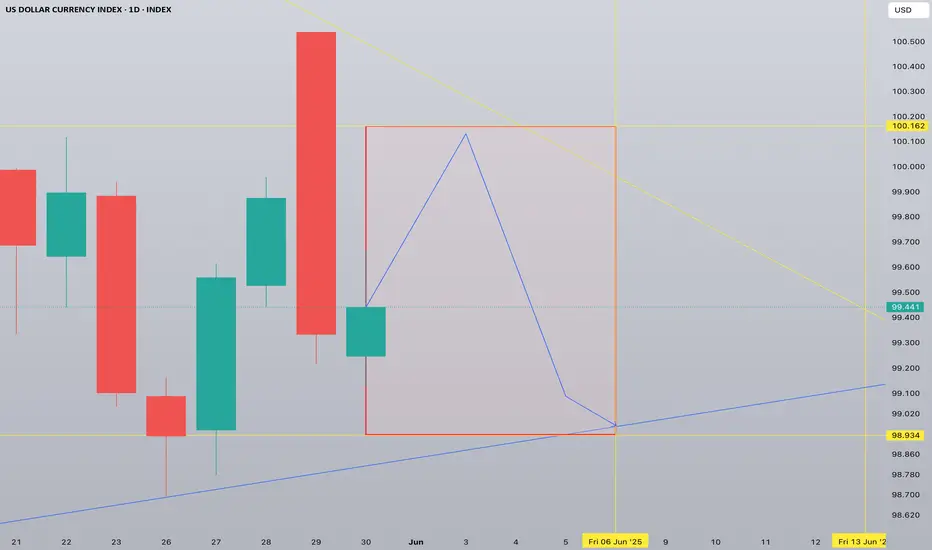
Weekly 1D chart DXY forecastMore of sideways movement. We may see a flash rise to 100 turning a fakeout followed by a fall to 98.93
Not enough strength to go up
DXY
DXY Short-Term Reversal Zone in SightUS Dollar Index (DXY) is approaching a strong support zone at 98.90–98.00, which has historically acted as a base for bullish reversals. The price is now testing the lower bound of this zone after a steady downtrend from the 101.94 high.
Key Technical Structure:
Support Zone: 98.90–98.00 (tested 3+ times)
Double Bottom Potential forming if bulls hold the zone
Upside Targets:
101.94: Key horizontal resistance
103.50: Swing high from early April
Scenarios to Watch:
🔹 Bullish Rebound:
Price bounces off 98.90–98.00 support
Confirmation: Break and close above 100.50 near-term resistance
Could fuel move back to 101.94, possibly 103.50
🔹 Bearish Breakdown:
Daily close below 98.00 would invalidate bullish setup
Opens downside to 97.00 and even 95.50
Macro Drivers to Watch:
FOMC speakers and interest rate guidance
US jobless claims or inflation surprise
Risk-off sentiment (benefits USD) vs. continued global risk appetite
Conclusion:
DXY is trading at a make-or-break support zone. Watch for clear bullish reaction or bearish breakdown before committing. The setup favors a bounce unless 98.00 fails.

DXY Update..PWL takenGood day traders I’m back yet again with another update but this this it’s DXY(dollarindex)).
Price has taken previous week’s low, and for me that’s the manipulation phase in the power of 3 because my bias is bullish on the dollar and bearish on foreign currencies. Price has taken the PWL in a zone/area where we saw price react higher in that BPR zone/area. For the rest of the week I personally believe we can expect higher prices on DXY, Atleast till the midpoint of that gap above price. ICT teaches more on the importance of that halfway/midpoint of gaps and other PD arrays.
Since we are in a discount zone we can expect price to move higher into the premium range of the daily TF dealing range and our first liquidity (internal) is also inside the premium zone.

XAUUSD - Gold is on the verge of a very important week!Gold is trading above the EMA200 and EMA50 on the four-hour timeframe and is trading in its ascending channel. I predict the path ahead for gold to be upward and if the resistance level is broken, we can look for buying opportunities. If gold corrects, we can also buy it with a reward at an appropriate risk.
Gold prices experienced a mild decline over the past week, with market sentiment shaped less by fundamental shifts and more by mixed messages and scattered commentary around tariffs.Despite the noise, many traders chose to rely on data and technical charts rather than reacting emotionally—data that painted a more subdued picture than the headlines suggested.
Rich Checkan, CEO of Asset Strategies International, responded confidently in a recent survey, predicting further gains in gold. “The trajectory for gold is clearly upward. Prices have stabilized around the $3,300 level and appear ready for a new rally, especially if the appellate court’s ruling on tariffs is upheld,” he said.
Checkan also pointed to another macroeconomic factor that could support gold: “A new tax bill, described as large and costly, is set to be voted on in the Senate soon. If passed, it will likely widen the budget deficit, which historically leads to increased liquidity and rising inflation—a favorable environment for gold.”
On Friday, the PCE inflation report showed easing price pressures, though not enough to put the Federal Reserve at ease. Core PCE (excluding food and energy) rose by 0.1% month-over-month and 2.5% year-over-year in April—matching expectations and slightly down from 2.7% the previous month. The headline PCE also increased 2.1% annually, just below the forecast of 2.2%.
The key point: these data reflect the first month in which Trump’s new tariffs were active, yet there’s little evidence so far that they’ve caused inflation to rise. Still, the disinflationary trend remains sluggish and distant from the Fed’s 2% target. In its latest minutes, the Fed warned that inflation may prove more persistent than previously thought.
Nick Timiraos of The Wall Street Journal, despite the seemingly positive PCE numbers, issued a cautionary note with four key insights:
• The inflationary impact of tariffs is expected to begin showing up from May and be fully reflected in June’s data. This could accelerate goods price increases and disrupt the path of disinflation.
• Last year’s monthly PCE figures were particularly weak (May: 0%, June: 0.1%, July: 0.2%). As these drop out of the annual calculation, even if monthly gains remain steady, YoY rates could rise mathematically.
• The three-month average for Core PCE from May to October 2024 was only 0.1%. If upcoming monthly figures hit 0.2%, annual disinflation could stall or even reverse.
• While the latest report is encouraging, the effects of tariffs and the removal of last year’s weak data could complicate the inflation trajectory.
Looking ahead, market attention will focus heavily on a suite of crucial U.S. labor market indicators. The Job Openings and Labor Turnover Survey (JOLTS) is due Tuesday, private sector employment data (ADP) on Wednesday, and jobless claims on Thursday. However, the most anticipated release will be Friday’s Non-Farm Payrolls (NFP) report for May—widely viewed as a key factor influencing rate expectations.
Alongside labor data, markets will also watch other critical economic reports. The ISM Manufacturing PMI on Monday and the ISM Services PMI on Wednesday will offer broader insight into U.S. business activity. In the realm of monetary policy, interest rate decisions from the Bank of Canada (Wednesday) and the European Central Bank (Thursday) are expected to trigger notable movements in the currency and gold markets.

Bitcoin - Will Bitcoin reach $120,000?!Bitcoin is in its short-term descending channel on the four-hour timeframe, between the EMA50 and EMA200. Personally, I would look to sell Bitcoin at a target of $100,000. Either from the channel ceiling or after an invalid breakout of the specified channel. If this corrective move occurs, Bitcoin buying opportunities can be sought within the demand zone.
It should be noted that there is a possibility of heavy fluctuations and shadows due to the movement of whales in the market, and capital management in the cryptocurrency market will be more important. If the downward trend continues, we can buy within the demand range.
The Bitcoin 2025 Conference, widely regarded as the largest global event dedicated to Bitcoin and blockchain technology, took place from May 27 to 29 at the Venetian Convention Center in Las Vegas, Nevada. First launched in 2019 and held annually since, the conference has become the central meeting point for Bitcoin enthusiasts and professionals, offering a platform for knowledge exchange, ideation, and innovation within the Bitcoin ecosystem. With over 30,000 attendees, 400 speakers, and participation from around 5,000 companies, this year’s event played a significant role in advancing the global adoption of Bitcoin—often referred to as “hyperbitcoinization.”
The 2025 edition covered not only technical subjects such as Layer 2 scaling solutions and privacy enhancements, but also broader themes like institutional adoption, strategic Bitcoin reserves, and its implications for financial freedom on a global scale.From an economic perspective, there was a strong emphasis on Bitcoin’s role as a store of value amid inflationary pressures and unstable monetary policies. Forecasts presented by key figures such as Michael Saylor and Paolo Ardoino pointed to Bitcoin’s potential to emerge as a foundational asset within global financial systems. These projections were further supported by the expansion of the M2 money supply in 2024 and expectations for continued growth into 2025.
In addition to highlighting opportunities, the event also addressed the challenges facing Bitcoin. One major concern was the lack of clear legal and regulatory frameworks in certain countries—a topic addressed by Caitlin Long and other speakers. Such regulatory uncertainty could hinder broader Bitcoin adoption. Moreover, Bitcoin’s price volatility—highlighted by a 3.4% decline in the weeks leading up to the conference—raised questions about the market’s long-term stability.
Meanwhile, Coinbase reported that the repayment of debts related to the bankrupt FTX exchange could act as a $5 billion liquidity injection into the crypto market. This development is expected to boost capital inflows and potentially draw major institutional players back into the space.
According to Coinbase, as of May 30, the “FTX Recovery Trust” has begun its second phase of repayments, distributing over $5 billion in stablecoins to creditors. These payouts are being processed over three days via the BitGo and Kraken platforms. Unlike the first round in February, this phase involves only stablecoin disbursements rather than a mix of crypto and cash—enabling recipients to reinvest their funds more quickly and efficiently.
Additionally, U.S.-based companies currently hold 94.8% of all Bitcoin owned by publicly traded firms. The U.S. also commands 36% of the global Bitcoin hash rate, underscoring its dominance in mining activities. So far, 36 U.S. states have enacted pro-Bitcoin legislation, signaling a growing legal endorsement of the cryptocurrency across the country. This level of concentration—in ownership, regulatory leadership, and mining capacity—could position the U.S. to play a more decisive role in shaping future global Bitcoin regulations.

Gold Looks Bullish. But need more confirmation! Looking for more supporting signs that gold is ready to go bullish. I think it will pull back first. But waiting to see where price is at inside of the killzone before making any decision on direction. Being that it is Monday price could end up acting flaky on action. So keeping expectations low.

DXY Under Pressure: Breakdown Incoming Below 99.00?After testing the 102 resistance zone in mid-May, the TVC:DXY resumed its downward move, dropping back into the 98.50–99.00 support zone.
The brief spike above the psychological 100 was quickly rejected, and price has since rolled over — currently trading around 99.27 at the time of posting.
🔻 The downside pressure is strong, and a break below support looks imminent.
If that break occurs:
🎯 Short-term target: 98 (approx. 1% drop)
📉 Medium-term potential: A deeper decline toward 95

Gold 1H Intra-Day Chart 02.06.2025Huge push up on Gold on market open due to Russia - Ukraine war tension.
Option 1: Gold rejects from CMP and drops lower towards $3,270.
Option 2: If Gold closes bullish above $3,330 then $3,370 is the next major bullish target.
Which scenario do you find more likely?

$BTC 12-Week Lead Correlation w/ Global Liquidity, M2, GOLD, DXYHere’s a look at Bitcoin's price action against Global Liquidity, Global M2, GOLD and DXY - all with a 12-Week Lead.
Notice GOLD has a bit more of a deviation from the BTC price than the others.
This is because GOLD is used as a store of value asset, whereas the others are predicated on Central Banks expanding and contracting their money supply and balance sheets.
The key here is to smooth out the signal and ignore the noise.
Notice the convergence between these metrics the past couple months.

Natural Gas | Oil | Dollar | Silver | Gold Price ForecastNatural Gas | Oil | Dollar | Silver | Gold Price Forecast
NYMEX:NG1! NYMEX:CL1! COMEX:GC1! COMEX:SI1!

DXY Analysis today : Possible reversal?With strong liquidity grab at 99.00 DXY, with monthly rejection to the upside, past week we have seen with gap open the market started to drop long term support level 99.000 which smart money zone price has got bounce back to the upside with strong momentum potentially forming a double bottom with series of higher low price may continue to move up to the 100.75 to long term monthly resistance with NFP we may see further rejection down again.
A bullish on support is high probability !

EURUSDHello Traders! 👋
What are your thoughts on EURUSD?
EURUSD is still trading below a key resistance zone, showing signs of weakness and lack of strong bullish momentum. At this stage, it seems unlikely that the pair will break above the resistance in the short term.
We expect a downward correction toward the specified support levels, before any potential resumption of the uptrend.
Despite short-term weakness, our long-term outlook remains bullish, and this pullback could offer a better entry opportunity in line with the broader trend.
Don’t forget to like and share your thoughts in the comments! ❤️

1. "What do you think — is DXY ready to fly or fall?"DXY 4H Analysis – Decision Time for the Dollar?
After completing a falling wedge with a clean 5-wave Elliott structure, the U.S. Dollar Index is approaching a key demand zone.
Will buyers step in to push price toward the bullish target near 106 📈?
Or will we see another rejection from the supply zone and a deeper drop to 94? 📉
Wave A or Wave B?
Market structure shows signs of reversal, but confirmation is still pending a break of resistance or further rejection.
👉 What do you think — bounce or breakdown?
Comment your view below ⬇️
Let’s see who’s riding the next big wave 🌊
#DXY #USD #ElliottWave #SupplyAndDemand #GreenFireForex #ForexAnalysis #WaveTheory

DXY 4H Breakout? Bulls Eye Momentum Shift!Hey There;
The U.S. Dollar Index (DXY) appears to have reached a critical turning point from a technical analysis perspective. According to Elliott Wave Theory, following a five-wave downtrend, the AB corrective wave has been completed, and a bullish movement towards the C wave is emerging. This scenario could signal a transition from a bearish market to a bullish one.
Technical Outlook:
- A move towards 104.460 on the DXY may indicate that the market is entering a strong recovery phase.
- The completion of the AB corrective wave suggests that buyers are stepping in, driving upward momentum in price action.
- The C wave typically retraces a portion of the prior decline, creating potential for a higher price level.
Macroeconomic Factors:
- U.S. monetary policy and inflation data remain key determinants of the dollar index’s trajectory.
- Increased global risk appetite may bolster the dollar’s appeal as a safe-haven asset.
- U.S. Treasury yields could provide additional support for DXY’s upward movement.
If DXY successfully reaches 104.460, this could confirm a shift into a bullish trend. However, the strength and sustainability of the C wave will depend on supportive volume and momentum indicators. The interplay between technical and fundamental factors could drive a solid recovery in the dollar index.
Should this scenario unfold, it may mark the beginning of a renewed period of dollar strength against global currencies. However, market dynamics and macroeconomic developments must be monitored closely to validate this outlook.
Guys, every single like from you is my biggest source of motivation when it comes to sharing my analysis.
A huge thank you to everyone who supports me with their likes!

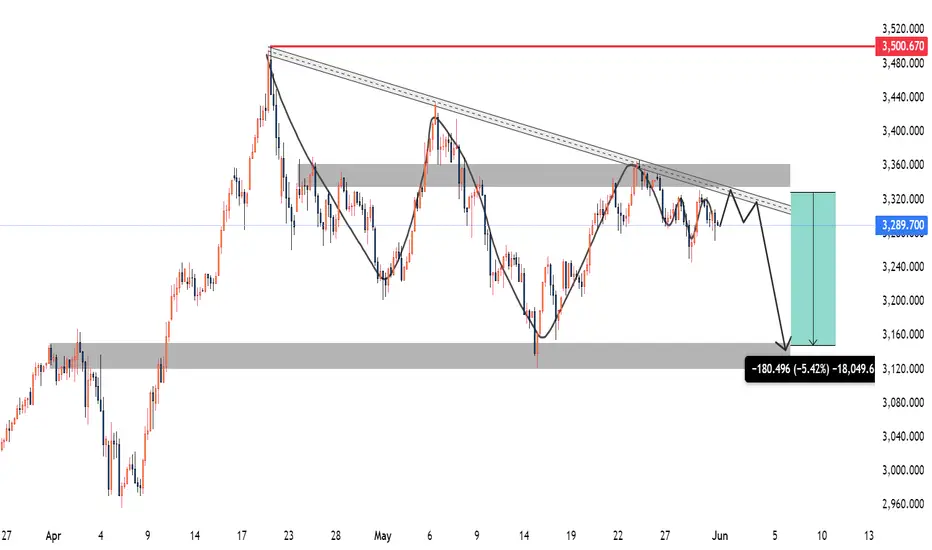
Gold XAUUSD Weekly forecast 2-6 June 2025Observations:
Price has been respecting a clear descending trendline since late April, with multiple touches and rejections.
A significant supply zone around the 3,330 level aligns with the trendline resistance, increasing confluence for a potential reversal.
The market has formed lower highs consistently, suggesting bearish pressure is building up.
A horizontal demand/support level around 3,125 (previous swing low) is the primary target in case of a bearish breakout.
Volume and structure suggest distribution, further supporting bearish continuation.
Bearish Scenario:
If the price retests and rejects the 3,330 resistance level again next week, especially with a wick rejection or bearish engulfing candle:
Expect downside continuation toward 3,125, aligning with a ~1500 pip target.
This move would represent a ~5% drop from current levels.
Trading Plan / Signal:
Sell Setup:
Entry Zone: Between 3,320 – 3,330 (upon bearish confirmation e.g., bearish engulfing or shooting star)
Stop Loss: Above 3,350 (just above trendline and invalidation zone)
Take Profit 1 (TP1): 3,250
Take Profit 2 (TP2): 3,200
Take Profit 3 (TP3): 3,150/25
Risk–Reward Ratio: Approximately 1:3+
Invalidation:
Clean breakout and retest above 3,350 would invalidate the setup and may suggest a reversal toward 3,500.
Fundamental Consideration:
No major geopolitical or macroeconomic shocks should occur to maintain this bearish bias. Any high-impact news could cause volatility, so monitor the economic calendar closely.
Please follow, like, comment and share.
USDJPY 4H Analysis – Market Dynamics ChangingDear Traders,
Guys, the bearish trend in USDJPY has now shifted into a bullish uptrend. My target level for USDJPY is 146.330. Once it reaches my target, I will share updates under this post.
Friends, every single like from you is my biggest source of motivation when it comes to sharing my analysis.
A huge thank you to everyone who supports me with their likes!

Final BTCUSD update..Good day traders, here is my final update on BTCUSD and I like how price has been respecting our PD arrays. Keep in mind traders price moving in waves and what again😂😂🏃🏾♂️, point is today is the last trading day for the week and my thoughts is that we can expect BTCUSD to start going higher today and tomorrow maybe till Tuesday …sorry I’m being too sure but if you focus on time and price you start to KNOW(ledge) things or maybe I should say secrets?!🤨🤔
I always expect price to manipulate higher if my bias is shorts, ICT’s power of 3 works wonders when it come to this thought process.
Watch how price reacts to the FVG where price is trading now, it’s not a signal just watch out price moves always from it for the rest of today.
We only going high to shoot lower…keep that in mind!!🤯

ETH on high time frame
"Hello traders, focusing on ETH, the price is currently at a critical level around $2,800, where it has made multiple unsuccessful attempts to break through. On the high time frames, the price has swept liquidity without showing any signs of reversal. This leads me to anticipate a higher price movement, with the next potential level being around $3,400."
If you need further assistance or have any specific questions, feel free to let me know!

$USPCEPIMC -U.S Core PCE (April/2025)ECONOMICS:USPCEPIMC
April/2025
source: U.S. Bureau of Economic Analysis
-The core PCE price index in the US, which excludes volatile and energy prices and is Federal Reserve's chosen gauge of underlying inflation in the US economy,
went up 0.1% from the previous month in April of 2025.
The result was in line with market expectations.
From the previous year, the index rose by 2.5% to slow from the 2.7% jump from March, the softest increase since March of 2021.

GBPJPY update!!Good day traders, I’m back with yet another beautiful setup on GJ and I really wish we can all monitor how price plays out and learn more about price signature.
For this setup I’ll explain more about it after the fact because it’ll help me make my point clearer and easily understandable.
Yet another gift..🎁🧧

Bullish USDJPY The video is self-explanatory.
UJ failing to break a strong weekly and daily support zone, which increases the probability of a bullish trend for the next days or weeks.

BTC on high time frame
"Hello traders, focusing on BTC on high time frames, the $102,000 level (referred to as the vector level) is crucial for price action. If the price convincingly breaches and closes below this level on the 4-hour or higher time frames, it suggests a potential move to the downside.
However, if the price merely sweeps liquidity and forms shadows on the high time frames without closing below the critical level, it indicates the potential for further upward momentum towards new higher highs."
If you have any more details to add or need further assistance, feel free to let me know!

GOLD - WAVE 4 CORRECTION TO $2,800 (UPDATE)Gold has once again rejected the 0.618 Fib level & dropped back into the lower bound of the range zone overnight, which is what we like to see.
But overall, we remain within the range so we exercise patience & keep an eye out for any possible alternatives which might happen for Gold. Nice profits for us either way.
