GOLD - WAVE 4 CORRECTION TO $2,800 (UPDATE)After hitting both of our buying targets of $3,274 & $3,318, Gold pushed a little higher than expected. But price came back down again & is following our sell bias very nicely!
With Wave B now supposedly complete, Wave C bearish momentum can now continue down. Gold has been extremely bearish since the start of this week.
DXY

the trap has layerswhat if i told you the dxy was not done yet,
what if i told you, there was 1 more push up,
1 more test before it truly breaks and starts a bull market.
what if i told you that on that final test, that final push up,
the crypto market breaks and takes everything.
---
you probably wouldn't believe me.
---
looking at the dxy as a simple zig-zag with a complex flat in the b-wave.
once wave b is completed, at about 110-111,
i predict it drops down, deep
and while it drops,
it triggers alt season.
🌙

DXY OUTLOOK BEFORE FOMC | Will the Dollar Break Trend DXY OUTLOOK BEFORE FOMC | Will the Dollar Break Trend or Just Retrace?
The US Dollar Index (DXY) has rebounded after weeks of relentless selling pressure, but this bounce is now approaching key decision zones just ahead of two critical events: the April PCE report and the next FOMC meeting. With macro data and sentiment diverging, traders should closely monitor how the dollar reacts to upcoming catalysts.
🌍 MACRO & FUNDAMENTAL CONTEXT
Core PCE Price Index (Apr) – due Friday – is the Fed’s preferred inflation gauge. A higher-than-expected print may reinforce the “higher for longer” stance on rates.
FOMC Minutes revealed a growing divide within the committee: some members remain open to further tightening if inflation stalls.
Bond market stress is emerging again, as 10Y yields hover near 4.5%. Fiscal concerns and treasury auctions are weighing on investor sentiment.
Political noise – particularly from former President Trump’s shifting tariff threats – adds short-term volatility to USD expectations.
🧠 Bottom line: While the dollar has regained ground, macro risks remain asymmetric. A hot PCE may spark short-term demand for USD, but structural credibility risks are still on the table.
📊 TECHNICAL INSIGHT – H1 STRUCTURE
Price Channel: DXY broke slightly above a well-respected descending channel that started mid-May.
EMA Confluence: EMA 13, 34, and 89 are beginning to align upward but haven’t fully confirmed a bullish trend yet.
Key Retest Zone: 99.08 is a critical zone — a Fibonacci 38.2% level of the recent breakout. A hold here may support another test higher.
🔑 KEY TECHNICAL LEVELS
Immediate Support: 99.08 (Fib 38.2% + channel retest)
Mid Resistance: 100.02 (round number + previous structure high + near 200 EMA)
Major Target Zone: 100.48 (Fib 61.8% + multi-day pivot)
📈 POTENTIAL PRICE SCENARIOS
If DXY respects 99.08, a continuation toward 100.02 and even 100.48 is plausible as a technical correction.
If DXY fails to hold 99.08, the breakout above the trend channel may turn into a false break, opening the door for a re-test of lower channel support near 98.30.
Watch for price behavior around 100.02 — aggressive sellers may re-enter at this level, especially if macro data disappoints.
⚠️ STRATEGIC REMINDER
Avoid chasing mid-range price action.
Let the market reveal its hand post-PCE.
Volatility is expected to spike — be patient and let key levels define directional conviction.

AudCad..PWL taken!!Good day traders, I’m back with another setup on AudCad and I like that previous week low was taken. We can now look at the power of 3 with higher TF in mind.
On the 4H TF price has been bearish but we can see that price left very “smooth” highs(relative equal highs) but ICT teaches us that price will always go back to make the smooth highs, smooth cries(liquidity sweep).
Before price took our low it left a FVG that’s we wanna see turn into an inverse.
The first target has to be our internal liquidity than the external liquidity that also has relatively equal highs too.

EUR/USD Holds Above 16-Year ChannelThe U.S. dollar, pressured by debt concerns, has declined toward critical 2025 lows near the 98 level. Meanwhile, the euro has stabilized near 1.1380, now trading above the upper boundary of a 16-year descending channel originating from the 2008 peak and extending through 2024.
This breakout positions EUR/USD for a potential long-term bullish move—provided the DXY confirms further downside. A firm monthly close above 1.16 would confirm the breakout, setting sights on highs from 2018 and 2021, between 1.20 and 1.24.
On the downside, key pullback levels are 1.1270, 1.1140, and 1.1070. A break below those could extend pressure toward 1.0990 and 1.0890.
- Razan Hilal, CMT

Gold looks like it wants to go higher. We might need to wait. Waiting for more confirmation on what direction price wants to go in. Now that we are past the holiday more volatility should come back. Just waiting for it to confirm a direction first before getting active.

GBPAUD…being the best is a mindset!!Good day traders, I am back again with another great setup and again another opportunity to learn something new.
On the daily TF on GBpAUD we still in a bearish structure and if we use the 2022 model, we had a structure shift lower and now that price is retesting the OTE entry levels we can now expect price to shoot lower, before you asked about the recent FVG on 4H TF. That newly formed BISI is that candle that created the BPR and from what I’ve learned is that price normally shoots past BPR’s.
My poll of liquidity is resting below(weekly), that Ray line makes weekly represents previous week’s low which we want to see the market get to. Just on top of that ray line we have a FVG that price left open, we also wanna see price fill that FVG fully.

$US10Y and $DXY Divergence and correlation breakdownRecent weeks we might have missed some underlying churn in the market dynamics. Recently there has been a clear visible divergence in TVC:US10Y and TVC:DXY in midst of all the noise about the tariffs. Usually with rising TVC:US10Y yield the US Dollar index TVC:DXY rises with it as visible in the chart below. In this blog we have been following the downward slopping channel in the TVC:US10Y and the yield has remained within this tight range of the channel. In our last blog on 02 May 25 we called for a lower TVC:US10Y @ 4%. Seems that call was incorrect and I was wrong. But in this space, we have been asking for a lower $DXY. The TVC:DXY chart is making lower highs and lower lows and in a verge of a breakdown.
So we have higher TVC:US10Y which is capped to the upside @ 4.6% visible from the upper end of the downward slopping channel and we have TVC:DXY making lower lows but the correlation is broken in the recent weeks as shown in the daily chart below. This kind of unpredictable market behavior it’s difficult to forecast equity market direction. TVC:US10Y seems to create headwind for equities but the lower TVC:DXY is good for risk assets like CRYPTOCAP:BTC , SP:SPX and $QQQ. Hence this push and pull will keep the markets range bound for now.
Verdict : TVC:US10Y currently at top of the range, downside more likely ; TVC:DXY continues to struggle and in penalty box.

DXY: Move Down Expected! Short!
My dear friends,
Today we will analyse DXY together☺️
The recent price action suggests a shift in mid-term momentum. A break below the current local range around 98.579 will confirm the new direction downwards with the target being the next key level of 98.459 and a reconvened placement of a stop-loss beyond the range.
❤️Sending you lots of Love and Hugs❤️

Gold H4 Technical update and key levels bulls/bears📊 Technical Outlook Update H4
🏆 Bull Market Overview
▪️stuck in range for now
▪️overhead resistances will limit upside
▪️Bears key S/R: 3410/3460 USD
▪️Bulls key S/R: 3160/3240 USD
▪️Expect range price action
▪️Focus on selling high / buying low
▪️volatility likely to remain low
▪️next few weeks as no major headlines
⭐️Recommended strategy
▪️short high and buy low
▪️detailed price levels above
▪️right now no trade recommended
Latest gold market updates:
📈 Gold surges as renewed tariff threats and geopolitical tensions drive safe-haven demand.
💳 Fiscal concerns escalate after the U.S. credit rating is downgraded, increasing investor interest in gold.
📊 Analysts identify $3,300 as a crucial support level, with strong buying interest keeping prices elevated.
🔮 Major banks project gold to surpass $4,000 per ounce within the next year, citing robust demand from both investors and central banks.
💍 Record gold prices prompt jewelry designers to shift toward 14-karat gold and alternative materials to control costs.
📉 Gold jewelry demand in India continues to decline due to high prices, while investment gold purchases rise.
🌍 Central banks, especially in emerging markets, sustain gold purchases to hedge against currency volatility and inflation.
🛡 Gold maintains key support above $3,200 despite market volatility and profit-taking pressures.
📈 Leading investment banks remain bullish, forecasting significant upside for gold through year-end.
💰 Gold is currently trading near $3,358 per ounce, reflecting ongoing volatility and global economic uncertainty.

26.05.25 Morning ForecastPairs on Watch -
FOREXCOM:COFFEE
FX:GBPAUD
FX:EURAUD
A short overview of the instruments I am looking at for today, multi-timeframe analysis down to what I will be looking at for an entry. Enjoy!

Does Gold want to continue Bullish to close out the Month?Looking for more bullish plays but Im thinking we need to allow Monday to play out and wait for the better move on Tues. Be cautious today.

Natural Gas | Oil | Dollar | Silver | Gold Price ForecastNatural Gas | Oil | Dollar | Silver | Gold Price Forecast
COMEX:GC1! COMEX:SI1! TVC:DXY NYMEX:CL1!

BEARS STILL IN CHARGE ! DXY- USD INDEX FORECAST Q2 W22 Y25DXY USD INDEX FORECAST Q2 W22 Y25
BEARS CRUSHING THE USD!
Professional Risk Managers 👋
Welcome back to another FRGNT chart update📈
Diving into some Forex setups using predominantly higher time frame order blocks alongside confirmation breaks of structure.
✅ U.S. dollar index is a measure of the value of the dollar against a basket of six foreign currencies.
✅The currencies are the Euro, Swiss franc, Japanese yen, Canadian dollar, British pound, and Swedish krona.
🔑 Remember, to participate in trading comes always with a degree of risk, therefore as professional risk managers it remains vital that we stick to our risk management plan as well as our trading strategies.
Pairs to look out for -
EURUSD - BUY
USDCHF - SELL
USDJPY - SELL
USDCAD - SELL
GBPUSD - BUY
- Perhaps it's time to accept that a recovery in the DXY is not occurring anytime soon...
📈The rest, we leave to the balance of probabilities.
💡Fail to plan. Plan to fail.
🏆It has always been that simple.
❤️Good luck with your trading journey, I shall see you at the very top.
🎯Trade consistent, FRGNT X

Market Analysis For DXY: Week of May 26thFurther downside momentum looks like a strong possibility this week with liquidity and imbalances resting in short-term zones.

Bitcoin 97k??(USD gaining strength)Good day traders, I’m back again with this beauty of a setup on BTCUSD, first things first on the daily TF price created a balanced price confirming our Thursday’s high as the high of the week.
On the 4H TF and this is where my focus is at, on the chart you can clearly see the levels that I would like to see price reaching to. The first one is my 4 hour FVG that I would like to see price leave open because of the second rectangle(1H BPR), to see how I came about this hourly balanced price range, you can just jump to the hourly and try to see how I got to that BPR for educational reward.
On the hourly if we take a closer look, we see that the 4H FVG and the 1 hour FVG are on top of each other again that’s a confirmation to consider. Back on this TF what I’m expecting to see is price try and fail getting to that 4H FVG and than shoot lower to our relative lows.

Weekly FOREX Forecast: USD Weakness Continues. Buy The Majors!This is the FOREX futures outlook for the week of May 25 - 31st..
In this video, we will analyze the following FX markets:
USD Index EUR GBP AUD NZD CAD CHF JPY
USD Index has been bearish for weeks. Expect that to continue as Trump threatens EUR and Apple with tariffs.
Buying against the USD is the best bet. Notice the other major currencies charts are showing bullish price action in the form of Bullish Flags or prices nearing buy side liquidity.
Run with the bulls!
Enjoy!
May profits be upon you.
Leave any questions or comments in the comment section.
I appreciate any feedback from my viewers!
Like and/or subscribe if you want more accurate analysis.
Thank you so much!
Disclaimer:
I do not provide personal investment advice and I am not a qualified licensed investment advisor.
All information found here, including any ideas, opinions, views, predictions, forecasts, commentaries, suggestions, expressed or implied herein, are for informational, entertainment or educational purposes only and should not be construed as personal investment advice. While the information provided is believed to be accurate, it may include errors or inaccuracies.
I will not and cannot be held liable for any actions you take as a result of anything you read here.
Conduct your own due diligence, or consult a licensed financial advisor or broker before making any and all investment decisions. Any investments, trades, speculations, or decisions made on the basis of any information found on this channel, expressed or implied herein, are committed at your own risk, financial or otherwise.

"DXY Dollar Index" Market Bullish Heist Plan (Day/Swing Trade)🌟Hi! Hola! Ola! Bonjour! Hallo! Marhaba!🌟
Dear Money Makers & Robbers, 🤑 💰💸✈️
Based on 🔥Thief Trading style technical and fundamental analysis🔥, here is our master plan to heist the "DXY Dollar Index" Bank Heist. Please adhere to the strategy I've outlined in the chart, which emphasizes long entry. Our aim is to escape near the high-risk ATR Line Zone. It's a Risky level, overbought market, consolidation, trend reversal, trap at the level where traders and bearish robbers are stronger. 🏆💸"Take profit and treat yourself, traders. You deserve it!💪🏆🎉
Entry 📈 : "The heist is on! Wait for the Crossing previous high (100.400) then make your move - Bullish profits await!"
however I advise to Place Buy stop orders above the Moving average (or) Place buy limit orders within a 15 or 30 minute timeframe most recent or swing, low or high level for Pullback entries.
📌I strongly advise you to set an "alert (Alarm)" on your chart so you can see when the breakout entry occurs.
Stop Loss 🛑: "🔊 Yo, listen up! 🗣️ If you're lookin' to get in on a buy stop order, don't even think about settin' that stop loss till after the breakout 🚀. You feel me? Now, if you're smart, you'll place that stop loss where I told you to 📍, but if you're a rebel, you can put it wherever you like 🤪 - just don't say I didn't warn you ⚠️. You're playin' with fire 🔥, and it's your risk, not mine 👊."
📍 Thief SL placed at the nearest/swing low level Using the 2H timeframe (99.000) Day/swing trade basis.
📍 SL is based on your risk of the trade, lot size and how many multiple orders you have to take.
🏴☠️Target 🎯: 102.300
🧲Scalpers, take note 👀 : only scalp on the Long side. If you have a lot of money, you can go straight away; if not, you can join swing traders and carry out the robbery plan. Use trailing SL to safeguard your money 💰.
💰💵💸"DXY Dollar Index" Bank Money Heist Plan is currently experiencing a bullishness,., driven by several key factors. .☝☝☝
📰🗞️Get & Read the Fundamental, Macro Economics, COT Report, Geopolitical and News Analysis, Sentimental Outlook, Intermarket Analysis, Index-Specific Analysis, Future trend targets with Overall outlook score... go ahead to check 👉👉👉🔗🔗🌎🌏🗺
⚠️Trading Alert : News Releases and Position Management 📰🗞️🚫🚏
As a reminder, news releases can have a significant impact on market prices and volatility. To minimize potential losses and protect your running positions,
we recommend the following:
Avoid taking new trades during news releases
Use trailing stop-loss orders to protect your running positions and lock in profits
💖Supporting our robbery plan 💥Hit the Boost Button💥 will enable us to effortlessly make and steal money 💰💵. Boost the strength of our robbery team. Every day in this market make money with ease by using the Thief Trading Style.🏆💪🤝❤️🎉🚀
I'll see you soon with another heist plan, so stay tuned 🤑🐱👤🤗🤩

Japan's Bond Market Crisis: A Global WarningIntroduction: The Shattering of an Illusion
Japan’s government bond market, the world’s second-largest, has long been a cornerstone of global financial stability. With a debt-to-GDP ratio exceeding 260%, Japan’s fiscal structure has relied on a captive bond market, a compliant central bank, and a political system willing to defer fiscal reckoning. Yet, in May 2025, this delicately balanced system began to unravel. For two consecutive days, Japan’s 30-year and 40-year government bonds (JGBs) found no buyers, marking a historic collapse in confidence. The 20-year JGB auction recorded its weakest demand since 2012, with yields on 20-, 30-, and 40-year bonds soaring to multi-decade highs. This isn’t a minor market hiccup—it’s a structural breakdown with global implications.
This article explores the causes, consequences, and global ramifications of Japan’s bond market crisis, positioning it as a warning for other heavily indebted nations, particularly the United States. We’ll examine the Bank of Japan’s (BoJ) yield curve control (YCC) policy, the erosion of fiscal credibility, the unwinding of the yen carry trade, and the ripple effects on global bond markets, the US dollar, and gold as a safe-haven asset. By dissecting these dynamics, we aim to provide a comprehensive understanding of why Japan’s crisis matters and how it could foreshadow a broader sovereign debt reckoning.
The Anatomy of Japan’s Bond Market Breakdown
A Captive Market Unravels
Japan’s bond market has been a model of repression for decades. Domestic investors—pension funds, banks, and insurance companies—have been compelled to hold JGBs due to limited investment alternatives and cultural preferences for stability. The BoJ, holding 43.3% of JGBs as of January 2025, has underpinned this system through massive bond purchases, ensuring low yields even as debt ballooned to 1.35 quadrillion yen ($8.84 trillion).
However, this captive market is no longer captive. The May 2025 auctions revealed a stark reality: investors are recoiling. The 20-year JGB auction saw a bid-to-cover ratio—the measure of demand—plummet to its lowest since 2012, with the spread between investor bids and government offers (the “tail”) reaching its worst level since 1987. Yields on 20-year bonds hit 2.555% (highest since 2000), 30-year bonds reached 3.185% (a record since 1999), and 40-year bonds surged to 3.635% (an all-time high). These spikes reflect a market no longer willing to absorb Japan’s debt at suppressed yields.
The End of Yield Curve Control
The BoJ’s yield curve control (YCC) policy, introduced in 2016, capped 10-year JGB yields to maintain low borrowing costs. By purchasing bonds en masse, the BoJ suppressed volatility and ensured market liquidity. However, as inflation rose above the BoJ’s 2% target (reaching 3.6% overall CPI in 2025), the central bank began tapering its purchases, signaling a shift from ultra-loose policy.
This tapering has exposed the fragility of YCC. The long end of the yield curve—30- and 40-year bonds—is most sensitive to inflation and fiscal risk. As the BoJ steps back, market forces are driving yields higher, undermining the central bank’s control. The lack of buyers for super-long JGBs highlights a crisis of confidence in Japan’s fiscal sustainability, exacerbated by Prime Minister Shigeru Ishiba’s comparison of Japan’s fiscal state to Greece’s during its 2010 debt crisis.
Fiscal Recklessness and Political Inertia
Japan’s debt-to-GDP ratio, at 263%, is among the highest globally. Decades of deficit spending, fueled by quantitative easing and political reluctance to implement austerity, have created a fiscal powder keg. Calls for consumption tax cuts ahead of the July 2025 upper house election further erode investor trust, as they signal increased borrowing without structural reforms. Prime Minister Ishiba’s resistance to these cuts has done little to restore confidence, as markets demand a credible path to fiscal balance.
Global Implications: The Yen Carry Trade and Liquidity Shock
The Collapse of the Yen Carry Trade
The yen carry trade—borrowing in low-yielding yen to invest in higher-yielding foreign assets—has been a cornerstone of global liquidity since the 1990s. Japanese investors, seeking returns unavailable domestically, poured trillions into US Treasuries, emerging market bonds, and other assets. However, rising JGB yields are reversing this flow. As Japanese yields approach or exceed foreign yields (e.g., 30-year JGBs at 3.185% vs. US 30-year Treasuries at 5%), investors are repatriating capital, unwinding carry trades.
This unwinding is a global margin call. Emerging markets, reliant on Japanese capital, face sudden outflows, increasing FX volatility. The yen’s strengthening, as capital returns to Japan, disrupts global currency markets. In the US, the Treasury market—dependent on foreign buyers like Japan—faces pressure as Japanese institutions sell or reduce purchases of US bonds.
Echoes in the US Treasury Market
The US is not immune. A recent 20-year Treasury auction saw weak demand, with primary dealers absorbing 17% of issuance—a sign of desperation. The 30-year Treasury yield has climbed above 5.1%, reflecting rising borrowing costs. Moody’s downgrade of US debt to Aa1 from Aaa, citing a $36 trillion debt burden and unsustainable deficits, has amplified concerns.
President Trump’s proposed “One Big Beautiful Bill Act,” reviving 2017 tax cuts, is projected to add $3.3 trillion to US debt by 2034, pushing the debt-to-GDP ratio to 125%. With $9 trillion in US debt maturing within the next 12 months, the Treasury market faces a refinancing challenge of unprecedented scale. If foreign buyers, including Japanese institutions, step back, the US could face a structural demand breakdown, forcing higher yields and tightening financial conditions.
The Sovereign Debt Crisis Blueprint
Japan as the Fuse, US as the Bomb
Japan’s bond market crisis is a blueprint for what could unfold in the US. Both nations share structural vulnerabilities: high debt-to-GDP ratios, reliance on central bank intervention, and political dysfunction. Japan’s breakdown demonstrates that even a captive market can rebel when trust erodes. The BoJ’s loss of control over the yield curve mirrors potential risks for the Federal Reserve, which faces rising long-end yields despite its efforts to manage expectations.
The metaphor of Japan as the fuse and the US as the bomb is apt. Japan’s crisis is a warning shot, but the US—given its role as the world’s largest bond market ($51 trillion) and the dollar’s reserve currency status—represents a far larger systemic risk. A US debt crisis would disrupt global bond markets, equity valuations (e.g., the S&P 500’s recent wobble), and liquidity flows.
The Role of Bond Vigilantes
Bond vigilantes—investors who sell bonds to discipline profligate governments—are reawakening. In Japan, their absence from JGB auctions signals a rejection of fiscal recklessness. In the US, rising Treasury yields and weak auction demand suggest vigilantes are saddling up. Central banks’ ability to suppress yields is waning, exposing markets to the harsh reality of supply and demand.
The US Dollar and Gold: A Shifting Landscape
The Dollar’s Eroding Trust
The US dollar’s dominance is not immediately threatened—neither the euro nor the renminbi offers a viable alternative due to fragmentation and control, respectively. However, self-inflicted wounds—fiscal recklessness, political gridlock, and the dollar’s weaponization in trade disputes—are eroding trust. A structural breakdown in Treasury demand, driven by Japan’s repatriation or global risk repricing, could push US borrowing costs higher, weakening the dollar’s appeal.
Gold as a Judgment on Fiat
Gold is resurging as a safe-haven asset amid this turmoil. Unlike sovereign bonds, gold offers no coupon, no intervention, and no deficits—it simply exists. As trust in central banks and fiat currencies falters, gold’s appeal grows. Bitcoin, another scarce asset, has hit $107,322, reflecting similar dynamics, but gold’s historical stability and lack of counterparty risk make it a preferred hedge. Analysts like Stack Hodler argue that central bank credibility is “shattering in real time,” driving demand for gold and other neutral assets.
Conclusion: Preparing for the Exit
Japan’s bond market breakdown is not an isolated event—it’s a warning for the global financial system. The BoJ’s loss of yield curve control, the collapse of the yen carry trade, and the erosion of fiscal credibility signal the end of an era of sovereign bond repression. The US, with its ballooning debt and reliance on foreign buyers, is on a similar trajectory. As trust in central planning wanes, capital will flee to assets like gold, which stand outside the fiat system.
Investors must prepare an exit plan. Diversifying into gold, reducing exposure to long-dated bonds, and monitoring central bank actions are critical steps. Japan’s crisis is the fuse; the US could be the bomb. When trust in sovereign debt crumbles, the question isn’t whether the system will break—it’s how long until detonation.
References
Reuters: Japan's super-long bond yields soar to records as market frets about demand
IndraStra: From Safe Haven to Fault Line: How Japan’s Bond Crisis Threatens Global Markets
American Thinker: Bond Market Shock: Is a New Financial Crisis Looming?
Wikipedia: National debt of Japan
Wolf Street: Japan’s 30-Year and 40-Year Bonds Crater, Yields Spike
@onechancefreedm: Japan Is the Fuse. The U.S. Is the Bomb
@DarioCpx: The BOJ losing control of long-term JGB Yields

USD/JPY - H1 - Channel Breakout (17.05.2025) The Pair on the H1 timeframe presents a Potential Selling Opportunity due to a recent Formation of a Channel Breakout Pattern. This suggests a shift in momentum towards the downside in the coming hours.
Possible Short Trade:
Entry: Consider Entering A Short Position around Trendline Of The Pattern.
Target Levels:
1st Support – 142.40
2nd Support – 140.17
🎁 Please hit the like button and
🎁 Leave a comment to support for My Post !
Your likes and comments are incredibly motivating and will encourage me to share more analysis with you.
Best Regards, KABHI_TA_TRADING
Thank you.
Disclosure: I am part of Trade Nation's Influencer program and receive a monthly fee for using their TradingView charts in my analysis.

GBP/AUD - Bullish Channel (22.05.2025)The GBP/AUD pair on the M30 timeframe presents a Potential Buying Opportunity due to a recent Formation of a Channel Pattern. This suggests a shift in momentum towards the upside and a higher likelihood of further advances in the coming hours.
Possible Long Trade:
Entry: Consider Entering A Long Position around Trendline Of The Pattern.
Target Levels:
1st Resistance – 2.0961
2nd Resistance – 2.1047
🎁 Please hit the like button and
🎁 Leave a comment to support for My Post !
Your likes and comments are incredibly motivating and will encourage me to share more analysis with you.
Best Regards, KABHI_TA_TRADING
Thank you.
Disclosure: I am part of Trade Nation's Influencer program and receive a monthly fee for using their TradingView charts in my analysis.

Dollar Bottoming Out Pretty solid bottom for USD. I am assuming more money flowing into USD when a correction is about to happen. We see that this morning when we had that quick drop from 7:00 - 8:00 EST. US10Y rate dropping, USD rising, and equity declining. Back to the old game. So I am suggesting long USD, and short equities, given the recent comeback is way too ridiculous and needs a correction now.

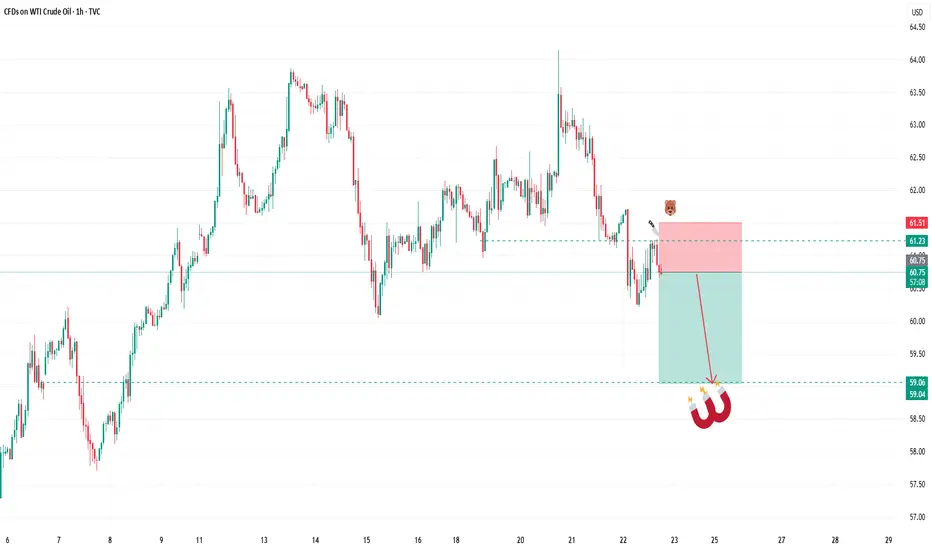
SELL USOILAs we had analysed the US DOLLAR which we expect big drop, in todays session we are monitoring USOIL for selling opportunities . Our entry is at 60.75 and stops above 61.50. Targets are 59.00 and below. Use proper risk management.