US10Y Technical Breakdown – Post-Moody’s DowngradeMoody’s has downgraded the US credit rating for the first time since 2011, citing rising debt levels and long-term fiscal challenges.
This move sends a clear warning signal about America’s fiscal path and adds fresh uncertainty to markets already navigating interest rates, inflation, and geopolitical risks.
Focus on the US 10-Year Treasury Yield as the market’s pulse on sovereign risk, inflation expectations, and future borrowing costs. Tracking its medium-term trend will provide crucial clues on market sentiment and risk appetite.
Medium-Term Market Analysis
(6-12 Months)
1. Structural Fiscal Risks
This downgrade highlights growing concerns over the US debt trajectory and political gridlock around spending and debt ceilings.
It’s less about an immediate crisis, more about long-term sustainability.
2. Rising Yields and Market Volatility
The 10-year Treasury yield could move higher, beyond 4.60% we could see rates possibly testing previous resistance of 4.80% (Jan 2025) or 5.00% (Oct 2023).
Higher yields mean increased borrowing costs, which can pressure interest-sensitive sectors like tech and real estate and add volatility to equities.
3. Federal Reserve’s Tough Balancing Act
With bond yields edging up, the Fed faces a dilemma: delaying cuts further could risk inflation climbing higher.
However, this downgrade raises the likelihood that the Fed could keep rates higher for longer than many investors expect.
4. Dollar and Capital Flow Shifts
While a credit downgrade may initially pressure the US dollar, its safe-haven status remains strong.
Global capital could increasingly look to alternatives like emerging markets or gold, leading to shifts in international financial flows.
Perspective
While Moody’s downgrade is a serious signal, it’s important to consider:
1) Political Leverage: Sometimes, rating agencies’ decisions can influence political negotiations. This downgrade may add pressure on US lawmakers to reach fiscal compromises. It’s a tool, not necessarily a verdict.
2) US Dollar & Debt Demand Resilience: Despite concerns, US Treasury securities remain the world’s primary safe asset, with global demand still robust. This could temper yield spikes and limit fallout.
Some could view the downgrade as “priced in” to a degree, given ongoing debt ceiling battles and past political brinkmanship.
If true, markets may react less dramatically than feared.
Watch
US 10-Year Yield: Key indicator to watch for shifts in risk sentiment and inflation expectations.
Equities: Prepare for increased volatility; consider defensive sectors and value plays.
Credit Markets: Monitor for widening spreads as risk aversion grows.
Policy Signals: Fed communications and US political developments will be critical catalysts.
This Moody’s downgrade isn’t just a headline, it’s a medium-term signal to recalibrate risk and position for a more uncertain fiscal backdrop.
DXY

DXY Local Short! Sell!
Hello,Traders!
DXY is making a bullish
Rebound but a horizontal
Resistance is ahead at 100.300
Level so after the retest a
Local bearish correction
Is to be expected
Sell!
Comment and subscribe to help us grow!
Check out other forecasts below too!
Disclosure: I am part of Trade Nation's Influencer program and receive a monthly fee for using their TradingView charts in my analysis.

DXY: The Market Is Looking Down! Short!
My dear friends,
Today we will analyse DXY together☺️
The in-trend continuation seems likely as the current long-term trend appears to be strong, and price is holding below a key level of 99.468 So a bearish continuation seems plausible, targeting the next low. We should enter on confirmation, and place a stop-loss beyond the recent swing level.
❤️Sending you lots of Love and Hugs❤️

DXY Is Going Up! Buy!
Here is our detailed technical review for DXY.
Time Frame: 9h
Current Trend: Bullish
Sentiment: Oversold (based on 7-period RSI)
Forecast: Bullish
The market is trading around a solid horizontal structure 99.729.
The above observations make me that the market will inevitably achieve 100.749 level.
P.S
Overbought describes a period of time where there has been a significant and consistent upward move in price over a period of time without much pullback.
Disclosure: I am part of Trade Nation's Influencer program and receive a monthly fee for using their TradingView charts in my analysis.
Like and subscribe and comment my ideas if you enjoy them!

Crucial levels for DXY (USD Basket), Risk Trigger On/OffCrucial levels for DXY. If it breaks lower than the lower trendline it tells me that assets like BTC, Gold, Silver, Copper, Palladium and Platinum can shoot to new ATH´s. If the level holds then I think we could hit a correction in the risk assets among assets already mentioned.
TVC:DXY COMEX:HG1! OANDA:XCUUSD OANDA:XAUUSD FX_IDC:XAUUSD ICEUS:DXY FX_IDC:XAGUSD TVC:PLATINUM TVC:PALLADIUM

The break-up (a must-watch chart)One of the most important—and unusual—developments in the market right now is the combination of rising US bond yields and a falling US dollar.
Normally, when bond yields go up, the dollar strengthens. It's similar to a high-interest bank account: if you can earn more by holding US assets, global investors tend to pile in, increasing demand for the dollar.
But that’s not what we’re seeing today.
Instead, yields are rising while the dollar weakens—something that’s more often associated with emerging markets facing debt concerns. It signals a deeper issue: despite higher returns on offer, investors are becoming wary of the underlying fundamentals.
In short, **America’s massive debt load and relentless money printing may be starting to catch up—**even with the world’s reserve currency. And the market is beginning to take notice.
This is important to all asset classes moving forward. Keep your eyes peeled on it.

Gold Stalled for a day! Can we get some more action now?Looking for price to start moving again today since we have some news coming up. It totally stalled out yesterday and consolidated in a range. we just need it to break outside of that range now.


DXY BUYBy utilizing Fibonacci retracement levels, historical patterns, , we can formulate a hypothesis that the market might follow a similar trajectory if bullish sentiment prevails.

CADCHF update!!Good day traders, I’m back with yet another update on CadChf and if I can remember well I mentioned the first time I posted this setup that this one is special because it offer us opportunities to learn and get to see if what ICT(Micheal.J) says about his concepts true or not, for me they work!!
The first setup I posted here and the second one will both be tagged in the description below just to support my ideology and how I came about this setup. On the first setup there was a large wick that i stated should be considered as a Gap and we saw price close above it to balance that gap. And you move one TF higher on your weekly there you’ll see that price has failed multiple times to balance that weekly VI, back on our daily TF we can see that price did not fully trade through that 1st.PFVG and we want to see it come back to fully trade through the gap.
Overall bias is BUYSIDE LIQUIDITY!!

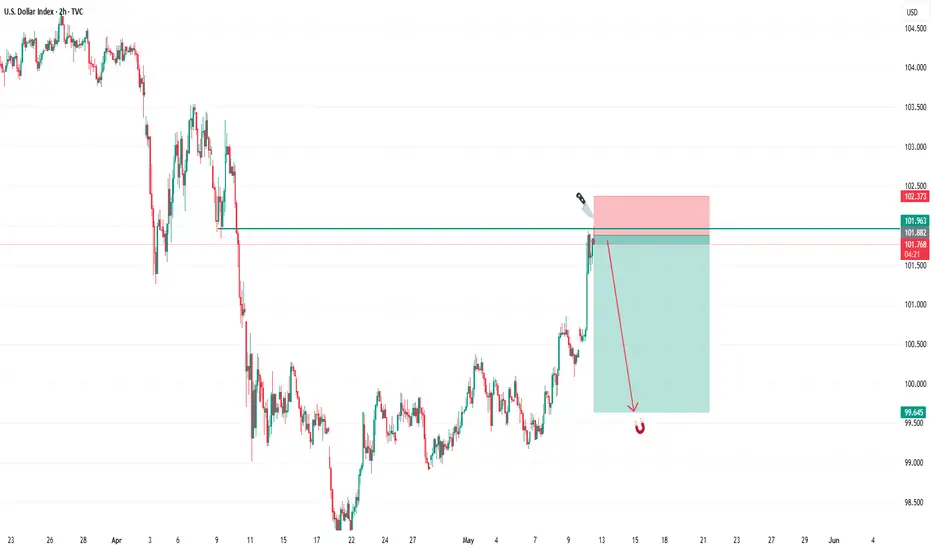
SELL USDIn todays session we are monitoring DXY for sells. After big move up we expect trend to continue. Our entry is at 101.82 and stops above 102.373. Targets are below 99.600 and lower to 95.00 . USD pairs will be dropping. Use proper risk management. Cheers to you all.
GBPUSD: Bearish Order FlowSpread out across multiple days, GBPUSD has been ranging now. Maybe it's time GBPUSD reached the peak of this distribution with this Shark Pattern. Let's see how it plays out.

DXY Bearish Setup: Sell from Supply Zone to 99.100 TargetTrend: 📉 Bearish Bias
Key Zones & Strategy:
🔶 Supply Zone (Sell Area)
📍 100.584 – 100.906
⚠️ Price may face selling pressure here
🔵 Entry Point:
🎯 100.584 (bottom of supply zone)
🔴 Stop Loss:
❌ 100.906 (just above resistance)
🟢 Target Point:
✅ 99.100
📉 Aligned with lower support line
Technical Indicators:
📏 Descending Channel
🔽 Price moving within parallel downward trend lines
📊 EMA (70) – Orange Line
🔁 Acting as dynamic resistance
Trade Setup Summary:
📌 Sell in the Supply Zone
🛑 Stop Loss: 100.906
🎯 Target: 99.100
⚖️ Good Risk-Reward Ratio
Warnings & Tips:
⚡ Watch for Breakouts:
If price breaks above 100.906 ➡️ 📈 Bearish idea invalid
📰 Check News Events:
FOMC, CPI, or other USD events may cause volatility

Gold is Giving up Set ups this week! Lets get it!Nice run up yesterday. Looking for it to continue. Want to see a nice pull back to give us entry for it to continue. Its a waiting game to wait for the killzones for best entries!

Bearish drop?US Dollar Index (DXY) is reacting off the pivot and could potentially drop to the 1st support.
Pivot: 100.21
1st Support: 98.92
1st Resistance: 101.09
Risk Warning:
Trading Forex and CFDs carries a high level of risk to your capital and you should only trade with money you can afford to lose. Trading Forex and CFDs may not be suitable for all investors, so please ensure that you fully understand the risks involved and seek independent advice if necessary.
Disclaimer:
The above opinions given constitute general market commentary, and do not constitute the opinion or advice of IC Markets or any form of personal or investment advice.
Any opinions, news, research, analyses, prices, other information, or links to third-party sites contained on this website are provided on an "as-is" basis, are intended only to be informative, is not an advice nor a recommendation, nor research, or a record of our trading prices, or an offer of, or solicitation for a transaction in any financial instrument and thus should not be treated as such. The information provided does not involve any specific investment objectives, financial situation and needs of any specific person who may receive it. Please be aware, that past performance is not a reliable indicator of future performance and/or results. Past Performance or Forward-looking scenarios based upon the reasonable beliefs of the third-party provider are not a guarantee of future performance. Actual results may differ materially from those anticipated in forward-looking or past performance statements. IC Markets makes no representation or warranty and assumes no liability as to the accuracy or completeness of the information provided, nor any loss arising from any investment based on a recommendation, forecast or any information supplied by any third-party.

Gold is Heating Up! Breakout + Trendline Support Gold has shown strong bullish continuation after breaking above a key descending resistance line. Once that breakout occurred, price formed a strong rising trendline, which has since been respected as dynamic support.
Additionally, a former resistance zone has now flipped into support, confirming a bullish market structure. Price is currently approaching a major upper resistance zone, where we may see a temporary pause or reaction.
As long as the rising trendline holds, the momentum remains in favor of buyers — and a clean breakout above the upper zone could trigger the next leg higher.

GBPUSDHello traders!
There’s currently an opportunity for a Sell trade on GBPUSD, and the position is now active.
🔍 Trade Details:
✔️ Timeframe: 15-Minute
✔️ Risk-to-Reward Ratio: 1:2
✔️ Trade Direction: Sell
✔️ Entry Price: 1.33695
✔️ Take Profit: 1.33531
✔️ Stop Loss: 1.33777
🔔 Disclaimer: This is not financial advice. I’m simply sharing a trade I’m personally taking based on my own strategy. It is intended purely for educational purposes.
📌 Interested in a more systematic and data-driven approach to trading?
💡 Follow the page and turn on notifications to stay updated with future trade ideas and market breakdowns.

XAUUSD H4: Re-accumulation | Floor at 3K | TP Bulls 4K🏆 Gold Market Mid-Term Update
📉 Gold Eases: Prices dip to $3,213.35/oz amid ceasefire optimism and stronger USD.
🤝 Trade Tensions: U.S.-China tariff truce reduces safe-haven demand, pressuring gold.
📊 Technical Watch: Analysts eye $3,200 support level as key for market direction.
🔮 EUROTLX:4K Forecast?: JP Morgan projects gold to surpass $4,000/oz by Q2 2026.
⚠️ Credit Downgrade: Moody's cuts U.S. rating to "Aa1", citing rising debt, impacting gold sentiment.
🏠 Investment Shift: Gold's YTD return at 22.42%, outperforming many assets.
🌍 Central Bank Buying: Sustained demand from emerging markets supports gold prices.
🛡️ $3,200 Holds: Gold maintains key support despite volatility and profit-taking.
📈 Goldman Bullish: Forecasts gold at $3,700/oz by year-end, with potential to reach $4,500.
💰 Live Price: Gold at $3,228.80 (+0.01%) today.
📊 Technical Outlook Update
🏆 Bull Market Overview
▪️pullback in progress currently
▪️3500 USD heavy resistance
▪️Re-accumulation in progress now
▪️Same as Q4 2024 - on the right
▪️Expect re-accumulation into June
▪️Downside capped by 3 000 USD
▪️short-term expecting range action
▪️Bulls still maintain strategic control
⭐️Recommended strategy
▪️Accumulate in range
▪️Closer to 3K S/R zone
▪️Bulls 4K still valid target

Bullish bounce?US Dollar Index (DXY) is reacting off the pivot and could bounce to the 1st resistance.
Pivot: 100.21
1st Support: 99.45
1st Resistance: 101.88
Risk Warning:
Trading Forex and CFDs carries a high level of risk to your capital and you should only trade with money you can afford to lose. Trading Forex and CFDs may not be suitable for all investors, so please ensure that you fully understand the risks involved and seek independent advice if necessary.
Disclaimer:
The above opinions given constitute general market commentary, and do not constitute the opinion or advice of IC Markets or any form of personal or investment advice.
Any opinions, news, research, analyses, prices, other information, or links to third-party sites contained on this website are provided on an "as-is" basis, are intended only to be informative, is not an advice nor a recommendation, nor research, or a record of our trading prices, or an offer of, or solicitation for a transaction in any financial instrument and thus should not be treated as such. The information provided does not involve any specific investment objectives, financial situation and needs of any specific person who may receive it. Please be aware, that past performance is not a reliable indicator of future performance and/or results. Past Performance or Forward-looking scenarios based upon the reasonable beliefs of the third-party provider are not a guarantee of future performance. Actual results may differ materially from those anticipated in forward-looking or past performance statements. IC Markets makes no representation or warranty and assumes no liability as to the accuracy or completeness of the information provided, nor any loss arising from any investment based on a recommendation, forecast or any information supplied by any third-party.

Will the Euro weaken against the US Dollar?EURUSD has started a price and time correction since July 28, 2008 in the form of a diametric pattern.
Wave-(f) currently appears to be forming. We see two price ranges for the end of wave-(f) in terms of price:
a - range 1.15758-1.17173
b - range 1.21357-1.23505
After the completion of wave-(f) we expect wave-(g) to continue to the specified range.
Good luck
NEoWave Chart

DXY: Local Bullish Bias! Long!
My dear friends,
Today we will analyse DXY together☺️
The price is near a wide key level
and the pair is approaching a significant decision level of 99.946Therefore, a strong bullish reaction here could determine the next move up.We will watch for a confirmation candle, and then target the next key level of 100.223.Recommend Stop-loss is beyond the current level.
❤️Sending you lots of Love and Hugs❤️

DXY LONG/BUYBy utilizing Fibonacci retracement levels, historical patterns, , we can formulate a hypothesis that the market might follow a similar trajectory if bullish sentiment prevails.

7. "Boom! Trap, grab, and rally — just as planned."
**"She walked right into the selling zone like she owned the chart.
But baby, this ain’t a fairy tale — this is Elliott Wave.
Wave C? Dead on arrival.
CHOCH triggered? Game on.
Retail's still dreaming of 1.40 —
We're already targeting the magnet zone with sniper precision.
She teased the breakout, we caught the fakeout.
This ain't luck. It's strategy wrapped in savage.
Trade less. Win more.
Stay sexy, stay sharp."**
