USDCADHello Traders!
What are your thoughts on USD/CAD?
After its recent decline, USD/CAD has reached the bottom of the descending channel and a key support zone.
This area may act as a strong support, and we expect a bullish reaction from here.
We anticipate a bounce from this support zone, with the price potentially rising at least toward the specified target level.
Will USD/CAD hold the support and rebound, or break lower? Share your thoughts below!
Don’t forget to like and share your thoughts in the comments! ❤️
DXY

top is in for the dxygm,
this idea has been in the works for years, ever since we topped out 3 years ago. there has been quite a bit of variations of this idea, but this one right here has been my primary idea for a very long time.
initially i imagined the dxy coming up to 111-113 before topping out, and i reckon it still can, but the worst is behind us, relatively speaking.
---
if my count here is correct, the dxy will begin extending down into wave c into the last days of 2025 where a major low will be put in place .
this will create a hyper-parabolic bull phase for risk assets, in conjunction with declining rates.
---
if you've been waiting for a signal to buy alts
this is your signal.
🌙
---
ps. view my private idea from last year via:
🌙

DeGRAM | DXY has broken the downward structureThe DXY is under a descending channel above the trend lines.
The price has broken the upper trend line.
The chart maintains a harmonic pattern and has already broken the descending structure.
We expect a rise after consolidation above the resistance level.
-------------------
Share your opinion in the comments and support the idea with like. Thanks for your support!

EURUSD Setup: Buy First, Sell Later – Don’t Miss the Move!EURUSD has been trending upward for a while now, just as we discussed in the last post. We're reaching higher levels, and while it does look like we could be approaching a potential sell zone, I’m staying patient.
I believe there are still some highs above us that need to be taken out first. What we’re seeing right now could be manipulation—an attempt to trap early sellers. That’s why I won’t be selling yet.
Instead, I’m watching for buy setups today and tomorrow off key levels on my chart. Once those highs are swept and we get confirmation, that’s when I’ll start looking for potential sells.
Give this a boost if you found it useful!

How far could the USD fall?.. WATCH THE DOLLAR INDEXThe dollar is declining as US uncertainty continues and cash moves out of the US. I personally think the dollar will bounce, but how far could it fall in the meantime...
Price is testing the previous monthly horizontal resistance as support and the monthly 100 SMA. The dollar may find a bottom here. From 98 to 100 on TVC:DXY
Price may reach the monthly bullish channel support. There will likely be technical buyers in this area. From 95 to 96 on TICKMILL:DXY
Good luck!

DeGRAM | DXY dropped below 100 pointsDXY is in a descending channel between trend lines.
On the downside, the price has formed a gap and dropped below 100 pips and has already reached the lower trend line.
The chart maintains a descending structure but has already formed a harmonic pattern and a descending wedge.
On the major timeframes, the index relative strength is in the oversold zone and on the 30m Timeframe it is forming a bullish convergence.
We expect a reversal after a support retest.
-------------------
Share your opinion in the comments and support the idea with like. Thanks for your support!

DXYDXY Index
- Completed " 12345 " Impulsive Waves
- Break of Structure
- RSI - Divergence
- Bullish Channel as an corrective pattern in Short Time Frame
- Support Level

U.S. Dollar Index (DXY) – Key Resistance & Bearish Target Analys📊 Key Observations:
🔵 Resistance Zone (📍~103.5 Level)
A strong resistance area (🔵 blue box) is marked, indicating potential selling pressure if the price reaches this level.
The price is moving upwards (📈) towards this resistance, so watch for rejection or breakout.
🔵 Support/Target Zone (📍~101.5 Level)
A lower support zone (🔵 blue box) is marked as the bearish target 🎯.
If the price fails at resistance, it may head downwards (📉) to this level.
📉 Recent Price Action:
🚀 Sharp drop followed by a rebound (📈).
The price is currently moving back up (🔼), possibly forming a lower high before another drop.
📌 Exponential Moving Average (DEMA 9 - 102.488)
The price is hovering above the 9-period DEMA (📏), showing short-term bullish momentum.
If the price rejects resistance and falls below the DEMA, a bearish continuation (📉) is likely.
🚀 Potential Scenarios:
✅ Bullish Breakout: If price breaks above 🔵 resistance, it may continue rising (📈) to higher levels.
❌ Bearish Rejection: If price fails at resistance, expect a drop (📉) towards 101.5 🎯.

DXY for this week.uhhh, last time i kinda gave yall a short bias, it worked, now with these prices, i reckon it will reverse at that little 1H low i marked out there, or, it will literally smashed ts out of the 4H low i marked at the bottom

ECB decision shadowed by tariff risk Markets will be closely watching the European Central Bank’s (ECB) interest rate decision on April 17, with expectations for a seventh consecutive rate cut.
Despite this expectation, the euro surged to a three-year high against the US dollar last week, as traders continued to pull away from US assets.
The dollar index has dropped 4% since President Trump’s “Liberation Day” tariff announcements on April 2, falling below the key 100 level too.
At this stage, market participants will be looking for any signals on how the ECB might respond to the potential spillover effects of President Trump’s tariff measures. While some guidance may emerge around already-announced policies, the risk of further unpredictability remains high.
Trump being Trump, it is perhaps unlikely we have seen the last of his volatility-inducing tariff announcements. This can weigh further on the dollar, eroding confidence in the world’s reserve currency.

Natural Gas | Oil | Dollar | Silver | Gold Price ForecastNatural Gas | Oil | Dollar | Silver | Gold Price Forecast
NYMEX:CL1! COMEX:SI1!

“EUR/USD Nears Wave (C) Climax – Will Smart Money Step In?”EUR/USD is approaching the final leg of its corrective A-B-C structure. With wave (C) targeting the 1.15–1.18 supply zone, a major reversal setup is brewing.
Wave (A)-(B)-(C) correction structure in play
Current bullish momentum likely completing wave (C)
Watch for potential 50% and 78% Fibonacci retracement zones for next sell setups
Embedded Wyckoff distribution schematic suggests institutional unloading soon
If you're tracking smart money, the final wave up could be the perfect setup to sell the rally once signs of distribution confirm.
Key Levels to Watch:
Supply Zone: 1.15–1.18 (Wave C Top)
First Demand: 50% zone
Deeper Demand: 78% retracement = high confluence
#EURUSD #ElliottWave #WyckoffMethod #SmartMoney #ForexForecast #WaveC
--

(SMC) and key liquidity zones aligning for a major bearish reverThe U.S. Dollar Index (DXY) is tracing out its final wave of the Elliott 5-wave structure, with a powerful confluence of Smart Money Concepts (SMC) and key liquidity zones aligning for a major bearish reversal.
Wave (iv) correction might offer the last sell opportunity before a deep wave (v) drives us into the golden demand zone near 91–93.
Watch closely:
Fair Value Gap (FVG) & Order Block aligning at resistance
Wave (iii) completed with strong momentum
Massive bearish pressure setting up for 2025–2026
Next Move?
We’re tracking the wave (iv) pullback into the SMC zone, looking for entries to ride wave (v) down.
Get ready for a potential macro-level shift in dollar strength!
#DXY #ElliottWave #SMC #ForexAnalysis #DollarIndex
--
Let me know if you like it

The impact of tariffs on the DXYIn the long term, the imposition of tariffs will trigger countermeasures from trading partners 😡, leading to a shrinkage of the global trade scale 😔. The import costs of raw materials for American enterprises will rise, and their export markets will be restricted, which will curb the economic growth of the United States 😩. This will exert depreciation pressure on the US dollar, causing the DXY to decline 📉.
U.S. Tariff Policies
Since April 9th, the United States has imposed tariffs ranging from 10% to 25% on goods from China, the European Union, Canada, and other regions, covering key sectors such as automobiles, steel, and semiconductors.😒
Countermeasures of Various Countries
China: On April 4th, China announced that it would impose a 34% tariff on U.S. goods starting from April 10th. On April 9th, the tariff rate was further increased to 84%, covering all U.S. goods.😠
The European Union: Announced that it would impose a 25% tariff on U.S. motorcycles, diamonds, and other goods starting from May 16th.😤
Canada: Imposed a 25% retaliatory tariff on U.S. automobiles on April 9th, but exempted auto parts.😏
This upward movement has led to the clearing of many traders' accounts or significant losses 😫. You can follow my signals and gradually recover your losses and achieve profitability 🌟.
💰💰💰 DXY 💰💰💰
🎯 Sell@103 - 100
🎯 TP 96 - 94
Traders, if you're fond of this perspective or have your own insights regarding it, feel free to share in the comments. I'm really looking forward to reading your thoughts! 🤗

DXYWe are expecting DXY to give us slow push to the upside towards 101.5 level.
Disclosure: We are part of Trade Nation's Influencer program and receive a monthly fee for using their TradingView charts in our analysis.

$DXY to 100 and heading lower, bullish for $EURUSDTVC:DXY the dollar index, was the primary driver of the equity bear market in 2022. With TVC:DXY hitting a 5 year high of 114 marked the bottom in AMEX:SPY and $QQQ. The recent strength in TVC:DXY was out of stock with TVC:DXY and Stock markets rising at the same time and dropping when the TVC:DXY is falling. Usually, the risk assets have an inverse correlation to the US Dollar index. These periods in history are unusual and are marked by some kind of macro events like recession etc. With tariffs discussion everywhere that might not be unrealistic to expect some kind of recession.
In that case where is the TVC:DXY headed? Currently the TVC:DXY is at a psychological level of 100. Once it breaks below 100 the next stop might be 95. If we see some kind of soft recession which is my worst-case scenario then we might see the lows of 90 in $DXY. If TVC:DXY goes down by 10% or lower than we can expect to the FX:EURUSD to go back to its recent high of 1.23.
Verdict: Short TVC:DXY ; Long FX:EURUSD , AMEX:SPY and NASDAQ:QQQ

DXY Will Fall! Short!
Here is our detailed technical review for DXY.
Time Frame: 1D
Current Trend: Bearish
Sentiment: Overbought (based on 7-period RSI)
Forecast: Bearish
The market is trading around a solid horizontal structure 99.769.
The above observations make me that the market will inevitably achieve 96.117 level.
P.S
Please, note that an oversold/overbought condition can last for a long time, and therefore being oversold/overbought doesn't mean a price rally will come soon, or at all.
Disclosure: I am part of Trade Nation's Influencer program and receive a monthly fee for using their TradingView charts in my analysis.
Like and subscribe and comment my ideas if you enjoy them!

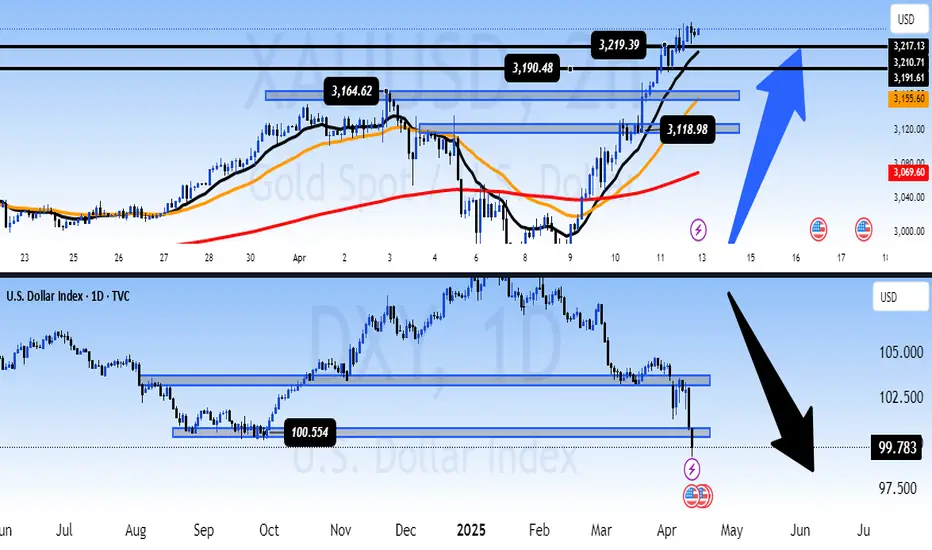
[XAU/USD & DXY] – Long-Term Outlook📌 – Long-Term Outlook: Is Gold Entering a New Bull Cycle as USD Weakens?
📊 Technical Analysis – Gold & DXY
The divergence between Gold and the U.S. Dollar Index (DXY) has become increasingly clear:
🔹 Gold (XAU/USD):
Price has broken the previous high at 3,190 and is now testing 3,219 – a fresh all-time high on the daily chart.
The MA13, MA34, and MA200 are showing a perfect “bullish fan” formation, indicating a sustainable uptrend rather than a short-term pump.
The key support zone around 3,164 – 3,118 remains critical for any healthy pullback.
🔻 U.S. Dollar Index (DXY):
Price has decisively broken below the psychological 100.55 support and is now hovering near 99.78.
If DXY fails to hold above 99.7, the next downside target could be 97.5 in the coming quarter.
The technical structure is clearly bearish, confirming USD weakness across the board.
→ This negative correlation aligns with macro expectations: a weaker dollar is fueling gold’s bullish momentum.
🌍 Fundamental Analysis – Macro Drivers
US PPI & CPI both come in lower than expected:
Inflation is showing clear signs of cooling.
Markets are now pricing in a possible rate cut as early as June.
Shift in Fed tone – from hawkish to neutral:
While not officially declared, recent Fed statements have been more dovish, supporting risk assets and weakening the dollar.
Strong safe-haven demand remains:
Geopolitical risks and economic uncertainty continue to push capital into gold, especially as USD enters a weakening phase.
🧭 Long-Term Perspective
Gold is potentially entering a new bull cycle. With consecutive ATH breakouts and favorable macro conditions (falling inflation, expected rate cuts, USD weakness), gold could push to even higher levels into Q2 and Q3.
The USD faces downside pressure in the coming months, especially if the Fed signals a firm pivot toward easing.
⚠️ Strategy Caution
Short-term corrections may occur, especially after such a sharp rise.
However, any pullbacks into key support zones could present strategic long opportunities for longer-term investors.
💬 What’s Your Take?
Is this the beginning of a major bull cycle in gold, or do you expect deeper pullbacks before continuation?
Drop your analysis and charts below! 👇👇👇
What I'm expecting on the new week open..This is basically what my gut is telling me that is going to happen on Monday's open based on technical factors thought by ICT and my own spin on it.
TLDW; It looks like we are just going to start going up with very little retracement at the start of the week.
- R2F Trading

Weekly Market Analysis - 12th Apr 2025Here is another weekly market analysis!
The US Dollar has been tanking, but respecting the higher timeframe PD Arrays nicely.
I'm anticipating lower prices for it, and share my thoughts in the video in relation to other forex pairs.
Good luck out there next week!
- R2F Trading

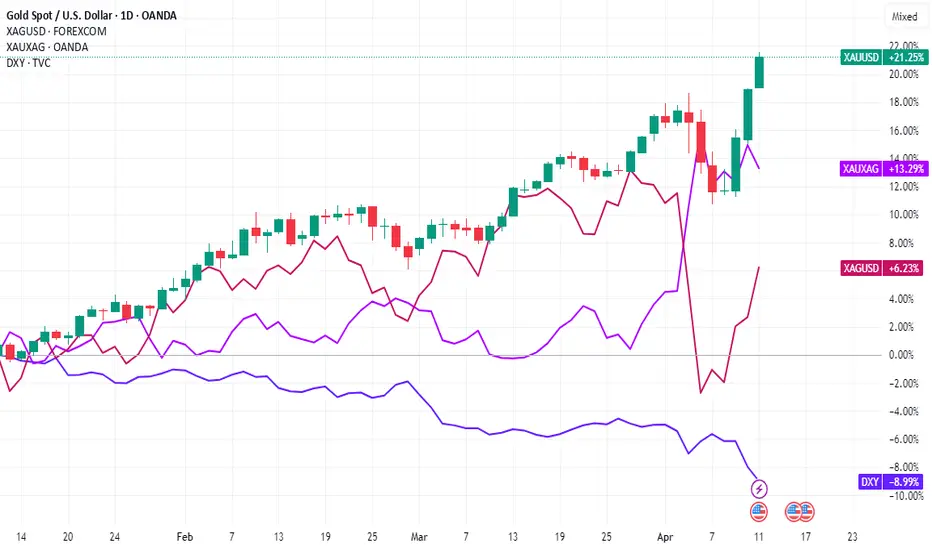
Gold & Silver Soar: Trade War RallyAnatomy of a Rally: How US-China Trade Tensions Propelled Gold to Record Highs and Lifted Silver
Introduction
The global financial landscape is frequently reshaped by geopolitical events, and few have cast as long a shadow in recent memory as the trade tensions between the United States and China. During periods of heightened friction, characterized by escalating tariffs, retaliatory measures, and pervasive economic uncertainty, markets often witness significant shifts in asset allocation. One of the most prominent beneficiaries during such times is gold. This document explores the dynamics behind gold prices reaching record highs amidst a US-China trade war, examining the multifaceted reasons for its ascent and noting the concurrent, significant rise in silver prices, which often move in tandem with the yellow metal due to overlapping market drivers.
The US-China Trade War: A Catalyst for Uncertainty
The trade conflict between the world's two largest economies represents more than just a dispute over tariffs and trade balances. It embodies a fundamental clash over technology, intellectual property, global influence, and differing economic models. The imposition of tariffs on hundreds of billions of dollars worth of goods creates direct economic consequences:
1. Increased Costs: Businesses face higher import costs, which can be absorbed (reducing profits), passed onto consumers (potentially fueling inflation), or lead to shifts in supply chains (causing disruption and inefficiency).
2. Reduced Trade Flows: Tariffs act as barriers, potentially dampening global trade volumes and impacting export-oriented economies.
3. Economic Growth Concerns: The uncertainty surrounding future trade policies makes businesses hesitant to invest and expand, potentially leading to slower global economic growth or even recessionary fears.
4. Supply Chain Disruptions: Companies reliant on cross-border supply chains face significant operational challenges, needing to find alternative suppliers or routes, often at higher costs and lower efficiency.
5. Currency Volatility: Trade disputes can lead to fluctuations in exchange rates, particularly involving the US dollar and the Chinese yuan, adding another layer of risk for international businesses and investors.
This pervasive uncertainty becomes a powerful driver pushing investors towards assets perceived as safe.
Gold: The Quintessential Safe Haven
Gold's reputation as a safe-haven asset is deeply ingrained in financial history. During times of economic stress, political instability, or market turmoil, investors flock to gold for several key reasons, all amplified by a US-China trade war:
1. Store of Value: Unlike fiat currencies, which can be devalued by inflation or government policy, gold is seen as retaining its intrinsic value over the long term. Fears that trade wars could lead to competitive currency devaluations or necessitate inflationary monetary policies (like extensive quantitative easing) make gold particularly attractive.
2. Hedging Against Uncertainty: When the outlook for traditional assets like stocks and bonds becomes cloudy due to geopolitical risks like a trade war, gold offers a perceived refuge. Its price often exhibits a low or negative correlation to equity markets during downturns, making it valuable for portfolio diversification.
3. Geopolitical Risk Premium: Major international conflicts or tensions invariably add a risk premium to gold prices. A trade war between global superpowers significantly elevates perceived geopolitical risk, prompting safe-haven buying.
4. Weakening US Dollar Potential: While the US dollar itself can act as a safe haven, a protracted trade war could raise questions about the US economic outlook or lead to policies aimed at weakening the dollar to boost exports. Since gold is typically priced in US dollars globally, a weaker dollar generally makes gold cheaper for holders of other currencies, potentially increasing demand and pushing the dollar price higher.
5. Central Bank Demand: In an environment of heightened geopolitical tension and questions surrounding the dominance of the US dollar, central banks (particularly those in emerging markets or nations seeking to reduce reliance on the USD) often increase their gold reserves. This diversification strategy provides a steady source of demand, underpinning prices. A US-China trade conflict could accelerate this trend among various nations.
6.
The Mechanics of the Price Surge
The record high in gold prices isn't just a passive reaction; it's driven by active market dynamics:
• Increased Investor Demand: Retail and institutional investors increase allocations to gold through physical bullion, gold futures contracts, and gold-backed Exchange Traded Funds (ETFs). Large inflows into major gold ETFs are often a visible indicator of this heightened demand.
• Speculative Activity: Traders in the futures market anticipate further price increases driven by the ongoing trade tensions and safe-haven flows, adding upward momentum.
• Sentiment: Market psychology plays a crucial role. As prices rise and news headlines focus on the trade war and gold's rally, a positive feedback loop can emerge, drawing in more buyers afraid of missing out (FOMO).
Silver's Ascent: Riding Gold's Coattails and Its Own Merits
Silver prices registering a steep rise alongside gold during such a period is a common phenomenon, though its drivers are slightly more complex:
1. Monetary Asset Correlation: Silver, like gold, has a long history as a monetary metal and store of value. It often trades as "poor man's gold," attracting investors seeking safe-haven exposure at a lower price point per ounce. During strong gold rallies driven by macroeconomic fear, silver typically follows suit.
2. Industrial Demand Component: Unlike gold, silver has significant industrial applications (electronics, solar panels, medical devices). This is a double-edged sword during a trade war. While safe-haven demand pulls prices up, fears of a trade-war-induced global economic slowdown could theoretically dampen industrial demand, potentially capping silver's gains relative to gold. However, in scenarios where safe-haven buying dominates market sentiment, this factor often takes a backseat initially.
3. Higher Volatility: Silver markets are smaller and typically more volatile than gold markets. This means that significant inflows driven by safe-haven sentiment can lead to sharper percentage gains (and potentially sharper losses during corrections) compared to gold. The "steep rise" noted is characteristic of silver's higher beta.
4. Gold-Silver Ratio: Traders often watch the gold-silver ratio (the number of silver ounces needed to buy one ounce of gold). When this ratio reaches historical extremes, some investors may buy silver, betting that it is undervalued relative to gold and that the ratio will revert closer to its historical mean. A major gold rally can stretch this ratio, triggering such trades and boosting silver demand.
Global Trends and Context
While the US-China trade war serves as a potent catalyst, it often occurs within a broader context of global trends that can support precious metal prices. These might include accommodative monetary policies from major central banks (low interest rates reduce the opportunity cost of holding non-yielding assets like gold), existing geopolitical hotspots beyond the US-China relationship, concerns about sovereign debt levels, or nascent inflationary pressures. The trade war acts as an accelerant, amplifying the impact of these underlying factors on gold and silver.
Conclusion
The surge of gold prices to record highs during a period marked by an intense US-China trade war is a textbook example of the metal fulfilling its traditional role as a premier safe-haven asset. The conflict breeds deep economic uncertainty, stokes fears of currency devaluation, heightens geopolitical risk perception, and potentially influences central bank reserve policies – all factors that historically drive capital towards gold. The simultaneous sharp rise in silver prices underscores its strong correlation with gold as a monetary asset, benefiting from the same wave of risk aversion, albeit with the added complexity of its industrial demand profile. Understanding these dynamics is crucial for investors navigating volatile periods, highlighting gold's enduring appeal as a portfolio diversifier and a refuge when storm clouds gather over the global economy, particularly when sparked by friction between major world powers.
DXY In Difficult Circumstances Since the Start 80's I decided to give a go at the Dollar Index given the circumstances around the world. And to be honest, I tried to put on the positive glasses.
I believe the dollar has been in a complex correction since the mid 80's. Starting out with a large dump in '85 with the a-wave, the correction slowed down and only grew more and more complex.
Thought about current wave: What I believe we are going through now is, that we are finishing up the purple C-wave in a green (C)-wave. This wave can end at any time now, since it's now at the 61.8% fib level of the purple A-wave. But it might go down to the 95 level (The green box) to complete at the 100% fiblevel of the purple A-Wave.
But first we will have the fourth wave meaning the DXY is gonna struggle for some weeks. Because we had a swift two week wave 2, which means we are probably going have a slow fourth wave according to the rule of alternation. This mean the purple C-wave could drag out into the end of '25 into early '26.
This is also with that in mind that a C-wave most likely will take longer than an A-wave. These are the Purple boxes.
BUT, after this, DXY is gonna experience some happy years again, going back up to the yellow box somewhere between 110 and 120 to finish the WXY of x of the larger degree. This will take DXY into a couple of years bull-run as long as the green (C) wave runs and completes no earlier than late '27, depending when the purple C-wave prior to the green (C) wave ends. But I believe the green (C)-wave will take about two years to complete.
But after this, DXY could again go into some dark ages and considering the high degree purple w-wave took 23 years to complete (blue giant box), there is no reason to believe this high degree purple y-wave will be a swift matter and actually don't complete before the year 2050. And it will take the DXY all the down to start 60's or lower.
The reason I said I tried to put on the positive glasses, is that I tried seeing the white channel as a leading diagonal for a new bull run, but I just don't see it as such.
I also tried seeing it as a C-wave of a flat diagonal, but this would result in another C-wave afterwards, and also take us down to the 60's level. So that didn't do us any good.
For the sake of DXY, I hope I'm wrong, but this is how I see it.

DXY: Summer CRASH but here is why it will SKYROCKET after.The U.S. Dollar Index is oversold on both its 1D and 1W technical outlooks but on the 1M it just turned bearish (RSI = 42.641, MACD = 0.810, ADX = 21.680). This is because it crossed under its 1M MA50 for the first time since January 2022. For more than 3 years the 1M MA50 has kept it on the upper side of the 2008 Channel Up but now the time has come for it to aim at its bottom as every time it broke under it, the pattern dropped more and made a bottom a few months later.
We anticipate a bottom around July, ideally with the 1M RSI inside our Target Zone, which consists of the last two lows. Then the new bullish wave of the pattern should begin, reaching the January 2025 High by the end of 2026.
## If you like our free content follow our profile to get more daily ideas. ##
## Comments and likes are greatly appreciated. ##
