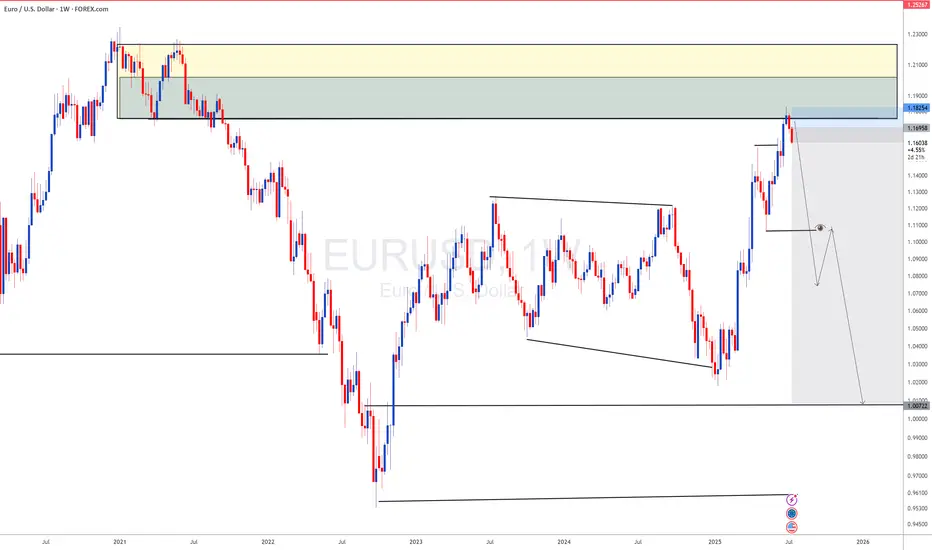
EURUSD as DXY s gaining momentum DXY has completed its long term downside now lets look for sell on EURUSD
DXY
DXY: potentially aiming for January 2025 highsAlthough we do not Trade the dollar specifically, it is a good barometer the feel out other assets.
It seems like DXY reached a MONTHLY LEVEL. I expect price to form a FVG within this rectangle on the daily level. Which will eventually create a GAP on one of the currencies. Will follow up when this happens.
IMO reversed and is going to reach the daily level quick. This will mean, POUND, EURO DOWN.

GOLD - SHORT TO $2,800 (1H UPDATE)Yesterday's entry hit SL, as price pushed up a little higher for liquidity, ahead of today's CPI data.
I have entered another sell entry today at $3,353. Couldn't send analysis straight away as I was out & didn't have my laptop on me. But re-trying this analysis one last time. If SL is hit, we will wait for $3,400 entry.

DXY - USD Index: either 86 or 112If the current pullback can break above the Centerline, then massive upside is on the plate.
But if it gets rejected, massiv downside is possible.
We don't know yet.
Just let the market tell you.

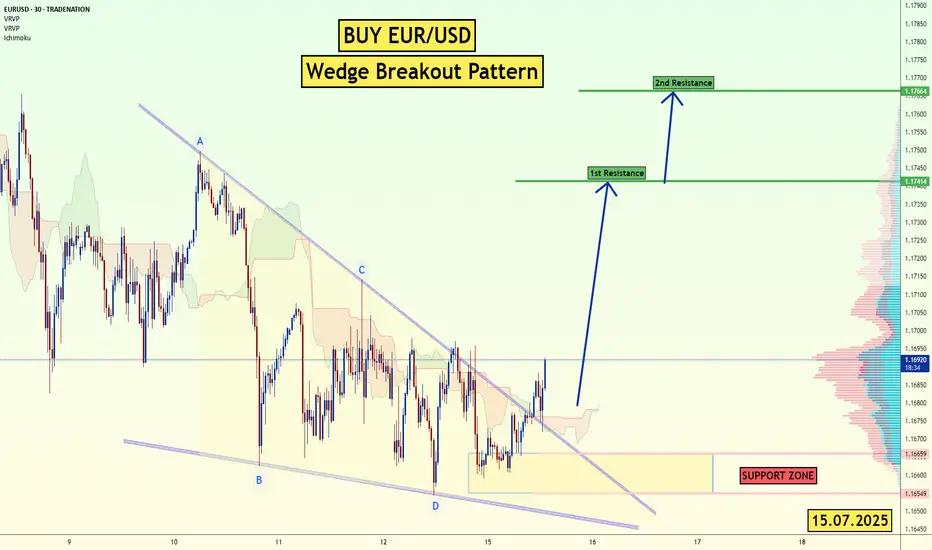
EUR/USD - Wedge Breakout (CPI- Today) 15.07.2025 The EUR/USD pair on the M30 timeframe presents a Potential Buying Opportunity due to a recent Formation of a Wedge Breakout Pattern. This suggests a shift in momentum towards the upside and a higher likelihood of further advances in the coming hours.
Possible Long Trade:
Entry: Consider Entering A Long Position around Trendline Of The Pattern.
Target Levels:
1st Resistance – 1.1741
2nd Resistance – 1.1766
🎁 Please hit the like button and
🎁 Leave a comment to support for My Post !
Your likes and comments are incredibly motivating and will encourage me to share more analysis with you.
Best Regards, KABHI_TA_TRADING
Thank you.
Disclosure: I am part of Trade Nation's Influencer program and receive a monthly fee for using their TradingView charts in my analysis.
Dollar Index Bullish OverviewThe Dollar moving Bullish as we expect it to within the Gold Fund! As soon as we saw a '5 Bearish Wave Completion' on the DXY, straight away buyers entered the market & start pushing price back up.
My Gold Fund investors & Gold Vault Academy students know from our 'Q3 Market Breakdown Report' what we're expecting for the Dollar in the next 3 months.

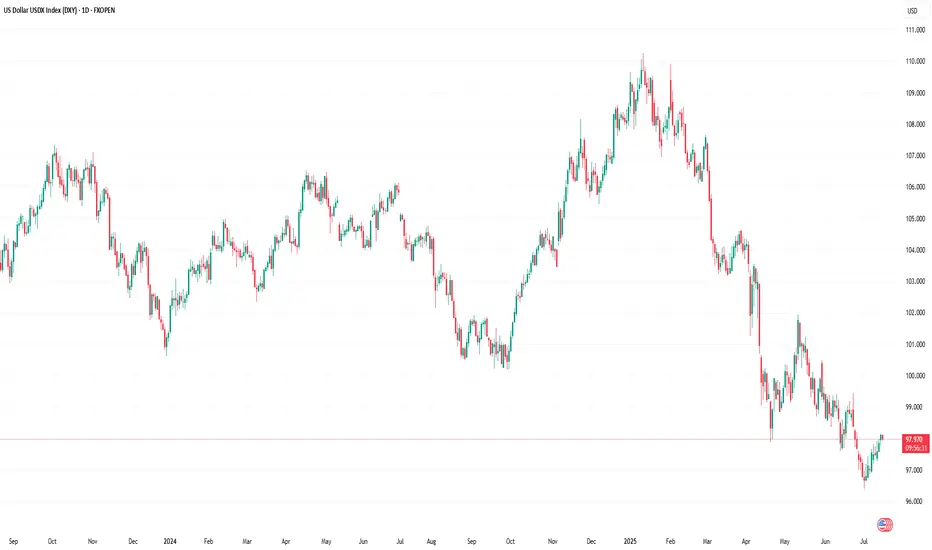
A Closer Look at the Role and Recent Volatility of the (DXY)A Closer Look at the Role and Recent Volatility of the US Dollar Index (DXY)
We don’t even need to say that the US Dollar Index (DXY) is one of the most influential benchmarks in global currency markets. The index, which measures the value of the US dollar against a basket of six major currencies, experiences heightened volatility and presents potential opportunities.
Understanding the DXY: A Macro Lens on the Dollar
The DXY tracks the relative strength of the US dollar versus a weighted currency basket including the euro, Japanese yen, British pound, Canadian dollar, Swedish krona, and Swiss franc. Although the euro comprises nearly 58% of the index, the DXY reflects broad USD strength or weakness across global markets, not just against a single currency.
Traders and analysts use the DXY as a key macro indicator—to track policy divergence between central banks, to hedge USD exposure, and to assess broader market sentiment. Rising DXY levels often signal tightening US policy or global risk aversion, while declines may reflect weakening growth expectations, dovish Fed policy, or geopolitical stress. In volatile environments like 2025, the DXY serves as a real-time barometer of global confidence in the US economy and dollar-based assets.
Recent Price Swings: Tariffs & Policy Uncertainty Shake the Dollar
Since April, the US Dollar Index has faced one of its most volatile stretches in years, driven by a convergence of Federal Reserve policy uncertainty and new trade tariffs announced by President Trump.
April: “Liberation Day” Tariffs Trigger Market Shock
On 2 April, the announcement of sweeping “Liberation Day” tariffs—10% on nearly all imports, with higher duties on selected countries—jolted currency markets. The DXY fell over 2% in a single day. In the following weeks, the index continued to decline as business confidence deteriorated and early signs of recession risk emerged.
May–June: Policy Headwinds Compound Dollar Weakness
As the tariff package took effect, the dollar extended its slide—marking a ~10% drop from its late‑2024 peak, the worst first-half performance in over 50 years. Investors reassessed US growth prospects amid the pressures of trade friction. The Fed responded with a hawkish pause, while President Trump publicly urged for rate cuts, further muddying the policy outlook and pressuring the dollar.
July: Uncertainty Builds
By early July, the DXY had fallen below 97, tallying an approximate 11% year-to-date decline. Analysts cite a “perfect storm” of expanding fiscal deficits, erratic trade decisions, and growing doubts over US policy credibility as key reasons for the dollar’s fall from favour.
Why DXY Matters Now More Than Ever
The DXY has become a real-time gauge of market confidence in US policy stability. The dollar’s sharp decline in 2025 underscores how fragile that confidence can be in the face of aggressive trade measures and uncertain monetary direction.
The introduction of Trump’s tariffs has raised structural concerns among investors:
- Growth expectations have been cut due to higher input costs and supply chain friction.
- The so-called safe-haven appeal of the USD has eroded, with flows shifting to the euro, Swiss franc, and gold.
- Foreign demand for dollar assets has softened, as fears of a prolonged trade conflict and fiscal indiscipline mount.
In this climate, the DXY has evolved into a barometer for geopolitical tension, inflation fears, and investor sentiment towards US leadership.
Bottom Line
The DXY is not just a tool for dollar specialists—it's a key reference for any trader dealing with macro-sensitive instruments. As the global rate environment continues to shift and the US economy shows mixed signals, the DXY may become one of the most revealing indicators to watch and trade in the second half of 2025.
This article represents the opinion of the Companies operating under the FXOpen brand only. It is not to be construed as an offer, solicitation, or recommendation with respect to products and services provided by the Companies operating under the FXOpen brand, nor is it to be considered financial advice.
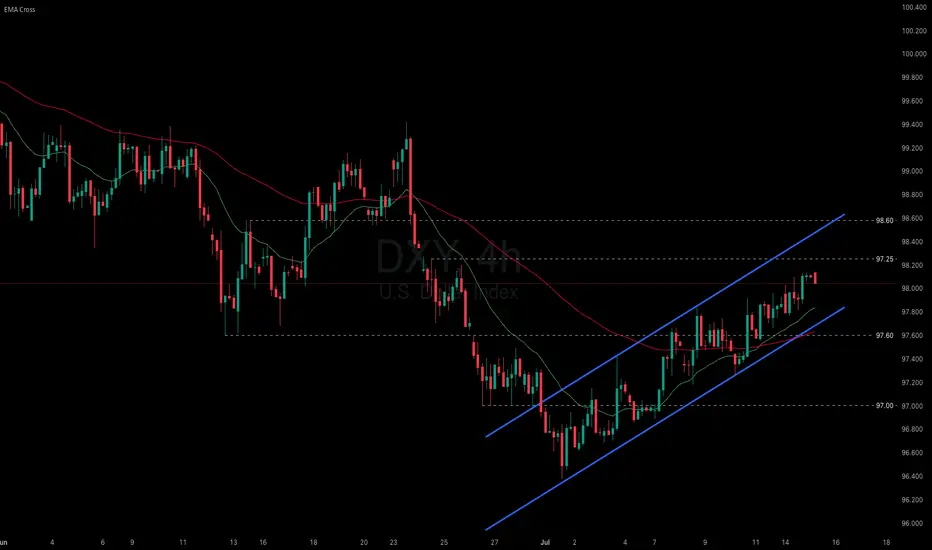
Dollar holds steady uptrend despite Trump’s tariff threats.
President Trump announced a 30% tariff on imports from both the EU and Mexico, a hike from the 20% previously imposed on the EU in April. He also warned that if no agreement is reached on the Ukraine war within 50 days, countries trading with Russia could face a 100% tariff.
Meanwhile, market volatility is being amplified by speculation over Fed Chair Powell’s potential dismissal, as attacks against him intensify from Trump and his allies. Deutsche Bank warned that Powell’s removal could trigger sharp swings in both the dollar and bond markets.
DXY has extended its two-week rally after testing the recent low, approaching the 98.00 threshold. The index remains within the ascending channel, indicating the potential continuation of bullish momentum. If DXY breaches above the resistance at 98.25, the index could gain upward momentum toward 98.60. Conversely, if DXY breaks below the support at 97.60, the index may retreat to 97.00.
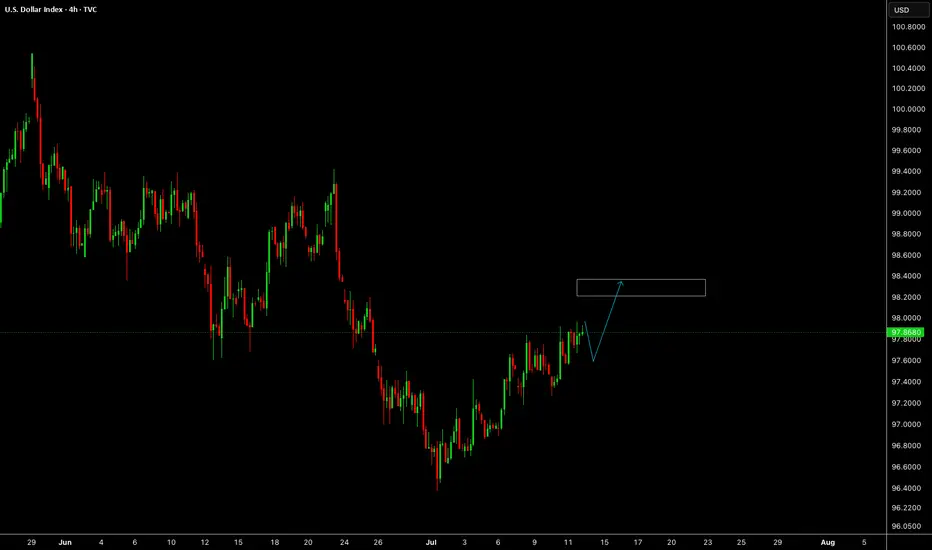
DOLLAR PUSHING HIGHERPrevious week high has taken by a bullish move. Market printed a nice 4H imbalance which shows the potential of the market to go further higher.

The Gold Retrace for Ultimate Entry!looking for price to continue with its pullback to find where exactly support is. Once we see price establish support we should get some type of signal for entry and price can continue with this bullish price action to make new highs. If we get a full 71.8% pullback that should make for a nice bull run. Just need to wait for the confirmations first before reacting cause we might get a lot of chop until then.

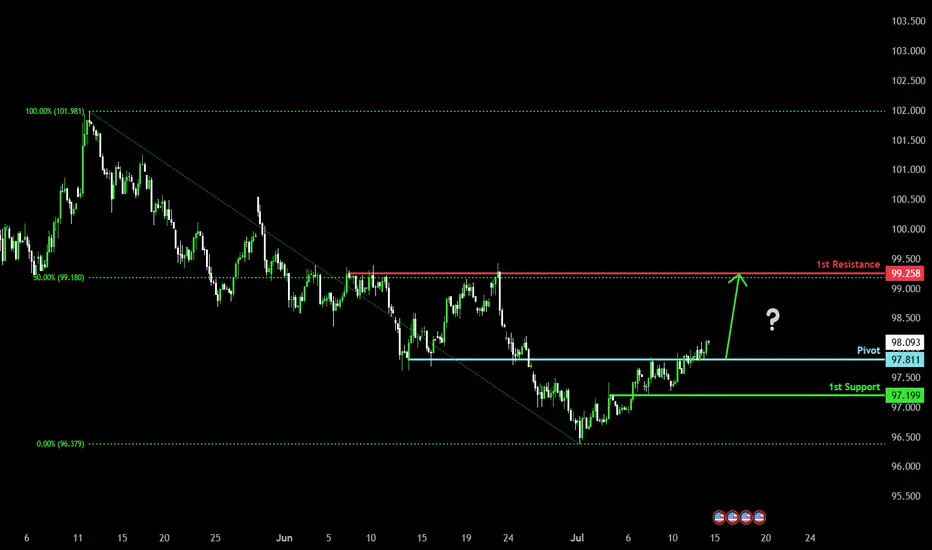
Potential bullish rise?US Dollar Index (DXY) has reacted off the pivot and could rise to the 50% Fibonacci resistance.
Pivot: 97.81
1st Support: 97.19
1st Resistance: 99.25
Risk Warning:
Trading Forex and CFDs carries a high level of risk to your capital and you should only trade with money you can afford to lose. Trading Forex and CFDs may not be suitable for all investors, so please ensure that you fully understand the risks involved and seek independent advice if necessary.
Disclaimer:
The above opinions given constitute general market commentary, and do not constitute the opinion or advice of IC Markets or any form of personal or investment advice.
Any opinions, news, research, analyses, prices, other information, or links to third-party sites contained on this website are provided on an "as-is" basis, are intended only to be informative, is not an advice nor a recommendation, nor research, or a record of our trading prices, or an offer of, or solicitation for a transaction in any financial instrument and thus should not be treated as such. The information provided does not involve any specific investment objectives, financial situation and needs of any specific person who may receive it. Please be aware, that past performance is not a reliable indicator of future performance and/or results. Past Performance or Forward-looking scenarios based upon the reasonable beliefs of the third-party provider are not a guarantee of future performance. Actual results may differ materially from those anticipated in forward-looking or past performance statements. IC Markets makes no representation or warranty and assumes no liability as to the accuracy or completeness of the information provided, nor any loss arising from any investment based on a recommendation, forecast or any information supplied by any third-party.
Gold and DXY. Day before CPI 14.07.2025, MondayExplaining about the thoughts on CPI. Expect major movements on GOLD

DXY: The Market Is Looking Up! Long!
My dear friends,
Today we will analyse DXY together☺️
The in-trend continuation seems likely as the current long-term trend appears to be strong, and price is holding above a key level of 97.463 So a bullish continuation seems plausible, targeting the next high. We should enter on confirmation, and place a stop-loss beyond the recent swing level.
❤️Sending you lots of Love and Hugs❤️

DXY Weekly Update — July 14, 2025⌛ Timeframe:
.
📆 Analysis Date: July 14, 2025
.
🎯 Weekly Bias: Bearish-to-Neutral (Potential for retracement or reversal)
🔎 Market Overview:
⬇️ Persistent USD Weakness:
DXY has dropped nearly 10% YTD, marking the steepest half-year decline since 1986.
📉 Rate Cut Expectations:
Markets are pricing in a potential 75bps rate cut by the Fed in H2 2025, pushing yields and the dollar lower.
📦 Trade War Fears:
Renewed tariff risks (targeting EU, Japan, Mexico, South Korea) aren't boosting demand for USD — a signal of lost safe-haven appeal.
⚖️ Central Bank Diversification:
Global reserve managers are rotating into gold and away from USD, weakening long-term structural demand.
🌀 Sentiment & Risk Appetite:
💸 Liquidity Demand is Soft:
DXY is retesting a 4H fair value gap (97.10–97.30), suggesting potential short-term consolidation or correction.
🌍 Risk-On Mood Returns:
According to Goldman Sachs, the USD is trading more like a "risk asset" than a haven, aligning with rising equity appetite.
📉 Technical Landscape:
🟠 4H Structure:
If DXY breaks below 97.00, next support lies at 96.37, followed by 95.50–96.00.
Consolidation expected if price remains within the FVG.
🔻 Key Resistance:
97.70–98.20 zone. A break above this area could change the tone to bullish.
📌 Summary:
🔷 Fundamentals show long-term dollar weakening (rates, trade tension, reserve shifts)
🔷 Sentiment aligns with risk-on appetite and reduced USD demand
🔷 Technicals at critical level; break below 97.00 opens room for correction, break above 97.70 shifts bias bullish
.
.
.
.
🟠 Bias: Bearish to Neutral
Watch Levels: 97.00 support, 97.70–98.20 resistance
⚠️ Note: This analysis is for educational purposes only and is not financial advice. Always apply risk management.
✅ If you like this analysis, don't forget to like 👍, follow 🧠, and share your thoughts below 💬!

DXY Potential DownsidesHey Traders, in today's trading session we are monitoring DXY for a selling opportunity around 98.300 zone, DXY is trading in a downtrend and currently is in a correction phase in which it is approaching the trend at 98.300 support and resistance area.
Trade safe, Joe.
New Week on Gold! Will the Bullishness continue?I was bullish on gold and price ended up doing as expected last week and looking for it to continue this week. But i have to sit on hands for now to see how they want to play Monday. Will they move to create a Low for the week first? or will they break out to start early on new highs? I have to see some type of confirmation first. Then we can get active.

Dollar Index Seems BullishFrom the previous week candle we see that Dollar Index has closed bullish. And in this scenario we can expect Dxy to go further higher. It has hit the previous week high and touched supply zone residing above. The two possibilities have shown in the chart are
1: After touching supply zone we expect to have deeper pullback.
2: It will have short retracement and then continues hgiher.

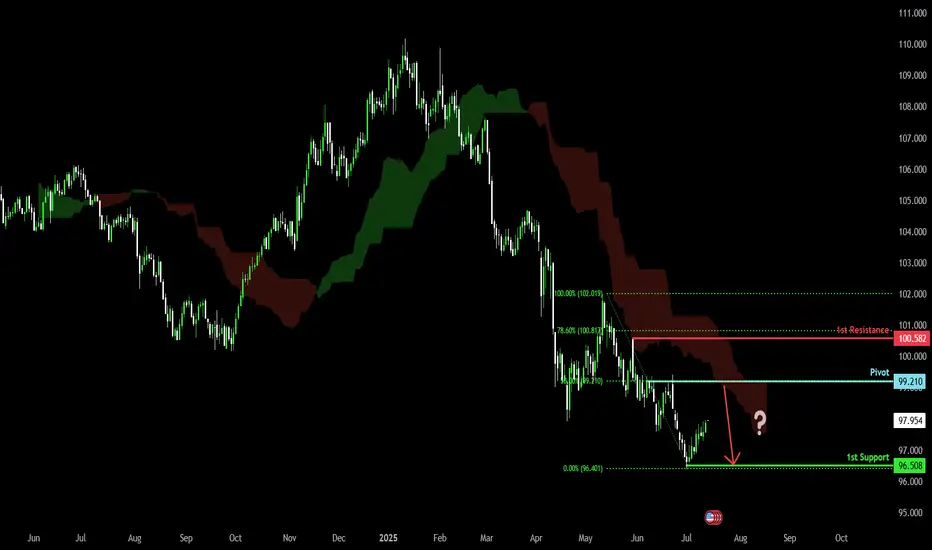
Bearish continuation?US Dollar Index (DXY) is risng towards the pivot which is a pullback resistance and could drop to the 1st support.
Pivot: 99.21
1st Support: 96.50
1st Resistance: 100.58
Risk Warning:
Trading Forex and CFDs carries a high level of risk to your capital and you should only trade with money you can afford to lose. Trading Forex and CFDs may not be suitable for all investors, so please ensure that you fully understand the risks involved and seek independent advice if necessary.
Disclaimer:
The above opinions given constitute general market commentary, and do not constitute the opinion or advice of IC Markets or any form of personal or investment advice.
Any opinions, news, research, analyses, prices, other information, or links to third-party sites contained on this website are provided on an "as-is" basis, are intended only to be informative, is not an advice nor a recommendation, nor research, or a record of our trading prices, or an offer of, or solicitation for a transaction in any financial instrument and thus should not be treated as such. The information provided does not involve any specific investment objectives, financial situation and needs of any specific person who may receive it. Please be aware, that past performance is not a reliable indicator of future performance and/or results. Past Performance or Forward-looking scenarios based upon the reasonable beliefs of the third-party provider are not a guarantee of future performance. Actual results may differ materially from those anticipated in forward-looking or past performance statements. IC Markets makes no representation or warranty and assumes no liability as to the accuracy or completeness of the information provided, nor any loss arising from any investment based on a recommendation, forecast or any information supplied by any third-party.
Gold | Oil | Dollar | Silver | Natural Gas July 2025 Forecast.Gold | Oil | Dollar | Silver | Natural Gas July 2025 Forecast.
NYMEX:NG1! COMEX:GC1! COMEX:SI1! NYMEX:CL1!

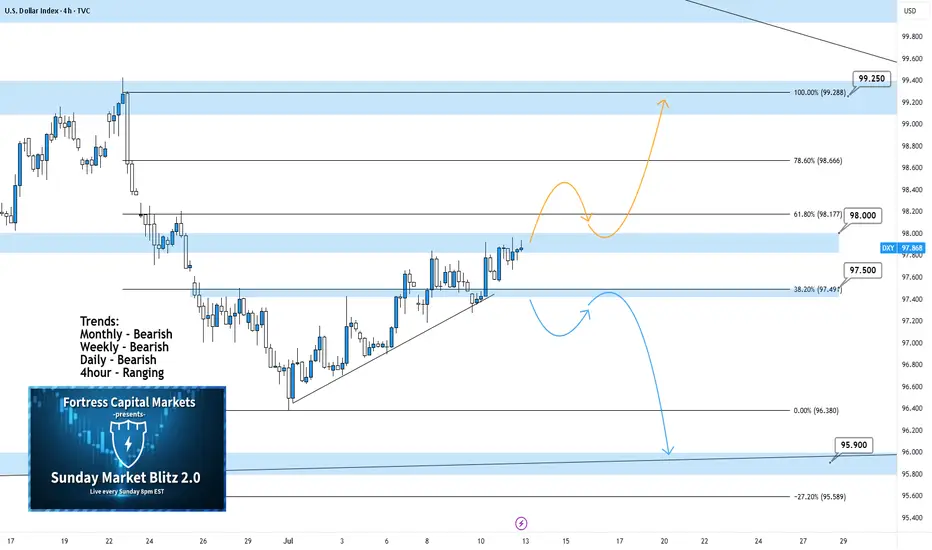
DXY 4Hour TF - July 13th, 2025DXY 7/13/2025
DXY 4hour Neutral Idea
Monthly - Bearish
Weekly - Bearish
Dailly - Bearish
4hour - Ranging
Keep in mind, we analyze and follow DXY more so as an indicator. The USD makes up for a large portion of trade so it makes sense to analyze it.
Going into this week we can see DXY made an attempt to push higher. Where it closed on Friday is a major zone around 98.000. We’re still majorly bearish on higher time frames so we will keep that in mind throughout this week.
As always, we will mark up two potential paths for this week, they are as follows:
Bullish Breakout - The two main zones we want to bring out attention to are 98.000 resistance and 97.500 support. We will have to wait until price action leaves this area to spot a high quality setup. Look for a convincing push above 98.000 resistance followed by a retest of 98.000 but as support. Look for a higher low to form with bullish confirmation to long on.
Bearish Continuation- Going bearish is still very possible we just need to clear 97.500 support first. Look for a break below 97.500 with a confirmed lower high and convincing bearish setups to short on.
Tariff Wars Pushing USD HigherThis is the Weekly FOREX Forecast for the week of July 14 - 18th.
In this video, we will analyze the following FX market: USD Index
The latest headlines tell the story. The tariffs are triggering a slow run to the USD safe haven, but the inflows from investors are moving the needle. The previous week closed strong, with buyers in control. There's a good chance we'll see more of the same this coming week.
Look for the strength in USD to continue to be supported by fundamental news, and outperform the other major currencies.
Buy USDxxx
Sell xxxUSD
Enjoy!
May profits be upon you.
Leave any questions or comments in the comment section.
I appreciate any feedback from my viewers!
Like and/or subscribe if you want more accurate analysis.
Thank you so much!
Disclaimer:
I do not provide personal investment advice and I am not a qualified licensed investment advisor.
All information found here, including any ideas, opinions, views, predictions, forecasts, commentaries, suggestions, expressed or implied herein, are for informational, entertainment or educational purposes only and should not be construed as personal investment advice. While the information provided is believed to be accurate, it may include errors or inaccuracies.
I will not and cannot be held liable for any actions you take as a result of anything you read here.
Conduct your own due diligence, or consult a licensed financial advisor or broker before making any and all investment decisions. Any investments, trades, speculations, or decisions made on the basis of any information found on this channel, expressed or implied herein, are committed at your own risk, financial or otherwise.

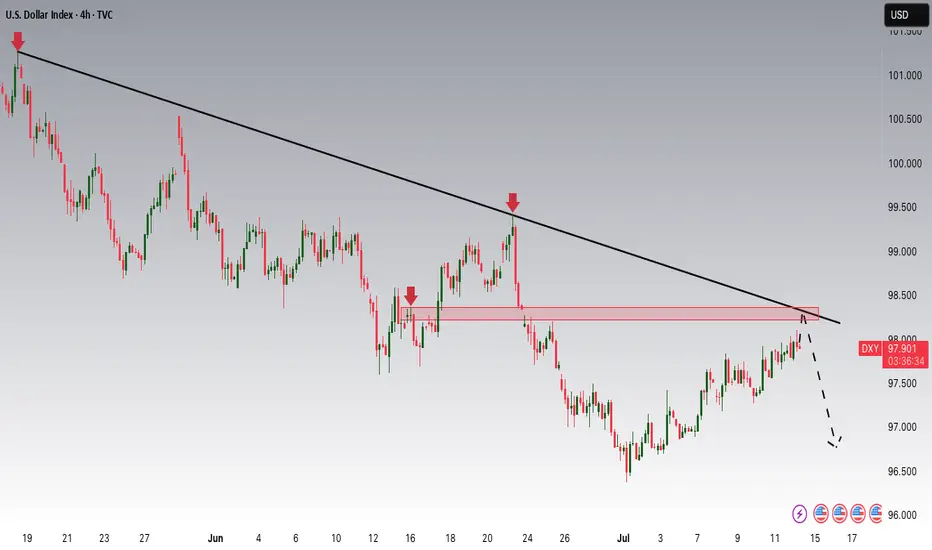
DXYDXY is still having some more correction to the upside before the major drop.
Disclosure: We are part of Trade Nation's Influencer program and receive a monthly fee for using their TradingView charts in our analysis.
USD/JPY - H1- Wedge Breakout (07.07.2025)The USD/JPY pair on the H1 timeframe presents a Potential Buying Opportunity due to a recent Formation of a Wedge Breakout Pattern. This suggests a shift in momentum towards the upside and a higher likelihood of further advances in the coming hours.
Possible Long Trade:
Entry: Consider Entering A Long Position around Trendline Of The Pattern.
Target Levels:
1st Resistance – 148.00
🎁 Please hit the like button and
🎁 Leave a comment to support for My Post !
Your likes and comments are incredibly motivating and will encourage me to share more analysis with you.
Best Regards, KABHI_TA_TRADING
Thank you.
Disclosure: I am part of Trade Nation's Influencer program and receive a monthly fee for using their TradingView charts in my analysis.
