Possible Dollar Weakness ... Lets watch for FundementalsIm just keeping my eyes peeled ...
If Dollar shows weakness, watch for EURUSD & GBPUSD pairs to go long temporarily
Dxy_short


Do you believe we are going to have a false breakthrough? Not an idea. Just interested of traders feedback regarding probable move of DXY. Be carefully in all of your trades.

DXY 4 H LongDXY 4H Long
Resistance: 98,25 - 98,40
Support: 97,60 -97,40
This is not investment advice


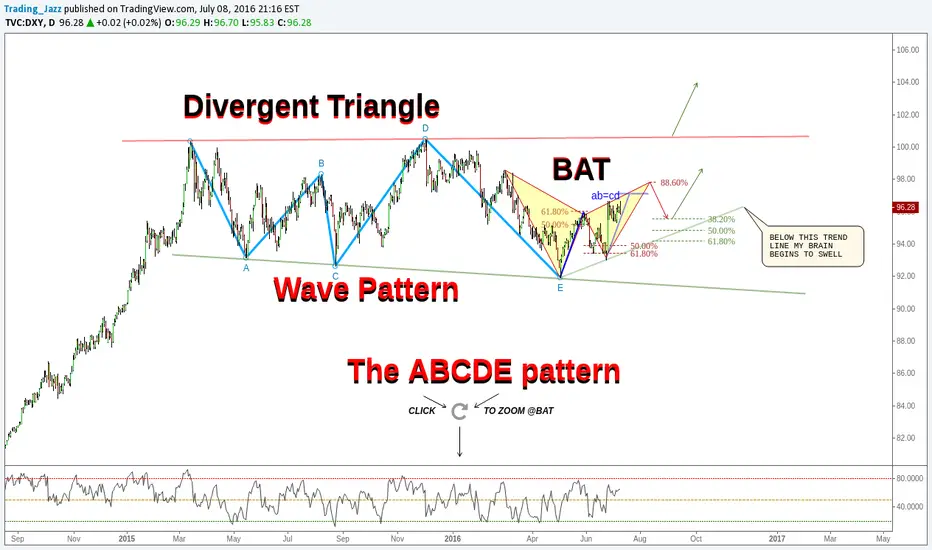
(Daily) Divergent Triangle Wave PatternTVC:DXY
Unfortunately i do not have an educational "chart" about these patterns ;), possibly soon, at any pharmacy near you... ;)
Safe Trades.


Short DXY longer term to 93 level.Currently trading in a downwards trend with the trend lines converging into the 93 level. FOMC meeting notes on Wednesday (17th August) could provide a catalyst in either direction within the downwards wedge formation.
This is not an open trade, but a cross analysis for long positions I have in precious metals.

Head and shoulder found in DXYHead and shoulder found in DXY, short if neck line breaks.. Also the stoch is moving towards down so better place to short after the break of neckline.

DXY - Short rally before the bears take controlI'm anticipating a short rally on Monday before the bears take control and we firstly re-test 95.50 before heading back down towards the trendline at 93.80.
A short entry at 96.60 will give me a 1.1:1 R/R shooting for 95.50 with stops moved to break even at this level for a risk free trade.

Potential Bearish Nen-Star Pattern with Negative MACD DivergenceWhat do you think?
ANYTHING CAN HAPPEN!

(D) The Three Drives Pattern // Structure vs PatternsTVC:DXY
Inverted with my previous published idea for FX:EURUSD , link below...
Wait for rsi overbought condition and divergence:
Safe Trades;

DXY indicates short comingHere is what I see:
Confluence of Fibonacci extensions:
green fib 1st impulse 1.618 extension
red fib 2nd impulse 1.618 extension
yellow fib last impulse
blue fib retracement of the HTF move down
purple fib where it may go. We need to finish the up move to properly place this fib.
Other factors: two trend lines because a wicked wick which I chose to disregard but does have some merit.
Strong area of resistance above.
What to look for: A sharp retracement back below the green trend line should indicate the current move is coming to and end with a fairly good retracement back below 94.50. This could also be the start of Z wave so a retest of the 92 and beyond.
A more gradual retracement above the TL would indicate a less intense retracement for another move up. I am suggesting this option would be towards the end of this week or early next week. Look for a break of that retracement for the next big move up.
Personally I am bullish on the DXY for the mid to long term. or until indicators tell me different.
Thank you for your views if you like the idea please let me know with a thumbs up or comment. If you don't like it I would welcome hearing your ideas and point of view. We are all always learning.


Reaching for LiquidityIf that next order block doesn't hold The Dollar looks likes it could be pushing for another leg up, reaching for liquidity just above 96.40 if it gets there. Could be looking at some divergence on the way up. Waiting for the Sell signal. Also, if you notice the times of all the arrows, do not think that is just coincidence do you? Institutional Order programs running their orders. Of course, it's not always the same but Wow pretty tight.
