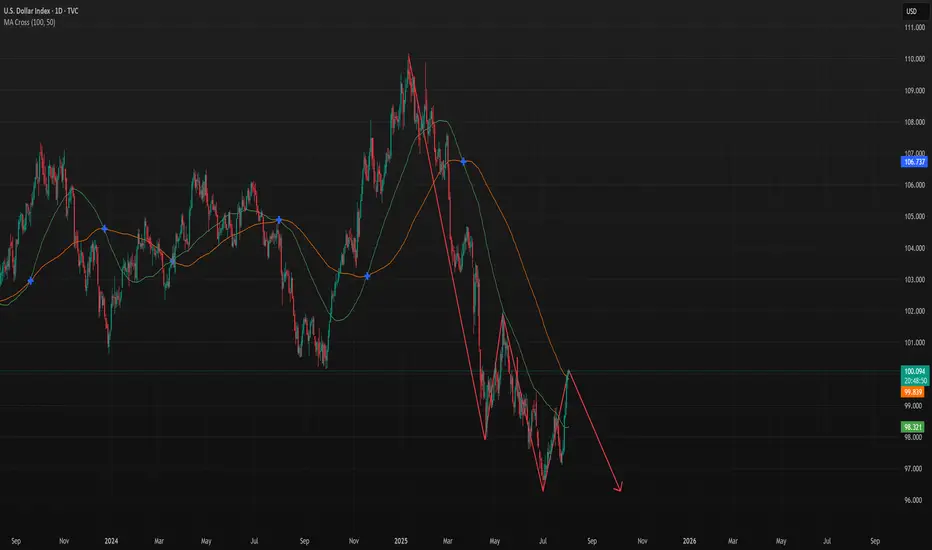
DXY - Possible Down Swing to continue furtherTVC:DXY
CMCMARKETS:USDCAD
OANDA:NZDUSD
CMCMARKETS:EURUSD
We may have a further down swing pattern forming let's continue to see if it passes the resistance area.
Dxyanalysis
Dollar Falls as Traders Price In Two 2025 Rate Cuts on Weak JobsDollar Falls as Traders Price In Two 2025 Rate Cuts on Weak Jobs Data
Introduction
In a significant turn of events for the global currency markets, the U.S. dollar has taken a sharp tumble as traders brace for a more dovish Federal Reserve. A weaker-than-expected U.S. employment report for July 2025 has prompted market participants to price in two interest-rate cuts by the Fed before the end of the year. This shift in monetary policy expectations comes during a time of heightened global uncertainty, much of it triggered by President Donald Trump's aggressive trade policies, which have already disrupted the $7.5 trillion-a-day foreign exchange market.
The Bloomberg Dollar Spot Index, a key gauge of the dollar’s strength against major currencies, plunged as much as 1%—marking its worst single-day performance since April 21, 2025. The greenback’s decline was mirrored by strong gains in rival currencies, with the Japanese yen appreciating 2.2% and the euro climbing more than 1% against the dollar.
This article delves into the recent developments surrounding the U.S. dollar, the implications of weak jobs data, the Federal Reserve’s likely response, and how Trump’s trade policies are shaping the broader economic landscape.
________________________________________
Weak Jobs Data Sparks Policy Shift
The July 2025 employment report came in well below expectations. Non-farm payrolls growth fell short, and revisions for May and June showed fewer jobs were added than previously reported. These figures suggest that the U.S. labor market is cooling more rapidly than anticipated, raising concerns about the sustainability of the post-pandemic economic recovery.
According to Helen Given, a foreign exchange trader at Monex Inc., “It’s now clear that the U.S. labor market is cooling fairly sharply. There’s a good chance that Trump’s crusade against Chair Powell ratchets up further in the coming days, and there could be further losses for the dollar to come as a result.”
The disappointing employment data has led traders to adjust their expectations for U.S. monetary policy. Futures markets are now pricing in two 25-basis-point rate cuts by the end of 2025, a stark reversal from the earlier outlook that suggested the Fed would remain on hold or even consider tightening if inflation remained sticky.
________________________________________
The Federal Reserve’s Dilemma
The Federal Reserve now finds itself in a precarious position. On one hand, inflation has moderated in recent months, giving the central bank more room to maneuver. On the other hand, a weakening labor market could indicate a broader slowdown that might require immediate action to prevent a recession.
Fed Chair Jerome Powell has come under increasing political pressure from President Trump, who has publicly criticized the Fed for keeping rates too high. Trump argues that rate cuts are necessary to support U.S. exporters and counteract the negative effects of his own tariffs and trade restrictions.
Historically, the Fed has maintained its independence from political influence, but in an election year, the pressure to act can become intense. If the Fed moves to cut rates, it will be seen as responding to both economic data and political dynamics—a delicate balancing act.
________________________________________
The Global Currency Market Reacts
The ripple effects of the dollar’s decline are being felt across the globe. The $7.5 trillion-a-day foreign exchange market, already under strain from geopolitical uncertainty and shifting central bank policies, has seen increased volatility in recent weeks.
The Japanese yen, often viewed as a safe-haven currency, surged 2.2% against the dollar following the release of the jobs data. Meanwhile, the euro gained over 1%, reflecting investor sentiment that the greenback’s era of dominance may be waning—at least for now.
Emerging market currencies also found some relief, as a weaker dollar generally eases pressure on countries with large dollar-denominated debts. However, the overall picture remains complex, as trade tensions and capital flow volatility continue to weigh on risk sentiment.
________________________________________
Trump’s Trade Policies: A Double-Edged Sword
President Trump’s trade strategies have been a central feature of his second term in office. From imposing tariffs on Chinese imports to renegotiating trade agreements with the European Union and Canada, Trump has sought to reshape the global trading system in favor of American manufacturers.
Yet these policies have produced mixed results. While some sectors have benefited from protectionist measures, others—particularly those reliant on global supply chains—have suffered from rising costs and retaliatory tariffs. The uncertainty generated by these policies has also dampened business investment, slowed global trade, and disrupted financial markets.
“The dollar had tumbled this year as Trump’s aggressive trade policies rocked the $7.5 trillion-a-day currency market, weighing on global growth outlook,” Bloomberg reported.
Investors are increasingly concerned that continued trade friction, combined with growing political pressure on the Fed, could lead to policy missteps that undermine the U.S. economy and erode confidence in the dollar.
________________________________________
Market Implications
The dollar’s recent decline has far-reaching implications for various asset classes:
1. Equities
U.S. equities have shown mixed reactions. While lower interest rates are typically supportive of stock prices, the underlying reason—economic weakness—has investors on edge. Sectors such as technology and consumer discretionary are expected to benefit from cheaper borrowing costs, but cyclical sectors may struggle if growth slows further.
2. Bonds
Treasury yields have fallen sharply as traders anticipate rate cuts. The 10-year yield dropped below 3.8%, its lowest level in months. The yield curve has also flattened, a potential warning sign of slowing economic momentum.
3. Commodities
A weaker dollar typically supports commodity prices, as most are priced in dollars. Gold, oil, and industrial metals all saw gains in the wake of the jobs report. However, demand-side concerns stemming from a global slowdown could limit the upside.
4. Emerging Markets
For emerging markets, a softer dollar offers both relief and risk. On the positive side, it reduces debt servicing costs and can attract capital flows. On the negative side, if the dollar’s weakness reflects a broader global slowdown, risk appetite could remain subdued.
________________________________________
Looking Ahead: What to Watch
As markets digest the latest economic data and policy signals, several key developments will be closely monitored:
1. Upcoming Fed Meetings
The Federal Open Market Committee (FOMC) will meet again in September. Markets will be keenly watching for any changes in tone or new forward guidance. A rate cut in September now appears increasingly likely, especially if subsequent data confirms a labor market slowdown.
2. Inflation Trends
While inflation has moderated, it remains a key concern for policymakers. If inflation rebounds unexpectedly, it could complicate the Fed’s ability to cut rates without stoking price pressures.
3. Geopolitical Risks
Trade tensions, particularly with China and the EU, remain unresolved. Any escalation could further destabilize markets and weigh on the dollar. Additionally, developments in the Middle East, Eastern Europe, and Southeast Asia could add to the uncertainty.
4. U.S. Presidential Politics
With the 2026 presidential election campaign already underway, Trump’s rhetoric and policy decisions will continue to influence market sentiment. His ongoing criticism of the Fed could erode confidence in U.S. institutions, particularly if it leads to perceived politicization of monetary policy.
________________________________________
Conclusion
The sharp fall in the U.S. dollar following weak July jobs data marks a pivotal moment in 2025’s economic narrative. With traders now pricing in two Federal Reserve rate cuts by year-end, the stakes have never been higher for policymakers, investors, and political leaders.
While a softer dollar can provide some temporary relief to exporters and boost inflation expectations, it also reflects deeper concerns about the strength of the U.S. economy and the unintended consequences of aggressive trade policies. President Trump’s confrontational approach to global trade, combined with mounting pressure on the Fed, is creating a complex and potentially volatile environment for markets.
As the year progresses, all eyes will be on the Federal Reserve’s response, the resilience of the U.S. labor market, and the evolving political landscape. In a world where headlines can move markets in seconds, clarity, stability, and sound policy have never been more critical.
________________________________________
Disclaimer: This article is for informational purposes only and does not constitute financial or investment advice.
DXY Bulls Ready — Can Powell Spark the Rally?📊 DXY Pre-FOMC Outlook
In my previous analysis released on Monday, I expected the Dollar Index to fill the gap around the 98.60 zone and range below the key red line at 99.429.
Now, with less than 8 hours left until the highly anticipated FOMC rate decision, it’s time to take a closer look at tonight’s event and what it could mean for the markets.
From a purely technical perspective — setting the news aside — the Dollar Index looks ready to break through the crucial 100 level and kick off a strong bullish rally.
However, recent political pressure from Trump urging rate cuts, along with visible tension between him and Fed Chair Jerome Powell, has created uncertainty. If it weren’t for these conflicting signals, I would’ve confidently expected a clean breakout above 100.
As much as I enjoy trading news-driven events, I’ll likely stay out of the market tonight and observe from the sidelines. The setup is tempting, but the dual narratives make it risky.
That said — if you ask for my final take — I believe the stage is fully set for a bullish dollar and a corresponding drop in gold, EUR, GBP, and other major assets.
Let’s see how it plays out. 👀💥

DXY still in downward channel. Rejection here = BTC rally The DXY is still in a downward sloping channel and trying to break back above the previous 2-year cycle low, but I think will reject here and kick off the next leg of the BTC rally.
Ideally we get a big DXY drop and ultimately break below the 95% level and on down into 'Bitcoin Super Rally Zone'🚀

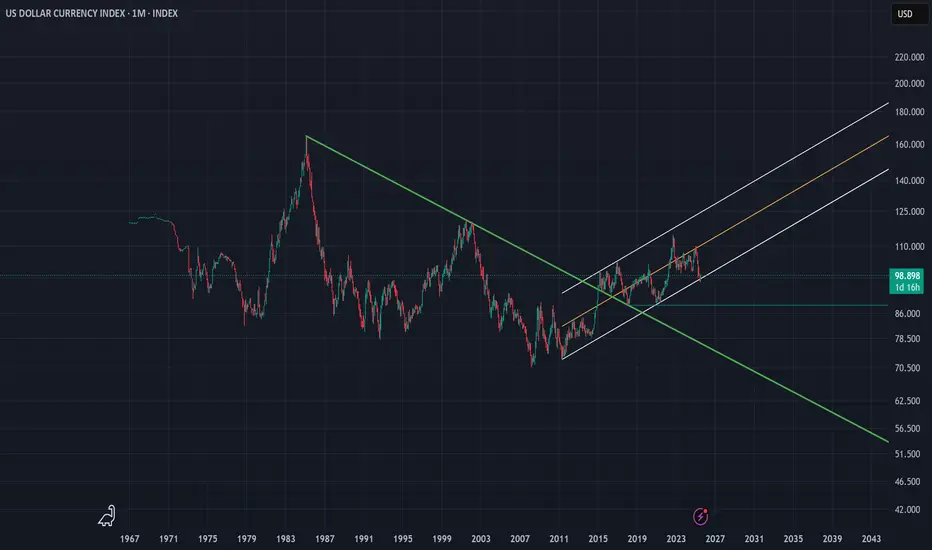
DXY | Timeframe: 1MWith the breakout of the downtrend line drawn since 1985 and its breach in late 2014, the DXY index officially entered a relatively stable upward trend and is currently oscillating within a parallel channel. Although, on the monthly timeframe, it has recently touched the lower boundary of the channel, we can expect at least a rise toward the channel’s midline. However, if the lower support of the channel is broken, a static support around the approximate rate of 88 can be considered a notable support level. Should this support also fail, the long-term downtrend dating back to 1985 would be regarded as the most important support for the DXY index. Meanwhile, moving averages such as the MA50, MA100, and other longer-period moving averages serve as dynamic supports along the way.
It is also worth mentioning that currently reaching the 120 level is considered an ideal target for the DXY index, and ultimately, it is by breaking this resistance zone that the index can reach its “Utopia”.
---------
I will try to continuously update this analysis of the TOTAL symbol according to market changes and developments. Also, I welcome reading your critiques and comments, so don’t forget to leave a comment!
Dollar Index - Expecting Bullish Continuation In The Short TermH4 - Strong bullish momentum followed by a pullback.
No opposite signs.
Until the two Fibonacci support zones hold I expect the price to move higher further.
If you enjoy this idea, don’t forget to LIKE 👍, FOLLOW ✅, SHARE 🙌, and COMMENT ✍! Drop your thoughts and charts below to keep the discussion going. Your support helps keep this content free and reach more people! 🚀
--------------------------------------------------------------------------------------------------------------------

US Dollar Index (DXY) Reaches One-Month HighUS Dollar Index (DXY) Reaches One-Month High
The US Dollar Index (DXY) has risen to its highest level since early July. According to media reports, the bullish sentiment in the market is driven by the following factors:
→ Optimism around US trade agreements. A new trade deal with the EU — which includes a 15% tariff on European goods — is being perceived by the market as favourable for the United States.
→ Confidence in the resilience of the US economy. Strong Q2 corporate earnings have acted as an additional bullish catalyst. Investors may have started covering short positions against the dollar, viewing concerns over a US slowdown as overstated.
→ Expectations that the Federal Reserve will keep interest rates on hold.
From a technical standpoint, today’s DXY chart reflects strengthening bullish momentum.
Technical Analysis of the DXY Chart
Two U-shaped formations (A and B) that developed over the summer have created a bullish сup and рandle pattern — a formation that suggests waning bearish pressure, as evidenced by the shallower second dip.
This setup points to the potential for a bullish breakout above the trendline (marked in red) that has defined the downward movement in the DXY throughout the first half of 2025.
As previously analysed, there are signs that the dollar index may have found a base following a period of decline. This could indicate a shift in market sentiment and the possible end of the recent bearish phase.
This article represents the opinion of the Companies operating under the FXOpen brand only. It is not to be construed as an offer, solicitation, or recommendation with respect to products and services provided by the Companies operating under the FXOpen brand, nor is it to be considered financial advice.
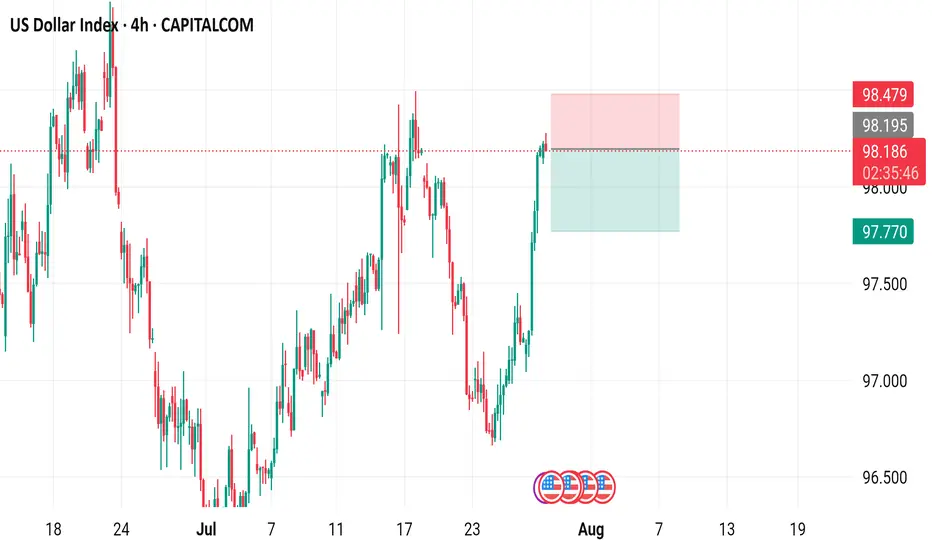
US Dollar Index (DXY) - 4 Hour Chart4-hour chart from CAPITALCOM displays the recent performance of the US Dollar Index (DXY), showing a current value of 98.190 with a slight decline of 0.009 (-0.01%). The chart highlights key price levels, including a recent sell signal at 98.189 and a buy signal at 98.243, with a resistance zone marked between 98.195 and 98.479. The index has experienced fluctuations, with notable drops and recoveries, and is currently trending near the 98.190 level as of July 29, 2025.
DXY at Its Most Critical Level of 2025 — Will the 100 Bank LevelThe Dollar Index (DXY), just like several other majors, is approaching a very important level. We’re now near the 100 mark, which is not only a psychological level — but also a key institutional (bank) level.
There’s also a gap zone left behind that price is about to fill. I believe the index will stay in a range over the next 1–2 days as it waits for critical data later this week — especially Wednesday’s announcements and Friday’s NFP report, which could set the tone for what’s next.
Based on current market sentiment, Trump’s remarks, Powell’s upcoming speech, and broader macro factors, I believe DXY has the potential to break above 100 and move toward 102–104, if that level is broken cleanly.
Let’s also not forget — price bounced from a monthly demand block near 96, and we’re seeing weak support across majors like EUR and Gold. That adds confluence for potential dollar strength.
📌 What do you think — is dollar strength just around the corner?
🔁 This analysis will be updated whenever necessary.
Disclaimer: This is not financial advice. Just my personal opinion.
Analysis on the DXY – EURUSD RelationshipHello traders,
Here’s an analysis that can be useful for both short-term and swing trades on EURUSD and DXY. Our trading team’s calculations are as follows:
Analysis on the DXY – EURUSD Relationship
Currently, DXY is at 98.200. Historical statistical data indicate that if DXY declines toward 96.300, there is approximately a **1.55% probability of an upward move** in EURUSD.
Based on this scenario:
Current EURUSD level: 1.16500
Projected target level:1.1830
While the correlation data show a strong inverse relationship, it’s important to note that periodic deviations can occur in the market. Therefore, this analysis should be considered a statistical projection only, not a guaranteed outcome.

DXY forecast From weekly view the DXY is looking bearish at least till 95.123 key level the will see if we get a bullish power as the DXY is forming a reversal pattern. But of course many factors plays part in this economy, for example, global news like Tariffs and other factors.
So when DXY is trading on the 95.123 key level additional confluence will give us the right to put on trades, as the 95.123 key level is significant for what will take place next.
Take you all.......

DXYDXY needs some more correction, if the correction is completed before Feds decision then a drop can follow otherwise Feds will push it up and NFP will drop it again.
Disclosure: We are part of Trade Nation's Influencer program and receive a monthly fee for using their TradingView charts in our analysis.
US Dollar Index - 4h Chart (CAPITALCOM)4-hour chart of the US Dollar Index (DXY) from CAPITALCOM shows the index's recent price movements. The current value is 96.955, with a slight increase of 0.054 (+0.06%). Key levels include a support at 96.413 and resistance at 97.554. The chart highlights buy signals at 97.012 and sell signals at 96.958 and 96.955, with a notable downward trend breaking below a support zone around 97.150.

US Dollar Breakdown – Don’t Fight the FloodSince the start of the year, after forming a small double top around the 110 zone, the US Dollar Index (DXY) has followed only one direction: down.
So far, we’re seeing a decline that’s approaching 15%, with the index breaking multiple major support levels along the way. And judging by the current structure, there’s little reason to believe this trend will reverse any time soon.
________________________________________
🔍 Short-Term View – Flag Break, More Losses Ahead
Zooming in, we can observe that the last rally was purely corrective — a typical bear flag formation. That flag is now broken to the downside, which confirms renewed bearish pressure and suggests that further losses are likely even in the short term.
________________________________________
🎯 What’s Next?
The next major support zone sits around 95, a level that should act as a magnet if the current trend continues.
As long as price stays under 100 ZONE, the outlook remains bearish and the strategy should align with that bias.
________________________________________
✅ Strategy Going Forward
The safe and logical approach now is to buy dips on major USD pairs:
EURUSD, GBPUSD, AUDUSD, and NZDUSD
________________________________________
📌 Final Thought
The structure is clear, momentum favors the downside, and the market is offering clean setups across multiple USD pairs.
Don’t fight the trend — follow the flow. 🟢

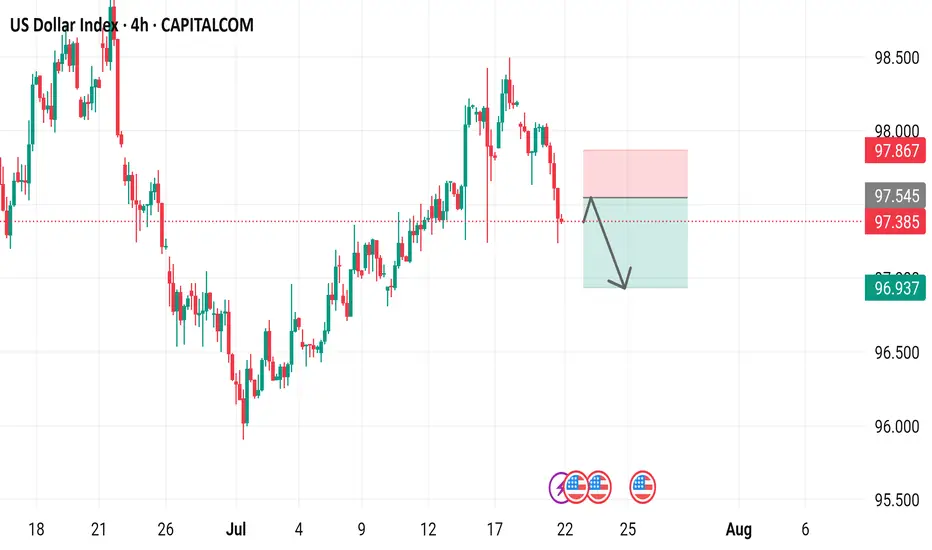
US Dollar Index 4-hour time frame, showcasing the US Dollar Index's performance over this period.
- The index is currently at 97.385, with a decrease of 0.636 (-0.65%) from its previous value.
- A red box indicates a "SELL" signal at 97.385, while a blue box suggests a "BUY" signal at 97.439.
- The chart includes various technical indicators, such as moving averages and relative strength index (RSI), to help traders analyze market trends.
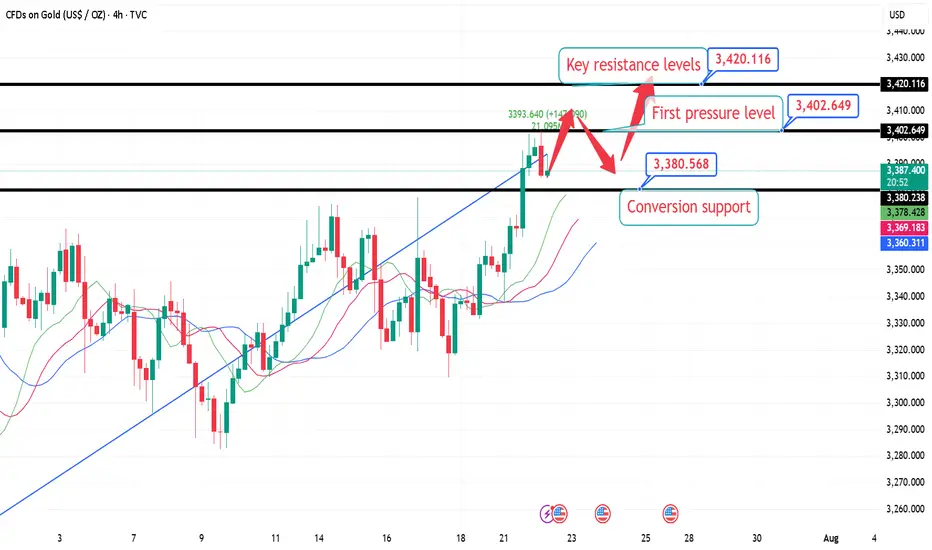
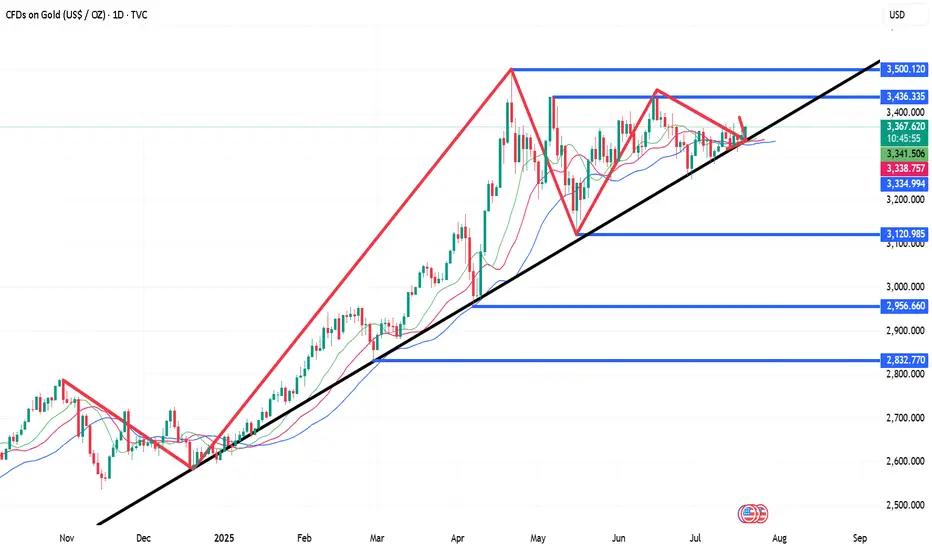
7.22 London Gold Market Analysis and Operation SuggestionsFrom the market perspective, the trend suppression line from the historical high of 3500 to the secondary high of 3452 has moved over time and is now around 3420, which can be used as an important resistance level reference for this week; the previous resistance level of 3376 can be converted into support after breaking through. For intraday short-term operations, focus on this range of callbacks and go long, wait for the key resistance level to be touched before going short, or see if there is an opportunity to arrange a mid-term short order based on the real-time trend.
Specific intraday operation ideas:
①. When the gold price falls back to around 3380, participate in long orders and call, protect the position of 3374, and first look at the position of 3402, the high point on Monday;
②. After yesterday's high point breaks, wait for a correction to around 3395 to continue to participate in long orders and call, protect the position of 3388, and look at the key suppression level of 3420;
③. (Aggressive orders, for those who are afraid of missing out) If you are short or have enough positions, you can first participate in long orders with a light position at the current price of 3388, and wait for 3380 to increase your position, and the target is the same as above.
Analysis of short-term gold trading on July 22Technical aspects:
From the daily candlestick chart, gold has recently shown signs of breaking upward after five weeks of sideways fluctuations. In terms of MACD indicators, the MACD bar chart has turned from green to red, and the fast and slow lines have formed a "golden cross", strengthening the expectation of a short-term technical rebound.
At the same time, the 14-day RSI index rebounded to 57.67, still in the neutral and strong area, and has not yet entered the overbought area, indicating that the price still has room to rise. Analysis shows that the middle track of the Bollinger Band 3342 constitutes initial support, while the strong support below is at the two previous lows of 3247.87 and 3120.64.
If the bulls maintain their advantage above the integer position of 3400, they are expected to hit the high point of 3451.14 in the short term, and even further test the historical high of 3499.83; on the contrary, if they fall back below 3342, the short-term upward momentum will be tested.
Bull analysis:
If gold successfully stands above 3400, the market will turn its attention to the two key resistance areas of 3451 and 3499, the high point of the year. Breaking through the former will open up the space to test the historical high upward; combined with the current MACD golden cross pattern, if the capital side and the fundamentals continue to cooperate, it is not ruled out that there will be a short-term accelerated rise.
Bear analysis:
If the breakthrough fails, especially if gold falls back below the middle track of Bollinger, the adjustment pressure will be restarted, and the lower edge of the previous consolidation range of 3300 will constitute an important support. If it falls below again, it is necessary to pay attention to the important technical support near 3247 and the 100-day moving average of 3180.
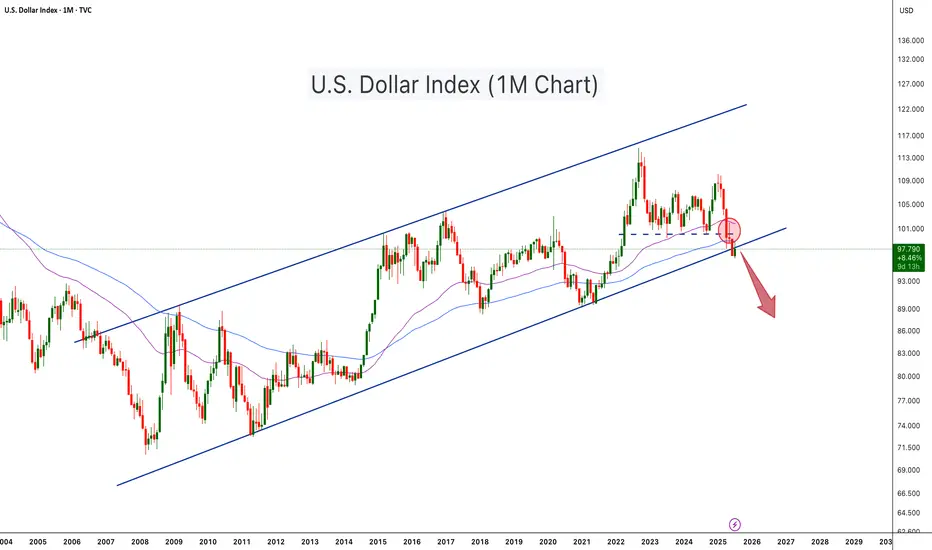
U.S. Dollar Index Loses Key Support – Crypto Bull Run Loading?The U.S. Dollar Index (DXY) has just broken below a long-term ascending channel, which has held since 2008. After losing the key horizontal support (~100 level), DXY retested and rejected from it (red circle), confirming a potential trend reversal. The move is technically significant and hints at further downside, possibly toward the 88–90 zone or lower.
This breakdown aligns with classic macro cycles, where a weaker dollar often fuels bullish momentum in risk assets, especially crypto. Historically:
-DXY downtrends in 2017 and 2020–2021 coincided with major Bitcoin and altcoin bull runs.
-DXY strength during 2018 and 2022 contributed to crypto bear markets.
With DXY now below both horizontal and diagonal support, Bitcoin and the broader crypto market may be entering the next expansion phase, especially if the dollar continues its downward trajectory
-DXY has broken below a 17 year rising channel – a macro bearish signal.
-Rejection from former support turned resistance confirms breakdown.
-A falling DXY historically corresponds with Bitcoin rallies and altseason expansions.
-Declining dollar strength could be the fuel that propels Bitcoin past $140K and Ethereum above $6K.
-A dollar bear trend may fuel total crypto market cap breakout beyond $4T+.
As DXY weakens, liquidity tends to rotate into risk-on assets like crypto. This setup mirrors pre-bull run environments seen in 2017 and 2020. A structural breakdown in the dollar could act as a catalyst for Bitcoin’s next major leg up.
Cheers
Hexa
7.22 Gold falls back and continues to be bullish, 3400 is not thFrom the 4-hour analysis, the short-term support below is 3370, the important support is 3350-55, and the upper resistance is 3400-05. The overall support during the day is to maintain the main tone of high-altitude and low-multiple cycles in this range. For the middle position, watch more and do less, be cautious in chasing orders, and wait patiently for key points to enter the market.

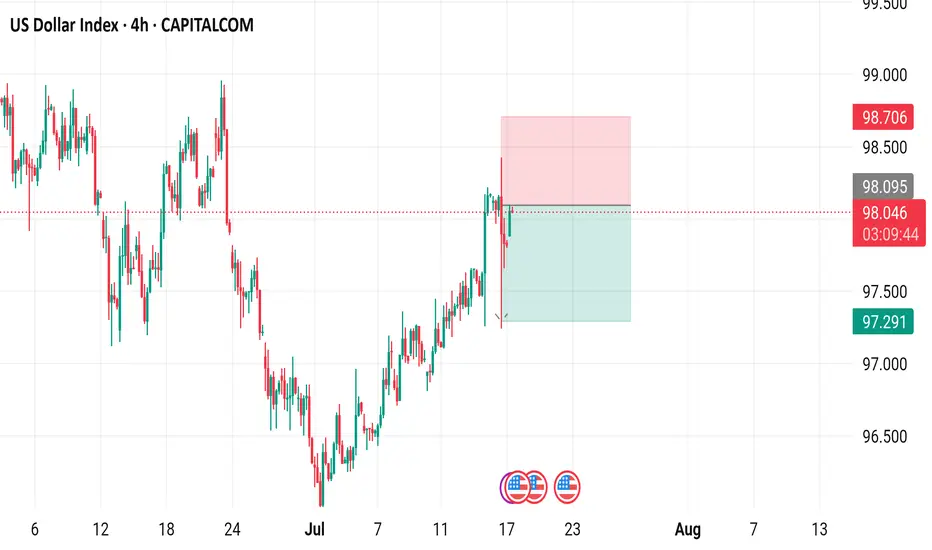
US Dollar Index (DXY) - 4 Hour Chart4-hour performance of the US Dollar Index (DXY) from CAPITALCOM, showing a current value of 98.040 with a 0.23% increase (+0.222). The chart includes recent buy and sell signals at 98.094 and 98.040, respectively, with a highlighted resistance zone around 98.706-99.000 and a support zone around 97.291-98.040. The timeframe covers data from early July to mid-August 2025.
Analysis of short-term operations of gold on July 21Daily Analysis:
On the daily chart, it can be seen that gold has rebounded from the main rising trendline again, and bargain hunters have set clear risks below the trendline, betting on a price rebound to the 3438 resistance level. Bears need the price to break below the trendline to open up space for a deeper correction, with the next target looking at the 3120 level.
4-hour analysis
On the 4-hour chart, it can be seen that there is a secondary resistance area near 3377. If the price rebounds to this level, it is expected that bears will intervene here and set risks above the resistance, with the goal of pushing the price below the main trendline. Bulls will look for the price to break through this resistance to increase their bullish bets on the 3438 level.
Buy first when gold falls back, and pay attention to the strengtGold went on a roller coaster ride last week. It rose to around 3377 at the beginning of the week and then fell back under pressure. After stabilizing near 3309 on Thursday, it strengthened again on Friday and came under pressure near 3361. It fell back slightly to around 3344 at the opening in the morning and is currently rising again. In the morning, pay attention to the opportunity to buy first after the pullback, pay attention to the strength of the European session, and pay attention to the pressure near 3378/80 on the upside.
