6.24 Gold safe haven fades and gold falls
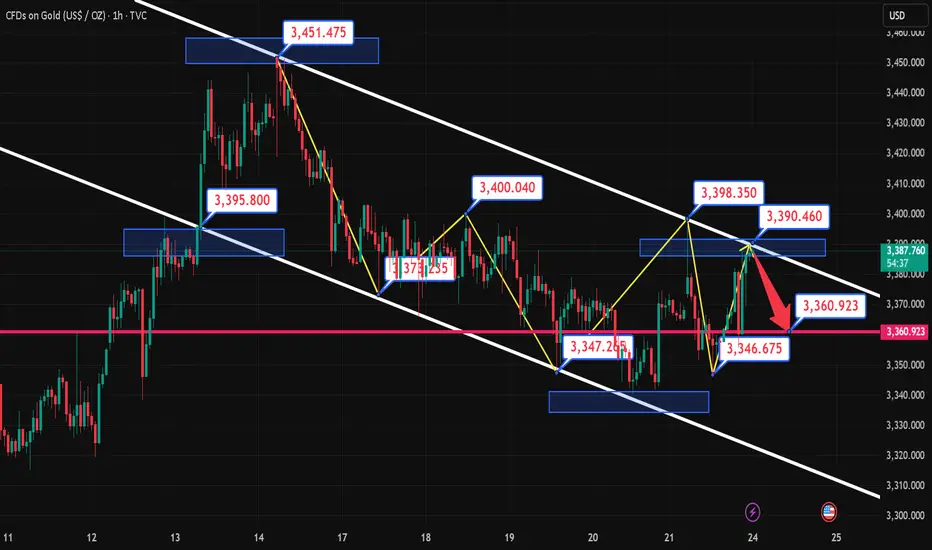
Technical aspect: After the gold price hit the 3400 integer mark overnight, it fell rapidly under the impetus of negative news. The overall fluctuation range is still within the 3330-3400 range we expected. This shows that the current market dominated by news lacks continuity. We make a golden section of the high and low points of the overnight decline to the current level, and the current position of 0.618 is 3370.
Pressure level: 3370\3375\3400
Support level: 3330\3300
Dxyanalysis

6.24 Gold resistance strengthens + kinetic energy exhaustionGold prices have fallen under pressure near $3,380 several times, and this area gathers three technical resistances:
1. The daily Bollinger band middle track 3,375 and the upper track 3,450 form a suppression.
2. The previous high of $3,400 plus the Fibonacci 38.2% retracement level constitutes a concentrated selling pressure area.
3. The previous high of $3,451 failed to break through effectively, forming a bearish structure with the second highest point moving down.
Risk of breaking the shock range: Gold continues to trade sideways in the 3,300-3,450 range, but the K-line continues to close in a small real body alternating yin and yang pattern, indicating that the long and short momentum is exhausted. If it falls below 3,350 , a technical sell-off will be triggered, with the target pointing to 3,300-3,330!
SELL: 3,388\3,393 Stop loss: 3,398
Target: 3,360
Profit point: 30
6.23 Gold Short-term Technical AnalysisStimulated by geopolitical conflicts such as the US airstrike on Iran's nuclear facilities on Monday, gold opened $24 higher at 3398 in the early trading. However, it failed to continue the upward trend and quickly fell back to the 3360-65 area. Retrieve all the gains!
Technical analysis: 4-hour head and shoulders top pattern: right shoulder 3373 neckline 3340 MACD dead cross diverges downward Bollinger band opening expansion and price running near the lower track, short-term trend is bearish, and the daily line is still in the rising channel!
Short-term operation:
SELL: 3375\3385 Stop loss: 3390
$1:3360 $2:3340
BUY: 3338\3345 Stop loss: 3353
$1:3380 $2:3400
Operation suggestion: High-altitude is the main, low-multiple is the radiation

6.23 Gold Short-term Technical GuidanceThe current price is in the double-line interval of 3350-3375 on the hourly chart. Please note that the four-hour lifeline 3368 is also the resistance point determined by the last rebound in the Asian session.
The Asian session fell under pressure and returned to the sweeping range. It was treated as a sweep. The European session was able to hold the 3350 mark. Look up to find the 3368 area, followed by 3375 and 3385-3388.
If the European session falls below and closes below 3350, the short-selling forces are dominant. The four-hour lifeline 3368 is used as suppression. Look down to find 3333-3331, followed by 3320-3315

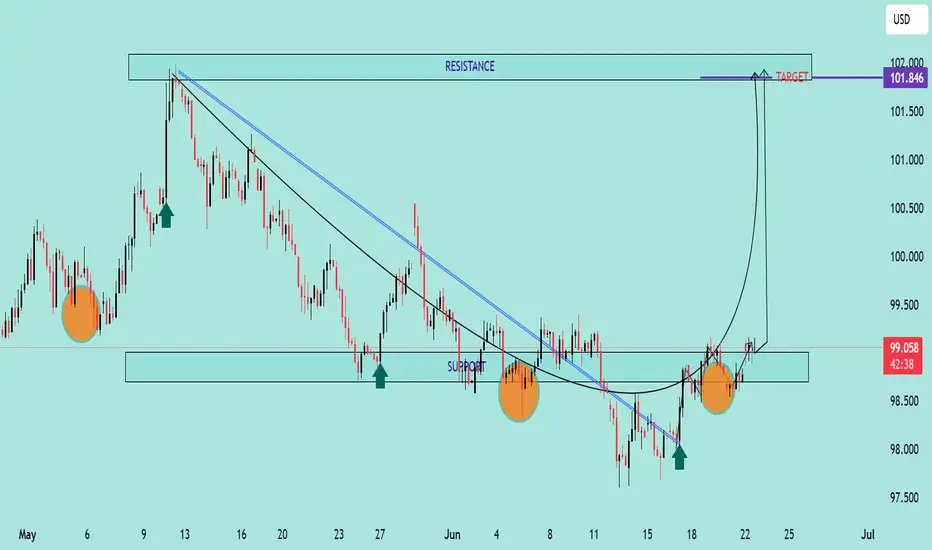
DXY Bullish Reversal & Cup Formation The DXY (US Dollar Index) is exhibiting a strong bullish reversal pattern, with multiple technical signals suggesting upward momentum:
🔍 Technical Analysis Summary:
✅ Support Holding Strong:
Price has respected the horizontal support zone around 98.00–98.50 on multiple occasions (highlighted by orange circles and green arrows), forming a solid base.
✅ Breakout from Downtrend:
A clear breakout above two descending trendlines (black and blue) indicates a shift from bearish to bullish sentiment.
✅ Cup Pattern Formation ☕:
A textbook Cup pattern is visible, where price formed a rounded bottom — a bullish continuation formation. The handle is minor and price has broken above the neckline (around 99.00), signaling a potential continuation toward the target.
✅ Bullish Target 🎯:
Based on the cup pattern and prior resistance, the projected target is around 101.846, aligning with previous major resistance.
📌 Key Levels to Watch:
Support Zone: 98.00 – 98.50
Immediate Resistance: 99.50 – 100.00
Major Resistance/Target: 101.846
🧭 Outlook:
As long as the price remains above the 98.50 zone, the bullish scenario remains intact. The cup breakout indicates strong buying pressure, and momentum could push DXY toward the 101.846 target in the coming sessions.
The DXY eince 1979 and Rate Rises / Cuts & the Crucial point NOW
What i want to draw your attention now, more than anything is simplay that DXY PA is on the line of Support created in the 2008 Crash
Thisis Crucial as if it drops belwo, that is the $ on the international stage loosing the strongest line of support it has ever had
If we look at the stage now, you will also see that the DXY was loosing traction BEFORE the FED began cutting Rates.
This is due to many things on the internationa stage, Like BRICS gaining momentum.
If we look closer, at the weekly chart since around 2017
We can see how the DXY has been Ranging, with a Few Peaks and Drops, the deepest being in 2021, just before the Bitcoin ATH that year.
It bounced well and hit a Peak in late 2022, when Bitcoin was in its Deep Bear.
DXY has ranged ever since j a tight range...
Untill this year
And now, we find DXY on that line of support once moew, Bitcoin maybe heading to a New ATH
But this time we have the serious threat of Global Mayhem
So, the thing to watch here, Like a HAWK, is if DXY can hold this line of support.
Can the $ regain international support and bounce OR will it Fall through this line of support ?
Or Range on it as in 2021
I am not going to pretend to know the answer but I certainly recommend we all pay attention to this- This could take a while................

DXYDXY needs some correction and further upside as upside isn't done yet.
Disclosure: We are part of Trade Nation's Influencer program and receive a monthly fee for using their TradingView charts in our analysis.

DXY US DOLLAR INDEXAs we can see on the chart, there’s a clear pattern emerging. The current movement of the index closely resembles the price action we saw between April 2015 and August 2018.
Assuming this fractal continues to play out, we could see more sideways movement until the end of the year — before a potential trend reversal kicks in.

DXY June 18 2025We believe that Trump's tariffs and the downward trend in U.S. interest rates will continue to put pressure on the dollar, leading to further depreciation.
Monthly Target: 95.445-101.977

DXY: US dollar To Drop Further Around 95?The US dollar has been steadily declining since the new president was elected in the USA. This decline has been accompanied by the ongoing trade wars. Numerous economic indicators have supported this trend, and we anticipate further depreciation in the coming days or weeks. Before trading, it’s essential to conduct your own analysis and gain a comprehensive understanding of the market.
We wish you the best of success in trading. Good luck and trade safely.
Like and comment for more, and as always, happy trading!
Team Setupsfx_

Bullish bounce?USD Dollar Index (DXY) has bounced off the pivot and could rise to the 1st resistance.
Pivot: 97.81
1st Support: 97.19
1st Resistance: 98.69
Risk Warning:
Trading Forex and CFDs carries a high level of risk to your capital and you should only trade with money you can afford to lose. Trading Forex and CFDs may not be suitable for all investors, so please ensure that you fully understand the risks involved and seek independent advice if necessary.
Disclaimer:
The above opinions given constitute general market commentary, and do not constitute the opinion or advice of IC Markets or any form of personal or investment advice.
Any opinions, news, research, analyses, prices, other information, or links to third-party sites contained on this website are provided on an "as-is" basis, are intended only to be informative, is not an advice nor a recommendation, nor research, or a record of our trading prices, or an offer of, or solicitation for a transaction in any financial instrument and thus should not be treated as such. The information provided does not involve any specific investment objectives, financial situation and needs of any specific person who may receive it. Please be aware, that past performance is not a reliable indicator of future performance and/or results. Past Performance or Forward-looking scenarios based upon the reasonable beliefs of the third-party provider are not a guarantee of future performance. Actual results may differ materially from those anticipated in forward-looking or past performance statements. IC Markets makes no representation or warranty and assumes no liability as to the accuracy or completeness of the information provided, nor any loss arising from any investment based on a recommendation, forecast or any information supplied by any third-party.

DXYWe are expecting DXY to give us bullishness in this week first.
Disclosure: We are part of Trade Nation's Influencer program and receive a monthly fee for using their TradingView charts in our analysis.

Index/US) Bearish trend analysis Read The caption)SMC trading point update
Technical analysis of U.S. Dollar Index (DXY) on the 30-minute timeframe, with the price respecting a clear downtrend and repeatedly rejecting a resistance zone near the 200 EMA.
---
Analysis Breakdown
Key Technical Elements:
1. Downtrend Structure:
The price remains within a descending channel.
Multiple lower highs and lower lows signal sustained bearish pressure.
2. Resistance Zone:
Highlighted near 98.490–98.495, aligned with the EMA 200.
Multiple rejections from this level (indicated by red arrows), confirming strong supply.
3. EMA 200 (98.490):
Acts as dynamic resistance.
Price is below it, reinforcing the bearish bias.
4. Projected Move:
Bearish price path targets the 97.189 level (target point).
A measured move of approximately -1.30% is illustrated.
5. RSI (14):
RSI currently at 46.27, below the neutral 50 mark.
This confirms bearish momentum without being oversold, leaving room for further downside.
---
Bearish Thesis:
Repeated failure to break above key resistance + downward channel + RSI weakness suggests a continuation to the downside.
Short-term consolidation expected before breakdown continuation.
---
Trade Idea Concept:
Entry: Sell on a minor pullback near resistance (~98.300–98.490), or breakdown below the recent minor support.
Target: 97.189 zone.
Stop Loss: Above 98.500 or EMA 200 to invalidate the bearish setup.
Mr SMC Trading point
Risks to Watch:
A break and strong close above 98.500 would invalidate the bearish structure and could initiate a trend reversal.
Economic events (noted by calendar icons) may trigger volatility – ideal to monitor closely around those times.
plesse support boost 🚀 this analysis)

U.S. Dollar Index (DXY) Bearish Setup – Supply Zone Rejection & 🔹 Trend Overview
📊 Overall Trend: Bearish (Downtrend)
📉 Price is forming lower highs and lower lows within a descending channel.
🔻 Recently bounced off a support zone, now heading toward a potential pullback.
🔵 Supply Zone (Resistance Area)
📍 Zone Range: 100.049 – 100.601
🧱 Acts as a resistance block where sellers might step in.
📏 Confluent with EMA 70 at 100.178, strengthening its validity.
🔸 Trade Setup – Short Position
🟠 ENTRY POINT: 100.088
❌ STOP LOSS: 100.587 – 100.595 (Just above supply zone)
🎯 TARGET: 98.000 (With intermediate support levels)
📌 Support Levels
🔹 98.112 – First minor support
🔹 98.106 – Close-range confirmation
🔹 97.885 – Additional support zone
🟦 Main Target: 98.000
⚖️ Risk/Reward Ratio
🟧 Small risk above supply zone
🟩 Large reward to downside = Favorable R:R
📌 Summary
📈 Expecting a pullback into supply zone.
🧨 Look for bearish confirmation around 100.088.
🎯 Target the downside at 98.000 for profit.

DXY ready for free fall?DXY at 99.39 strong liquidity grab then rejected back to the support level then following a head and shoulder, price completely has broker out of the support with CPI, it has finally managed break out of consolidation.
As the impulse has volume, we may see further drop to the monthly support 97.93 and may potentially break below as there is FVG which may slide the price further down.

Bearish continuation?US Dollar Index (DXY) is rising towards the pivot and could drop to the 1st support.
Pivot: 100.54
1st Support: 98.32
1st Resistance: 101.78
Risk Warning:
Trading Forex and CFDs carries a high level of risk to your capital and you should only trade with money you can afford to lose. Trading Forex and CFDs may not be suitable for all investors, so please ensure that you fully understand the risks involved and seek independent advice if necessary.
Disclaimer:
The above opinions given constitute general market commentary, and do not constitute the opinion or advice of IC Markets or any form of personal or investment advice.
Any opinions, news, research, analyses, prices, other information, or links to third-party sites contained on this website are provided on an "as-is" basis, are intended only to be informative, is not an advice nor a recommendation, nor research, or a record of our trading prices, or an offer of, or solicitation for a transaction in any financial instrument and thus should not be treated as such. The information provided does not involve any specific investment objectives, financial situation and needs of any specific person who may receive it. Please be aware, that past performance is not a reliable indicator of future performance and/or results. Past Performance or Forward-looking scenarios based upon the reasonable beliefs of the third-party provider are not a guarantee of future performance. Actual results may differ materially from those anticipated in forward-looking or past performance statements. IC Markets makes no representation or warranty and assumes no liability as to the accuracy or completeness of the information provided, nor any loss arising from any investment based on a recommendation, forecast or any information supplied by any third-party.

DXYWe are expecting Dollar strength this week short term.
Disclosure: We are part of Trade Nation's Influencer program and receive a monthly fee for using their TradingView charts in our analysis.

DXY Under Pressure: Breakdown Incoming Below 99.00?After testing the 102 resistance zone in mid-May, the TVC:DXY resumed its downward move, dropping back into the 98.50–99.00 support zone.
The brief spike above the psychological 100 was quickly rejected, and price has since rolled over — currently trading around 99.27 at the time of posting.
🔻 The downside pressure is strong, and a break below support looks imminent.
If that break occurs:
🎯 Short-term target: 98 (approx. 1% drop)
📉 Medium-term potential: A deeper decline toward 95

DXY Analysis today : Possible reversal?With strong liquidity grab at 99.00 DXY, with monthly rejection to the upside, past week we have seen with gap open the market started to drop long term support level 99.000 which smart money zone price has got bounce back to the upside with strong momentum potentially forming a double bottom with series of higher low price may continue to move up to the 100.75 to long term monthly resistance with NFP we may see further rejection down again.
A bullish on support is high probability !

DXY Technical Outlook – Strong Support Test and Bullish Reversa Chart Summary
The DXY (U.S. Dollar Index) chart illustrates a significant technical structure between strong historical support and resistance zones, with potential for a bullish reversal after a key level retest.
🟢 Key Support Zone: 99.000 – 98.000
📍 Labeled as "STRONG SUPPORT", this zone has held multiple times:
Previous bounce: Early 2023 ✅
Mid-2024 rebound ✅
Current price action once again shows a reaction from this level with a bullish candle forming 🔥
📌 EMA Confluence:
The 200 EMA (blue) sits at 102.401
The 50 EMA (red) at 103.725
Price is currently below both EMAs but near the 200 EMA, suggesting potential for a mean reversion bounce 📈
🔴 Resistance Zones to Watch:
Resistance Zone: 109.000 – 110.000
⛔ Historically rejected in late 2023 and again in early 2025
🧱 Acting as a supply zone — watch for rejection or breakout
ATH Supply Zone: 113.000 – 114.000
🚨 This is a major psychological and technical barrier
🫡 Marked as “NEW ATH” – would need strong momentum and fundamentals for a breakout above this level
📈 Price Action Expectations:
With strong support respected again, a bullish reversal toward 109.000 – 110.000 appears likely (as illustrated by the arrow).
If momentum continues, a retest of ATH zone is on the cards 🔭
However, a failure to hold support could lead to breakdown below 98.000 – watch closely 🔍
🧭 Strategic Insight
Bullish Bias while above support (98.000 zone)
Reversal Confirmation needed above 102.401 (200 EMA) and 103.725 (50 EMA)
Watch for rejection near 110.000 resistance before ATH test
📌 Final Note:
🧊 World Eyes on this Level – As highlighted on the chart, the current support area is under global observation, reinforcing its importance.
🕵️♂️ Stay alert for breakout volume and fundamental catalysts (e.g., Fed decisions, CPI, jobs data).

BEARS STILL IN CHARGE ! DXY- USD INDEX FORECAST Q2 W22 Y25DXY USD INDEX FORECAST Q2 W22 Y25
BEARS CRUSHING THE USD!
Professional Risk Managers 👋
Welcome back to another FRGNT chart update📈
Diving into some Forex setups using predominantly higher time frame order blocks alongside confirmation breaks of structure.
✅ U.S. dollar index is a measure of the value of the dollar against a basket of six foreign currencies.
✅The currencies are the Euro, Swiss franc, Japanese yen, Canadian dollar, British pound, and Swedish krona.
🔑 Remember, to participate in trading comes always with a degree of risk, therefore as professional risk managers it remains vital that we stick to our risk management plan as well as our trading strategies.
Pairs to look out for -
EURUSD - BUY
USDCHF - SELL
USDJPY - SELL
USDCAD - SELL
GBPUSD - BUY
- Perhaps it's time to accept that a recovery in the DXY is not occurring anytime soon...
📈The rest, we leave to the balance of probabilities.
💡Fail to plan. Plan to fail.
🏆It has always been that simple.
❤️Good luck with your trading journey, I shall see you at the very top.
🎯Trade consistent, FRGNT X

"DXY Dollar Index" Market Bullish Heist Plan (Day/Swing Trade)🌟Hi! Hola! Ola! Bonjour! Hallo! Marhaba!🌟
Dear Money Makers & Robbers, 🤑 💰💸✈️
Based on 🔥Thief Trading style technical and fundamental analysis🔥, here is our master plan to heist the "DXY Dollar Index" Bank Heist. Please adhere to the strategy I've outlined in the chart, which emphasizes long entry. Our aim is to escape near the high-risk ATR Line Zone. It's a Risky level, overbought market, consolidation, trend reversal, trap at the level where traders and bearish robbers are stronger. 🏆💸"Take profit and treat yourself, traders. You deserve it!💪🏆🎉
Entry 📈 : "The heist is on! Wait for the Crossing previous high (100.400) then make your move - Bullish profits await!"
however I advise to Place Buy stop orders above the Moving average (or) Place buy limit orders within a 15 or 30 minute timeframe most recent or swing, low or high level for Pullback entries.
📌I strongly advise you to set an "alert (Alarm)" on your chart so you can see when the breakout entry occurs.
Stop Loss 🛑: "🔊 Yo, listen up! 🗣️ If you're lookin' to get in on a buy stop order, don't even think about settin' that stop loss till after the breakout 🚀. You feel me? Now, if you're smart, you'll place that stop loss where I told you to 📍, but if you're a rebel, you can put it wherever you like 🤪 - just don't say I didn't warn you ⚠️. You're playin' with fire 🔥, and it's your risk, not mine 👊."
📍 Thief SL placed at the nearest/swing low level Using the 2H timeframe (99.000) Day/swing trade basis.
📍 SL is based on your risk of the trade, lot size and how many multiple orders you have to take.
🏴☠️Target 🎯: 102.300
🧲Scalpers, take note 👀 : only scalp on the Long side. If you have a lot of money, you can go straight away; if not, you can join swing traders and carry out the robbery plan. Use trailing SL to safeguard your money 💰.
💰💵💸"DXY Dollar Index" Bank Money Heist Plan is currently experiencing a bullishness,., driven by several key factors. .☝☝☝
📰🗞️Get & Read the Fundamental, Macro Economics, COT Report, Geopolitical and News Analysis, Sentimental Outlook, Intermarket Analysis, Index-Specific Analysis, Future trend targets with Overall outlook score... go ahead to check 👉👉👉🔗🔗🌎🌏🗺
⚠️Trading Alert : News Releases and Position Management 📰🗞️🚫🚏
As a reminder, news releases can have a significant impact on market prices and volatility. To minimize potential losses and protect your running positions,
we recommend the following:
Avoid taking new trades during news releases
Use trailing stop-loss orders to protect your running positions and lock in profits
💖Supporting our robbery plan 💥Hit the Boost Button💥 will enable us to effortlessly make and steal money 💰💵. Boost the strength of our robbery team. Every day in this market make money with ease by using the Thief Trading Style.🏆💪🤝❤️🎉🚀
I'll see you soon with another heist plan, so stay tuned 🤑🐱👤🤗🤩

DXY BUYBy utilizing Fibonacci retracement levels, historical patterns, , we can formulate a hypothesis that the market might follow a similar trajectory if bullish sentiment prevails.
