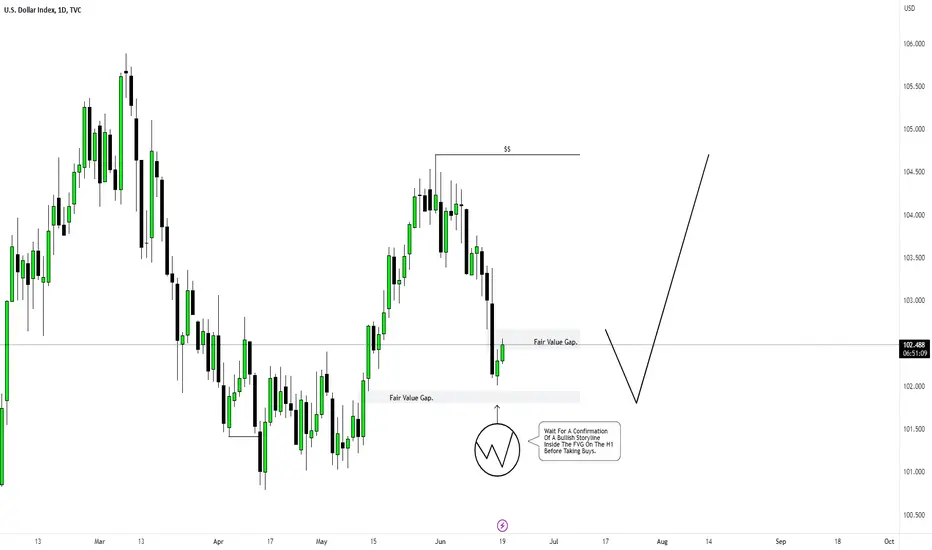
DXYThis is my analysis on the dollar index and what I anticipate to see, this setup panning out largely depends on the dollar index breaking structure bullishly or to the upside once price trades down into the daily fair value gap we have below where price currently is, should we trade down to that fair value gap and not break structure to the upside on the 1 hour time frame then expect price to continue trading lower.
Dxyanalysis
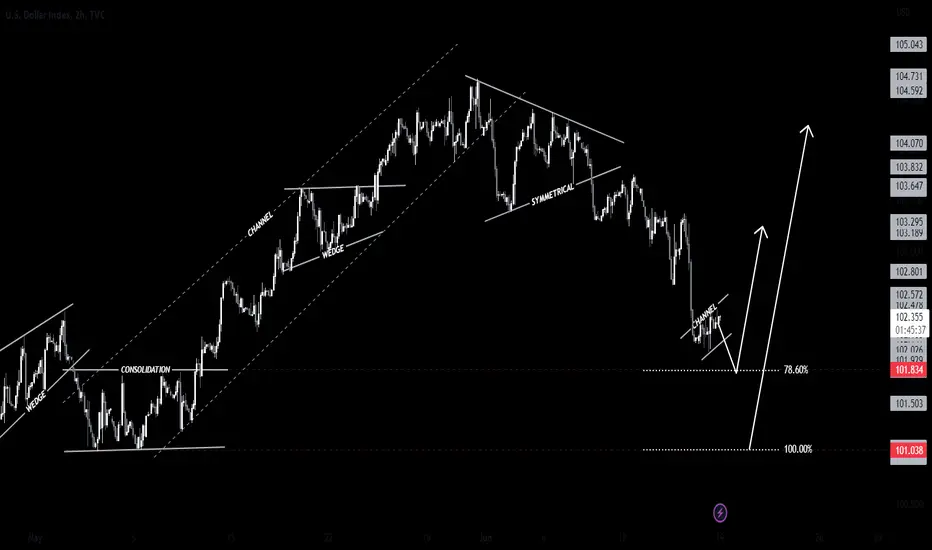
DXY Index New Week Possible MovePair : DXY Index
Description :
Bullish Channel as an Correction in Short Time Frame
Consolidation
Break of Structure
Impulse Correction
Fibonacci
S / R Level

DXY Bullish Retracement (Overall Bearish Bias)DXY has been in a bearish trend. After the previous push to the upside price formed a Double Top, which is a candlestick reversal pattern.
Price then broke the neckline of the double top, retested the area meeting resistance and began another sell off to the downside. Ultimately, forming a lower low.
I am now anticipating price to form a double bottom (bullish reversal pattern) on the 1hr-4hr timeframe and begin a bullish retracement that will form then next Lower High.
I believe price may retrace to the 102.9 - 103.16 area before selling off again.
What do you think, please comment below?

DXY 16June2023the SnD area is responding positively for now, there are several shadow candles with quite long proportions. if the DXY movement is appropriate then the possibility is that the price for the beginning of next week will be bullish limited to the resistance area.

Dollar ready to longDXY create hidden bullish divergence on the daily time frame; a long move is anticipated!
Target Profit 106.1xx

DXY 15June2023there is a change in the elliot notation on DXY. where there is a possibility of a-b-c correction. the confirmed SnD area is an area to wait in case of reversal.

DXY : Short Trade , 1hHello traders, we want to check the DXY chart in the 1-hour time frame. The price is in a descending channel and has reached the key level of 103.300 and 103.400. We expect this level to play the role of a resistance level for us and the trend We expect the price to fall to 102.700, and if the downward trend is strong, the next target for the price is 102.200. Good luck.

DXY 89,144,233 Lookback Testing 0 Value#DXY Can't get anymore cut and dry than this. Funny how indicators can be shaped into place so that they hit key events. FOMC meeting means everything today!
If the oscillators drop below 0 value, it's a bear. If price bounces off 0 value, the bulls will continue. I'm neutral here.

Potential DXY Crash: Anticipating a Substantial Drop to $25I'm eyeing a significant decline in the U.S. Dollar Index (DXY) from its current level around 103, down to 25, driven by escalating inflation, competition from Bitcoin and gold, and the influence of BRICS nations. Should this substantial DXY drop materialize, it would likely benefit commodities, emerging markets, export-oriented economies, cryptocurrencies, and gold due to the inverse relationship they share with the dollar's value.
The recurrent raising of the debt ceiling exacerbates the country's debt load, potentially weakening trust in the U.S. government's ability to service its debt, which in turn could significantly devalue the dollar.
Inflation: If the dollar drops that much, it could lead to inflation or even hyperinflation. The cost of goods and services could rise, which would decrease the purchasing power of the average American.
Interest Rates: To combat inflation, the Federal Reserve may increase interest rates. Higher interest rates can make it more expensive to borrow money for things like mortgages or student loans, which could affect the average American's ability to finance major purchases or manage their debts.

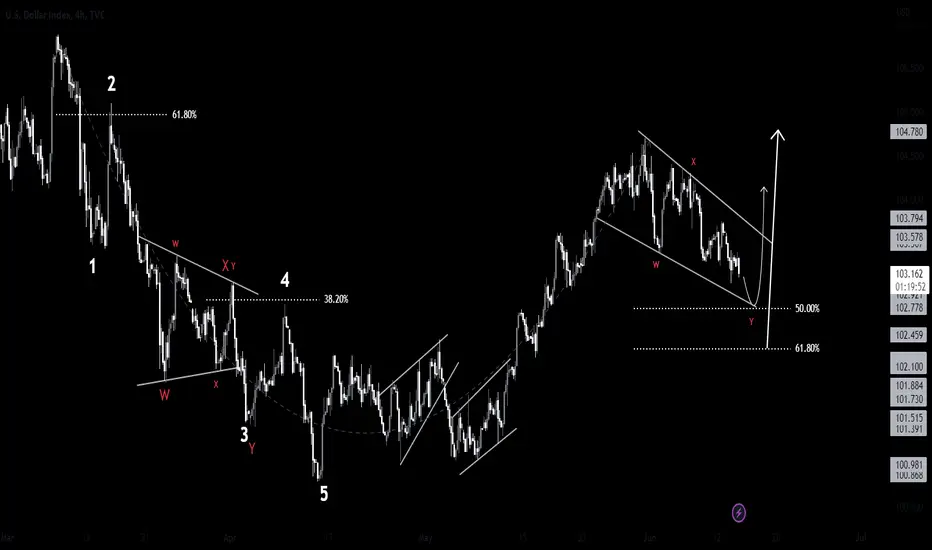
DXY Index Next Possible MovePair : DXY Index
Description :
Completed " 12345 " Impulsive Wave and " ABC " Corrective Wave
RSI - Divergence
Break of Structure
Falling Wedge as an Correction in STF
Fibonacci Level ( 50.00% / 61.80% )
S / R Level
DXY 13June2023price touched there SnD where currently seen on h4 there is resistance, is this a sign of reversal? we wait for some more confirmation, is there a positive bullish candle or maybe a rejection candle.
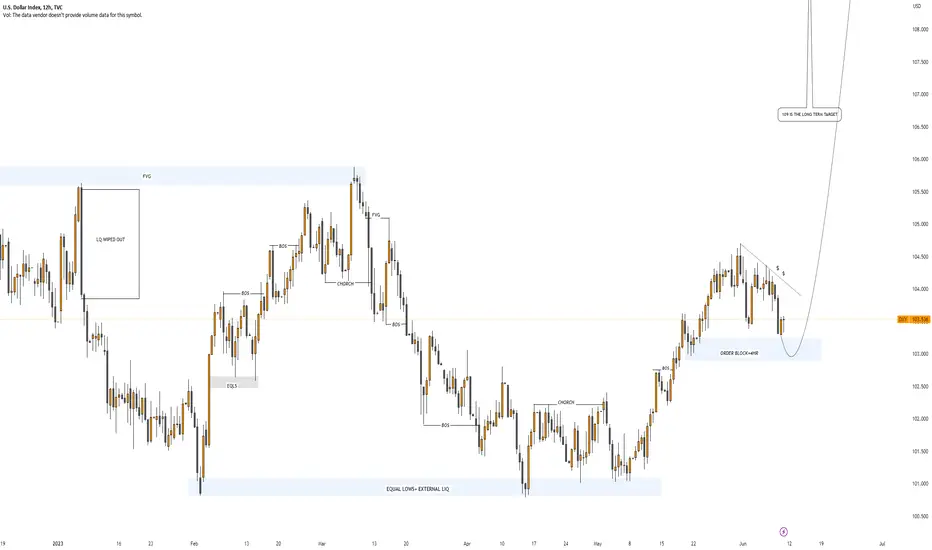
DXY: 109 IS THE NEW TARGETDear Traders, we have a good opportunity of selling XXXUSD pairs and buying USDXXX pairs, as the price currently testing previous LL we are expecting price to bounce from this zone. Let's not miss out on this opportunity.
Good Luck and Trade Safe.
DXY(based on NEo wave)from 2500 to 4000 days I think dollar start a down trend with is corrective and after that it will start an up trend which is strong, also gold can make the bowtie diametric

US Dollar Index (DXY) Price Value Chart TodayThe US Dollar Index, also known as DXY, is used by traders seeking a measure of the value of USD against a basket of currencies used by US trade partners. The index will rise if the Dollar strengthens against these currencies and will fall if the Dollar weakens against these currencies. Plan your technical analysis of the US Dollar Index by tracking its price in the chart and keep up with the latest market movements with news, advice pieces, and the dollar index forecast.
TVC:DXY
CAPITALCOM:DXY

DXY - Ready to skyrocket buying!This is DOLLAR INDEX (DXY) MONTHLY ANAYLSIS..
DXY Imminent Skyrocket
Price is buying from Panic Zone (0 -382%) INSIDE MONTHLY DEMAND ZONE (PREVIOUSLY SUPPLY ZONE)
We expect price BREAK 0% AREA (WEEKLY SUPPLY ZONE) and continue buying to TP1 A AND TP 2 B AREAS.
TRIGGER: WAIT PRICE BREAK 0% AREA (104.620)
When it's triggered, I suggest to open BUY POSITIONS on USD parallel pairs (USD/JPY, USD/CAD, USD/CHF)
and SELL POSITIONS on opposite (EUR/USD, GBP/USD, BTC/USD)
BULLISH INTERNAL CYCLE - WEEKLY ANALYSIS.
- TP 1 - AREA A: 50 - 61.8 % (109.719 - 110.923)
- TP 2 - AREA B: 100 % (114.819)
- FINAL DESTINATION: MONTHLY SUPPLY ZONE (RED AREA ABOVE)
