DXY LONG/BUYBy utilizing Fibonacci retracement levels, historical patterns, , we can formulate a hypothesis that the market might follow a similar trajectory if bullish sentiment prevails.
Dxyanalysis

DXY weekly outlookWeekly analysis for DXY: the broader bias remains bullish. I expect price to respect the stacked 3‑hour demand zones, with the lower zone likely providing the stronger reaction.
After that bounce, a short‑term bearish pullback could unfold from the 4‑hour supply zone. Although I don’t trade the dollar directly, I track DXY for its correlations with other pairs to add confluence and strengthen my setups.

DXY (US Dollar): Bullish Order FlowA bullish order block has been identified on the H1 timeframe, situated below the Asian session range. With the US Dollar maintaining steady strength, there is potential for price to retrace into this order block for mitigation. Should this occur, a continuation of the bullish trend is anticipated, with price likely to rally and break above the recent structural high.

USD Index (DXY) Short Setup: Reversal Expected from Resistance Z1. Entry Point: ~102.430
The price is currently below this level at 101.583, suggesting a potential short setup once the entry level is reached or confirmed.
2. Stop Loss: ~103.196
This is the price level where losses are limited if the trade moves against the intended direction. It's placed above a strong resistance zone.
3. Resistance Point: ~100.580
This was a previous resistance level which has now been broken, indicating a bullish push. The current price is above this, which may signal a breakout.
4. EA Target Point: ~97.857
The take-profit level, significantly lower, indicating a bearish target. This suggests a short position is intended from the entry point.
Indicators and Signals
The chart uses moving averages (likely 50 EMA and 200 EMA), and the price has surged above them, often a bullish signal.
However, the analysis seems to anticipate a reversal from the 102.430 level, expecting a drop back down toward 97.857.
The move from the current price to the target would be a 4.40% decline, a significant move for an index.
Trade Plan Summary
Trade Type: Likely a short/sell from the 102.430 level.
Risk: ~0.77 (103.196 - 102.430)
Reward: ~4.57 (102.430 - 97.857)
Risk-to-Reward Ratio: Approx. 1:6, which is favorable if the setup works out.

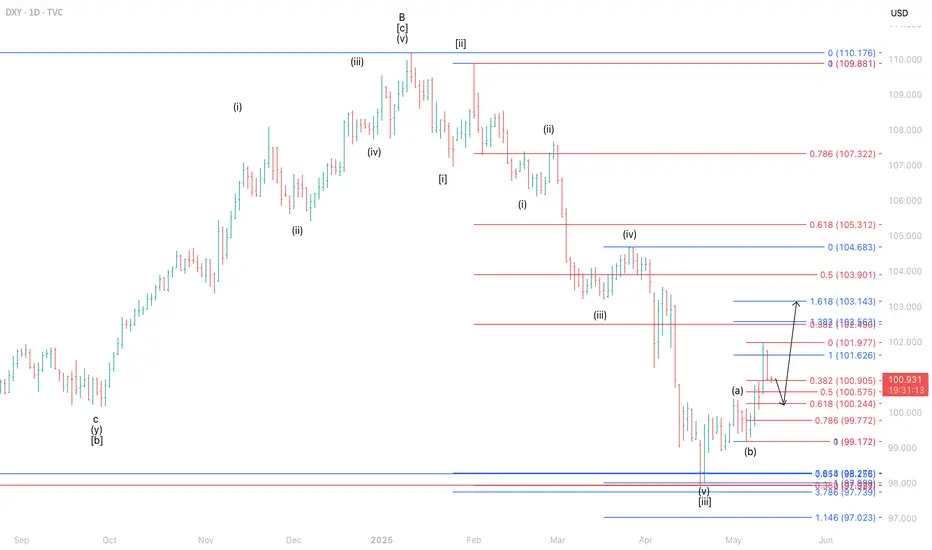
Short-Term Pullback Expected for DXY Before Potential ReboundThe current position of the DXY is estimated to be in wave ii of wave (c) of wave . This implies that the DXY remains vulnerable to a correction toward the 100.244–100.905 area. Subsequently, there is a potential for a rebound, with the index likely to retest the 102.563–103.143 zone.
DXY Ready to Pop – Watch That 100 Break!After breaking below the key psychological level at 100 and making a low just under 98, the Dollar Index ( TVC:DXY ) has entered a consolidation phase.
Over the past three weeks, price has developed an inverted head and shoulders pattern, with the neckline perfectly aligning with the horizontal resistance at 100 — a strong zone of confluence from both a technical and psychological standpoint.
Despite the current hesitation under resistance, the structure suggests bullish potential. I believe we are approaching a breakout above 100, and once that happens, an acceleration to the upside is likely to follow.
🎯 Target: 102
🔒 Invalidation: A break below 98 would cancel the bullish bias.
As long as the price stays above the 98 area, I remain bullish and expect the dollar to strengthen.
🚀 The breakout hasn’t happened yet — but the pressure is building.

DXY Update – Bullish Correction in PlayAt the beginning of the month, I mentioned that the USD Index (DXY) could start a corrective move to the upside, with the 100 level being the critical line in the sand.
Indeed, the index managed to break and hold above this psychological and technical level, currently trading around 100.70, well above the former resistance now turned support.
My bullish outlook remains intact, and I expect the upside continuation to target the 102 zone in the coming sessions.
Conclusion: For pairs like EURUSD and GBPUSD, rallies should be sold as long as this bullish momentum holds. 🚀

DXY Analysis: Rising Dollar and Market ImplicationsAnalyzing the recent DXY chart, we observe a significant upward movement following a demand build-up. This article explores the implications of a rising U.S. Dollar Index (DXY) on currency pairs and major indices like the SP 500 and NASDAQ, aligning with current market dynamics.
DXY Chart Breakdown:
The chart highlights a strong weekly/daily demand level at 98,500, with an internal structural shift marking a pivot point. A demand build-up preceded a sharp rise, tapping the extreme level
of the last point of supply at 100.385, suggesting bullish momentum. The DXY currently
stands at 99.915, with potential to test previous supply levels around 101.850.
Impact on Currency Pairs:
A rising DXY typically strengthens the USD, influencing forex markets:
• XXXUSD Pairs (e.g., EURUSD, GBPUSD): These pairs are likely to decline
as fewer dollars are needed to purchase foreign currencies, reflecting the USD’s
increased value.
• USDXXX Pairs (e.g., USDJPY, USDCAD): These pairs are expected to
climb, as a stronger USD buys more of the counterpart currency.
Exceptions may arise due to region-specific economic data or central bank policies.
Effects on Major Indices:
The strengthening dollar has broader market implications:
• SP 500: Multinational companies may face pressure from reduced overseas earnings, while higher interest rates (often linked to a rising DXY) could lower valuations, potentially leading to declines.
• NASDAQ: Tech-heavy and growth-oriented, the NASDAQ may underperform due
to its sensitivity to a stronger USD and rising borrowing costs, especially for firms
with global revenue.
However, a risk-off sentiment or strong U.S. economic data could counter these effects,
supporting both indices.
Conclusion:
The DXY’s upward trajectory signals a robust USD, likely pressuring XXXUSD pairs
downward and lifting USDXXX pairs. For indices, the SP 500 and NASDAQ may face
headwinds, though context like economic releases or global sentiment will play a key role.
Traders should monitor these levels closely for strategic entries and exits.
Trump’s speech today may create short-term volatility for the DXY. A focus on tariffs could push it toward 101.850.

EURUSDHello everyone.
I'm here to share a new EURUSD signal and also explain the reasoning behind this trade.
Normally, this strategy is designed for mid- to higher-timeframe trading. However, I noticed a signal from this strategy aligning perfectly with my own system on the 15M chart, which made the setup appear twice as strong.
That said, there's one caveat: the delta value is currently positive, which adds a bit of risk to this trade. Please take that into consideration.
🔍 Criteria:
✔️ Timeframe: 15M
✔️ Risk-to-Reward Ratio: 1:2
✔️ Trade Direction: Sell
✔️ Entry Price: 1.13636
✔️ Take Profit: 1.13473
✔️ Stop Loss: 1.13717
🔔 Disclaimer: This is not financial advice. It's a trade I’m taking based on my own system, shared purely for educational purposes.
📌 If you're also interested in systematic and data-driven trading strategies:
💡 Don’t forget to follow the page and subscribe to stay updated on future analyses

GBPUSD The second trade of the day comes from the GBPUSD pair.
Even though I'm not a big fan of this pair, I believe it's worth taking advantage of the signal.
However, for this pair, I recommend slightly reducing your lot size and overall risk.
🔍 Criteria:
✔️ Timeframe: 15M
✔️ Risk-to-Reward Ratio: 1:3
✔️ Trade Direction: Buy
✔️ Entry Price: 1.32793
✔️ Take Profit: 1.33054
✔️ Stop Loss: 1.32706
🔔 Disclaimer: This is not financial advice. It's a trade I’m taking based on my own system, shared purely for educational purposes.
📌 If you're also interested in systematic and data-driven trading strategies:
💡 Don’t forget to follow the page and subscribe to stay updated on future analyses.

US INDEX (DXY) TIME TO BUY !!!HELLO TRADERS
As i can see this chart created a harmonic pattren and it crystal clear showing the levels till it hold above our design Stop Loss Trade War Talks and NFP results with slowing down the inflation shows us that $ will recover from this zone if not break SL make a proper research befor taking any trade we appriciate your cooments and support us Stay Tuned for more updates ...

Technical analysis of short-term gold operations!!!On Wednesday, the gold price generally showed a downward trend. The highest price rose to 3327.91 on the day, and the lowest price fell to 3266.79, closing at 3288.16. In view of the fact that gold fell under pressure during the early trading on Wednesday and broke through the four-hour and daily support as expected, and then the US market rebounded again and came under pressure, and finally ended in a big negative state at the daily level. The price has fallen below the daily support, so we need to pay attention to the continuation of the band decline in the future.
From a multi-cycle analysis, first observe the monthly rhythm. The price rose for three months in the early stage and then a single-month correction appeared. Recently, it has risen for four months and then a single-month correction appeared. Therefore, according to the rhythm, four consecutive positives have appeared. For May, we must pay attention to market risks. From the weekly level, the gold price is supported by the support level of the 3040 area. From the perspective of the medium-term, we can continue to maintain a bullish view, and the price drop is only a correction in the medium-term rise. From the daily level, the current price resistance is in the 3007 area, which is the key watershed of the band trend. If the price is below this position, the subsequent band will be treated as short. At the same time, for the short-term four-hour price resistance, it is around 3290, so the subsequent price will be treated as short under the four-hour resistance. In general, the price can be treated as short under the four-hour resistance and the daily resistance.

Gold opens up callback space as expectedGold finally broke through the rhythm of continuous fluctuations in the morning and ushered in a relatively large correction.
After the cyclical retracement in the morning, a bottom-breaking market was formed. Generally, for a direct decline in the Asian session, we will put the watershed at the opening price, which is the current high point of 3290! But it is not very meaningful to look at this position now. According to the recent rhythm of Asian session decline, weak European session, and rebound in the US session. We can look at the second decline in the European session rebound.
But we should be more cautious in the US session. Especially in the second half of the US session,
Intraday short-term pressure: 3266-70 top and bottom conversion position below: hourly double bottom around 3211-3195 "Observe whether there is a key area for the signal of stopping the decline"

DXY Forecast: More Bearish OrderflowThis week, I anticipate further downside movement on the DXY, with price potentially reaching a key area of interest—a bullish order block. While the reaction at this level remains uncertain, my current bias remains bearish unless a break of structure to the upside signals a continuation of the bullish trend.

Gold is forming a head and shoulders pattern!Analysis and interpretation:
Gold prices have been on a strong upward trend since the beginning of 2025. The daily chart shows that gold prices have climbed from around $2,600 to around the $3,500 mark. Recently, gold prices have formed a consolidation trend in the range of $3,260 to $3,380, indicating that the bulls and bears are fighting fiercely here. It can be seen from the K-line chart that gold prices fell back after hitting a record high of $3,499.83 in April, but then gained support and rebounded at $3,260.
The Bollinger Band indicator shows that the upper track is at $3,465.75, the middle track is at $3,191.92, and the lower track is $2,918.08. The current price is running between the upper and middle tracks, indicating that the medium-term upward trend is still maintained. Although the gold price may fluctuate in the range of $3,260 to $3,380 in the short term, the overall upward trend has not changed.
The MACD indicator shows that DIFF is 81.35, DEA is 84.74, and the MACD value is -6.80. The histogram shows a shrinking state, indicating that the upward momentum has weakened, but no obvious short signal has been formed. The RSI indicator is around 58.81, which is in the neutral to strong area, and has not reached the overbought or oversold level, and there is still room for growth.

Gold falls as expected, awaiting guidance from ADPGold continued to fluctuate in 1 hour. Now, the gold fluctuation is most likely a relay of decline. Gold rebounds and continues to be short. The gold 1-hour moving average gradually begins to stick together, but it is still diverging downward. If it continues to cross downward to form a dead cross, then there is still room for gold shorts to fall. Gold hit a high twice and was suppressed by the 3330 line. Today, gold continued to be short at highs under the pressure of 3330.
Gold bulls continue to rebound every time. Now gold bulls obviously have no confidence in further rise, so gold shorts take the opportunity to exert their strength. Gold is still the home of shorts, and gold rebounds and continues to be short.
US trading operation ideas:
Gold 3320 short, stop loss 3330, target 3300-3290;

Gold maintains a volatile range, pay attention to subsequent breOn Tuesday, the gold price generally showed a downward trend. The highest price rose to 3348.45 on the day, and the lowest price fell to 3299.49, closing at 3316.95. On Tuesday, gold was under pressure during the early trading session, and then the price continued to fluctuate during the European and US trading sessions. Overall, the price is still running within the fluctuation range, but once the daily support is broken, it is expected to break the lower edge of the range.
From the multi-cycle analysis, first observe the monthly rhythm. The price rose for three months before and then a single-month correction occurred. Recently, it has risen for four months and then a single-month correction occurred. Therefore, according to the rhythm, April is generally bullish, but for May, we must pay attention to market risks. From the weekly level, the gold price is supported by the support level of the 3040 area. So from the perspective of the mid-line, we can continue to maintain a bullish view. From the daily level, the current price is supported by the 3004 area support. This position is the key watershed of the band trend. The market will further break down in the future, so it will be focused on in the future. At the same time, for the short-term four-hour price, it has been fluctuating up and down at the four-hour key position recently. Pay attention to the resistance of 3387 and 3370 on the top, and the 3260 area on the bottom. Before the data, the market as a whole tends to fluctuate temporarily. After breaking through the daily support, pay attention to the performance of breaking down the lower edge of the range.

Interpretation of technical ideas for short-term gold trading onGold opened this week in a volatile market. It opened high and fell on Monday. The US market rose above the high opening position. It fell in the Asian market on Tuesday. The European and American markets fluctuated and adjusted. The main reason is that the data this week is concentrated in the second half of the week. From the past market, this week's rebound did not touch 3370, so it cannot be treated as strong. It did not fall below the bottom support of 3260. The overall trend is convergent and volatile. Now the technical indicators are in a sticky posture, and the three lines of the Bollinger Bands are also closed. The Asian market mainly focuses on the continuation of volatility. The upper side focuses on the resistance of the hourly Bollinger Band upper rail 3330, and the lower support is at 3300.
Pay attention to the operation of the range at noon. If the gold price touches 3300 below, participate in long orders with a light position. With a small loss, look at the target of the upper rail pressure of the Bollinger Band at 3330; if there is a rebound before the European market that touches the upper rail of the Bollinger Band at 3330, you can try to arrange a short position to be bearish, and the target is whether 3300 can be broken. The small non-farm data will be released before the U.S. market opens, followed by the PCE data. At that time, I will re-position my position based on the data release and wait for the data release to help gold prices move out of the range of volatility.

Gold's shock trend and interpretation of US market thinkingGold continues to fluctuate, we continue to look down in the European session, try long orders near 82;
2025-4-29 Tuesday Gold Asia-Europe long and short strategies
The market is always changing, the only constant is the existence of risks.
Keeping the principal is always the first principle.
◆Short order◆
Aggressive: short near 3356, stop loss 7 points, short at 62-68 after breaking,
Stop loss: stop loss 7 points each, or unified stop loss 77. Target: 3286-69-54-42, continue to reduce holdings after breaking
◆Long order◆
Aggressive: long at 82, stop loss 7 points, long at 75-70 after breaking,
Stop loss: stop loss 7 points each, or unified stop loss 62. Target: 98-06-12, continue to reduce holdings after breaking;
Steady: 66 long, stop loss 7 points, 58-52 long after breaking,
Stop loss: 7 points for each stop loss, or a unified stop loss of 42. Target: 98-06-12, continue to reduce holdings if the position breaks;
【Today's long orders must be promptly protected after profit, and the next position will be entered after the principal is protected】
Stop loss is determined according to your actual tolerance. Protect in time after profit, and enter the next position after protection】
★ Pattern analysis and attention:
Daily strategy ideas: Asia and Europe, our current price 06 long orders are also given to around 22 as expected. We are still bearish if the resistance is not broken, and try 82 long orders
【Reference: Russia-Ukraine peace talks, US-Japan tariff negotiations】
【Data: wholesale inventory rate, consumer confidence index, job vacancies】
☆ There is a delay in posting, and the final operation is based on real-time strategy and current price orders. Please continue to pay attention;
☆ Strategy orders are divided into warehouses, and the total position shall not exceed 20%;

Risk aversion eases, gold continues to fluctuateSpot gold prices (XAU/USD) fluctuated and fell, approaching the $3,300 mark, continuing the weak trend of the previous trading day.
From the daily chart, gold prices have fallen from their historical highs and are currently approaching the 38.2% Fibonacci retracement level (US$3,300-3,290). The key support level below is concentrated in the $3,265-3,260 range, which is also the previous consolidation range. If it falls below, it will open up the space for a 50% retracement level (US$3,225) or even $3,200.
In terms of technical indicators, the MACD indicator shows signs of a dead cross, and the green kinetic energy column expands moderately, indicating that short-term bears still have the initiative; the RSI indicator is still oscillating near the 50 axis, and has not yet shown extreme oversold, indicating that the downside space may be limited. Once the price rebounds, the initial resistance above is seen at $3,348-3,353.
After the breakthrough, it is expected to re-challenge the $3,400 mark, and even attack $3,425-3,427.
If the US PCE inflation and non-farm data weaken this week, it will further support the re-entry of gold bulls.

Interpretation of the short-term operation ideas of shopping4-hour trend will not hit the high point within this 4-hour period, so currently we can focus on the morning high point and yesterday's high point 3348-3353. Currently we can focus on the support near 3316.
First point: After the 4-hour high closed with a small positive column yesterday, a big negative column fell in the morning, indicating that the price will continue to bottom out in the short term. Therefore, we can arrange short orders below yesterday's high point 3353-3348 in the white session, so 3340-44 is the best shorting point.
Second point: Because the price rose to 3336 after yesterday's high of 3302 and only retreated to 3319, the support of 3316-17 still exists. The point we focus on in the Asian and European sessions is when 3316-17 will break.
Third point: In the event of an accident, the price directly pulls back and breaks the high point, then the next short position is 3370-72; I think this probability is small. Then if it breaks 3315-16, we need to find a low position to go long. Then 3300-3288 and 3273 in yesterday's Asian and European sessions are the long positions. We can use small stop losses to bet on long positions.
Strategy:
Short at 3340-44 during the Asian session, defend at 3353, target at 3330-3320, break at 3315 and target at 3300-3290
Short at 3370-72, defend at 3378, target at 3350
After breaking 3315, short at 3300-328-3276 with a small stop loss of 5-6 US dollars, target at 3305-3350-70

Gold fluctuates within a wide range, and may stop falling as it On Tuesday, gold trading relied on the 3310 support level to directly go long, and the near-point pressure area of 3360/80 was bullish. The long logic of gold as a "safe haven trump card" is beyond doubt. The small cycle adjustment is only the accumulation stage. Once it starts to explode, it will be unstoppable. Recently, when gold touched 3500 again, there was a market view of "suspected top". It is recommended that all investors maintain their composure-the short-term adjustment is insignificant compared to the entire rising cycle. This time, the price retreated from 3500 and corrected by about US$240, which is still within a reasonable range relative to the previous increase. It is emphasized again that it is not recommended for investors to be bearish on gold in the long term, or to subjectively determine that 3500 has become the top. Such psychology is prone to trading deviations and even breeds a dangerous mentality of short orders to bear losses, which is the root cause of long-term losses.
In the early trading of the day, a 3310 long strategy has been deployed, and it is suggested that 3315 can be entered into the long position during the trading session. The current position is in market fluctuations. The current uptrend will first focus on the recovery of the 3340/45 line, and the opening price pressure level should be paid special attention to, especially during the Asian and European sessions. If the Asian and European sessions maintain a shock correction pattern, the support level will continue to be relied on for game play; if the uptrend effectively breaks through 3340/45 and stabilizes, the handover period between the European and American sessions is expected to explode to the 3380 line, or even challenge a higher price range.

USD/JPY 1H Chart AnalysisStructure: Bullish, with higher highs (H1) and higher lows consistently forming.
Key Zone: A demand zone around 143.00 – 143.20. Price could pull back here for liquidity before continuing higher.
Current Price: Consolidating near 143.70 after a strong impulse.
Bias: Bullish, as long as price holds above 143.00. Watching for a possible dip into demand before resuming the uptrend toward 144.20 highs.
