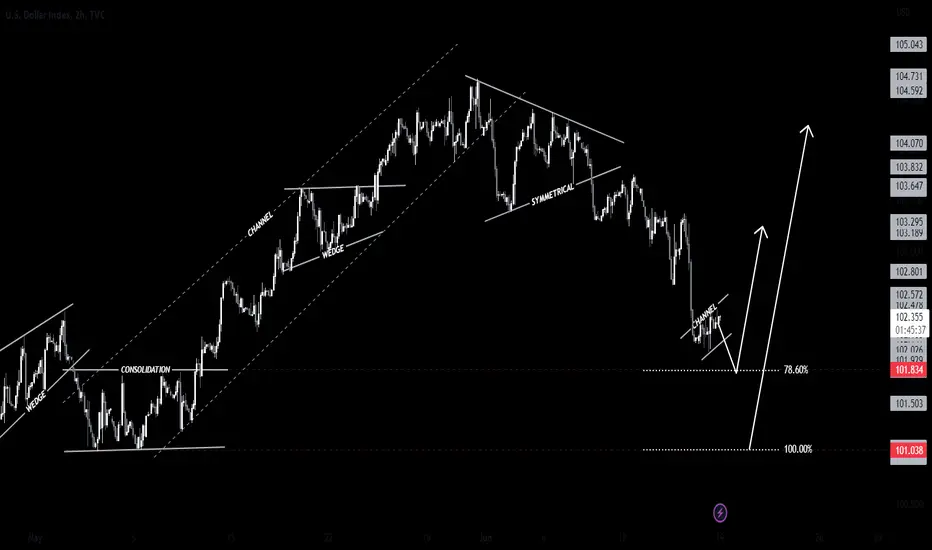
DXY Index New Week Possible MovePair : DXY Index
Description :
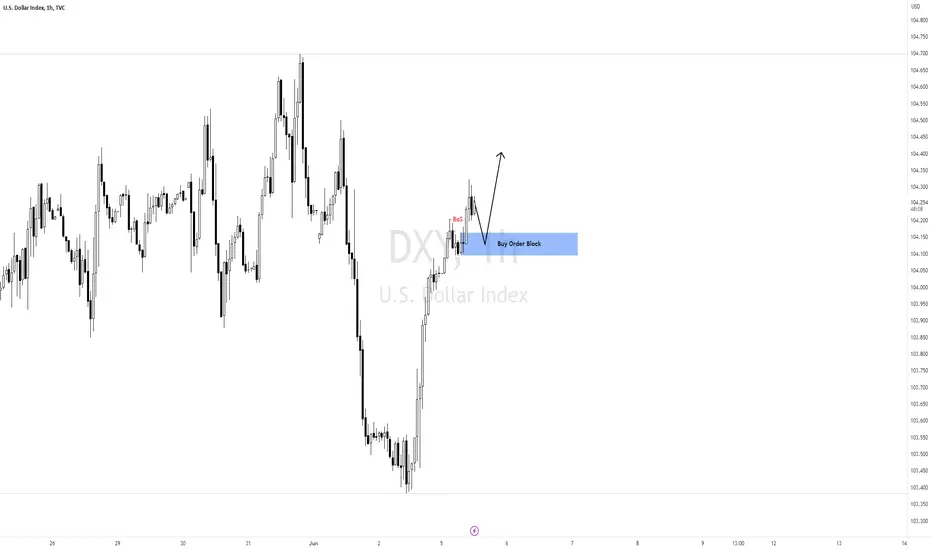
Bullish Channel as an Correction in Short Time Frame
Consolidation
Break of Structure
Impulse Correction
Fibonacci
S / R Level
Dxyforecast
Dollar index ReversalDollar index looks like in reverse mood
As we can see in weekly time frame Dxy is in Bullish trend so I'm expecting Dollar will fly
What is your idea ...
Are you agree with my idea please let me know in comments


DXY 16June2023the SnD area is responding positively for now, there are several shadow candles with quite long proportions. if the DXY movement is appropriate then the possibility is that the price for the beginning of next week will be bullish limited to the resistance area.

Dollar ready to longDXY create hidden bullish divergence on the daily time frame; a long move is anticipated!
Target Profit 106.1xx

DXY 15June2023there is a change in the elliot notation on DXY. where there is a possibility of a-b-c correction. the confirmed SnD area is an area to wait in case of reversal.

DXY 89,144,233 Lookback Testing 0 Value#DXY Can't get anymore cut and dry than this. Funny how indicators can be shaped into place so that they hit key events. FOMC meeting means everything today!
If the oscillators drop below 0 value, it's a bear. If price bounces off 0 value, the bulls will continue. I'm neutral here.

Potential DXY Crash: Anticipating a Substantial Drop to $25I'm eyeing a significant decline in the U.S. Dollar Index (DXY) from its current level around 103, down to 25, driven by escalating inflation, competition from Bitcoin and gold, and the influence of BRICS nations. Should this substantial DXY drop materialize, it would likely benefit commodities, emerging markets, export-oriented economies, cryptocurrencies, and gold due to the inverse relationship they share with the dollar's value.
The recurrent raising of the debt ceiling exacerbates the country's debt load, potentially weakening trust in the U.S. government's ability to service its debt, which in turn could significantly devalue the dollar.
Inflation: If the dollar drops that much, it could lead to inflation or even hyperinflation. The cost of goods and services could rise, which would decrease the purchasing power of the average American.
Interest Rates: To combat inflation, the Federal Reserve may increase interest rates. Higher interest rates can make it more expensive to borrow money for things like mortgages or student loans, which could affect the average American's ability to finance major purchases or manage their debts.

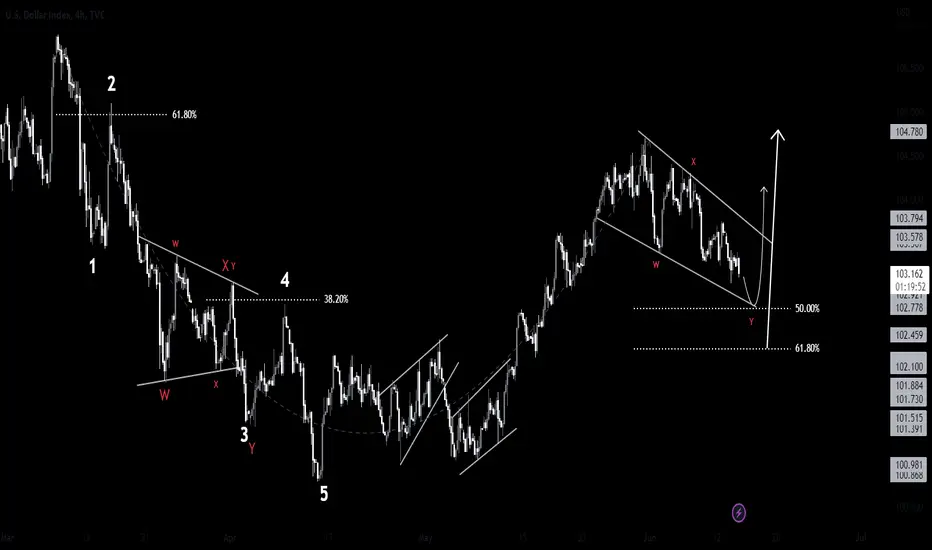
DXY Index Next Possible MovePair : DXY Index
Description :
Completed " 12345 " Impulsive Wave and " ABC " Corrective Wave
RSI - Divergence
Break of Structure
Falling Wedge as an Correction in STF
Fibonacci Level ( 50.00% / 61.80% )
S / R Level
DXY 13June2023price touched there SnD where currently seen on h4 there is resistance, is this a sign of reversal? we wait for some more confirmation, is there a positive bullish candle or maybe a rejection candle.
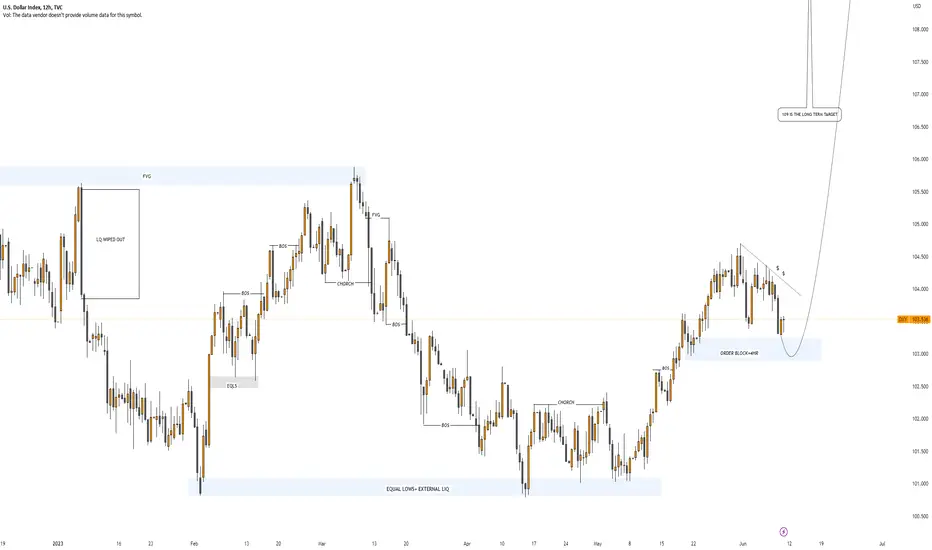
DXY: 109 IS THE NEW TARGETDear Traders, we have a good opportunity of selling XXXUSD pairs and buying USDXXX pairs, as the price currently testing previous LL we are expecting price to bounce from this zone. Let's not miss out on this opportunity.
Good Luck and Trade Safe.
US Dollar Index (DXY) Price Value Chart TodayThe US Dollar Index, also known as DXY, is used by traders seeking a measure of the value of USD against a basket of currencies used by US trade partners. The index will rise if the Dollar strengthens against these currencies and will fall if the Dollar weakens against these currencies. Plan your technical analysis of the US Dollar Index by tracking its price in the chart and keep up with the latest market movements with news, advice pieces, and the dollar index forecast.
TVC:DXY
CAPITALCOM:DXY

DXY 10June2023the analysis a few days ago went well, the price went to the trendline and now looks rebound. the biggest possibility is that the price will still go down in the direction of the black arrow. if you see the bearish trendline responded positively at that time, it could be that the price will respond positively again when approaching the trendline.

Central Banks USD Reserves Drop to Record LowsI am writing to bring your attention to a concerning trend that has been emerging in the global economy. The de-dollarization movement is now evident as central banks worldwide reduce their US dollar reserves to record lows.
This trend indicates that the confidence in the US dollar as the world's reserve currency is declining. As forex traders, we must be aware of this trend and its potential impact on our investments.
The US dollar has been the dominant currency in the world for decades, but this is now changing. Countries in the BRICS (Brazil, Russia, India, China and South Africa) have been actively promoting the use of their currencies in international trade, and other countries are following suit.
As central banks reduce their US dollar reserves, its value will likely decline. This could lead to inflation and a weaker US economy. As forex traders, we need to take action to protect our investments.
I encourage you to sell the dollar and diversify your portfolio into other currencies such as the euro, Australian Dollar, etc. This will help to mitigate the risks associated with the de-dollarization movement and protect your investments.
In conclusion, the de-dollarization movement is now evident, and as forex traders, we need to take action to protect our investments. I urge you to diversify your portfolio into other currencies. Let us stay vigilant and proactive in managing our investments.

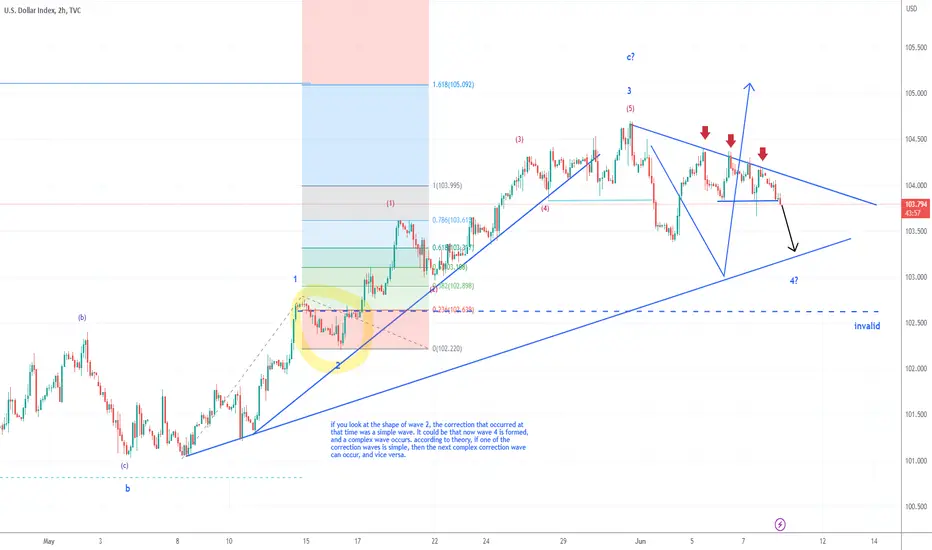
DXY 8June2023Currently the DXY seems to respond positively to the bearish trendline. the price has also broken the support. the next target is the trendline below. there are times when now is wave 4 a complex correction occurs, then we can be prepared that the price can go down quite deep going forward. the invalid area is the limit where this analysis can still be valid. when the price goes down deeper than the invalid area, then it could be that the trend has changed completely to bearish.
DXY Next Possible MovePair : DXY Index
Description :
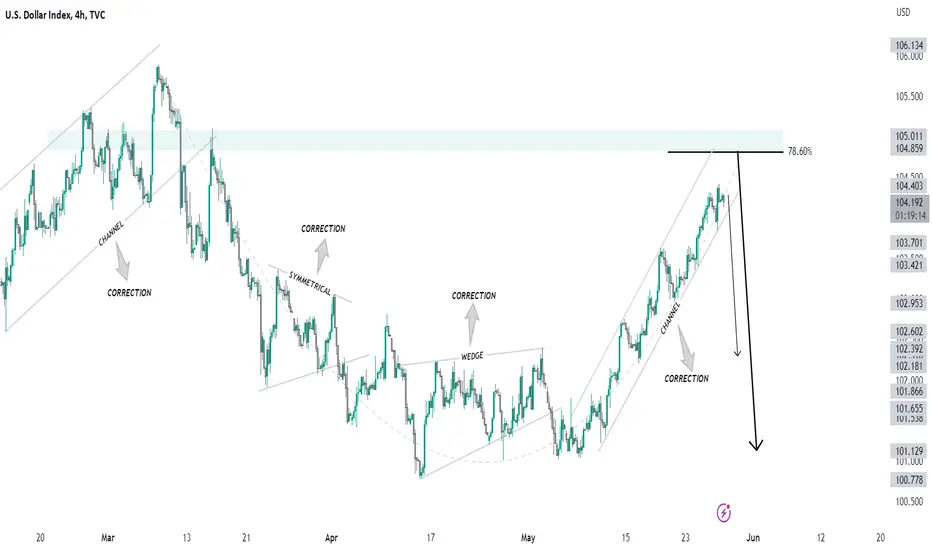
Bearish Channel as a Correction in Long Time Frame
Break of Structure
RSI - Divergence
Symmetrical Triangle
Completed " AB " Corrective Wave
Fibonacci Level - 78.60%

DXY Chart H1Here is my view for DXY on H1. The price could go bullish, you can put a pending order on the Order block or find an entry on LTF within OB Zone. Trade Safe!
DXY 3June2023You can see the note that I gave on the chart, the possibility of wave 4 happening later. I still believe DXY will remain bullish as long as the price does not fall deeper than the invalid area, there is a possibility that DXY will fall more than that, but there is a certain limit to how deep the price will fall.

$DXY - Keep an 👀TVC:DXY CAPITALCOM:DXY
TVC:DXY - Keep an 👀
Currently we are within the range: Lows: 100.820 Highs: 103.150
Pattern: Wedge
We are at an very interesting area when it comes to dollar! Keep your eyes wide open a break above 103 areas, we could easily go towards 105 handle. However, if we are to close below the range of 100 areas then bears are still in control. A great break out trade idea!
Keep in mind those trendlines going down.
Trade Journal

DXY-US DOLLAROur last setup on DXY worked out well, we are anticipating this price action as explain on our chart. Even if you use this chart along, you will be able to make good growth.


DXY New Week Possible MovePair : DXY Index
Description :
Bullish Channel as an Correction in STF
Fibonacci Level - 78.60%
Break of Structure
S / R Level
RSI - Divergence
Bearish Channel in LTF
DXY 28May2023if elliot's notation is correct, most likely there will be a correction and DXY will continue the bullish trend again, limited to 105,600
