Dollar Correction Required!DXY(Dollar Index) created a hidden bearish divergence in the day timeframe! So, I think the dollar will correct to the 102.7 range!
Dxyforecast

DXY-IT IS TIME TO SELL XXXUSD PAIRS!Dear traders, hope everyone having a great week, DXY we had a massive sell off due to mostly by economic events came out negative for USDOLLAR. What we are expecting on DXY is to reverse from the current price. Though we have NFP which will be crucial

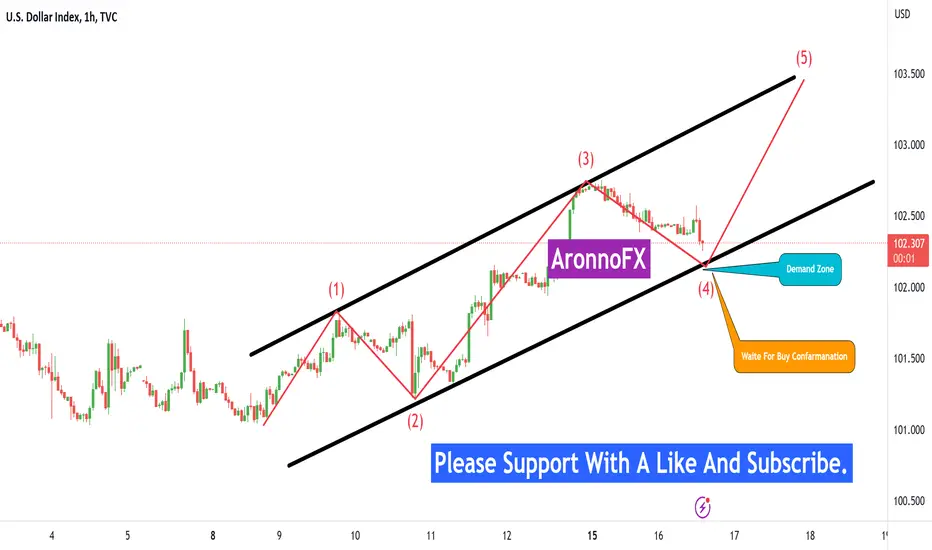
Dollar Index Chart Analysis....
In this situation, DXY chart creates Elliott wave pattern. So,if 103.600
resistance level need to sell confirmation then DXY will fall 102.700 &
102.200 support level. If the breakout is 103.800 level then case is invalid.
AronnoFX will not accept any liability for loss or damage as a result of
reliance on the information contained within this channel including
data, quotes, charts and buy/sell signals.
If you like this idea, do not forget to support with a like and follow.
Traders, if you like this idea or have your own opinion about it,
write in the comments. I will be glad.

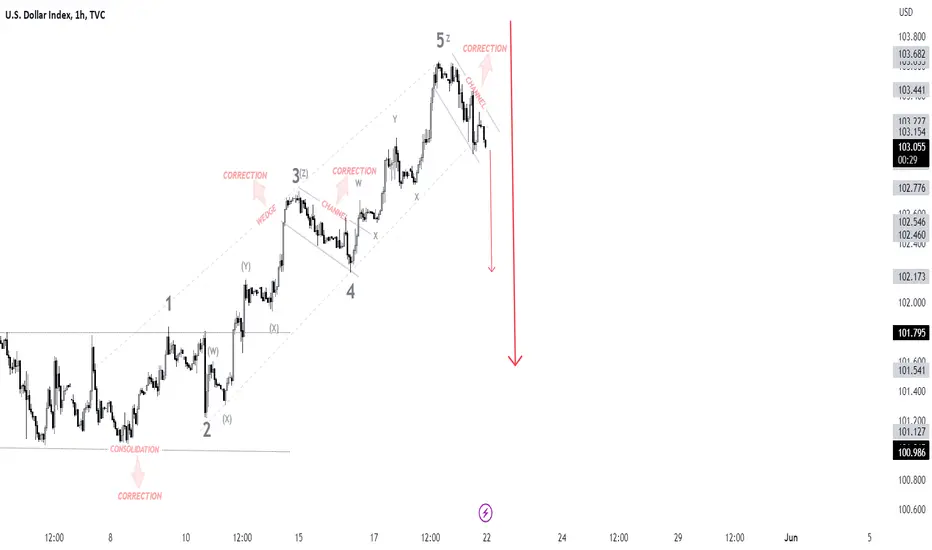
DXY New Week MovePair : DXY Index
Description :
Completed Impulsive Wave " 12345 "
Break of Structure
Divergence
Break of Structure
Impulse Correction
Bullish Channel as an Correction in STF
DXY growth with the help of Double Bottom pattern🚀DXY index managed to form a Double Bottom pattern near the🟢 support zone($ 101.3-$ 100.82) 🟢 so that Regular Divergence(RD+) can be seen between the first and second bottoms.
DXY has already completed the pullback to the neckline and is breaking the upper line of the descending channel.
I expect DXY to grow to at least the downtrend line after breaking the upper line of the descending channel.
U.S.Dollar Currency Index ( DXYUSD ) Analyze, 2h-time frame⏰.
Do not forget to put Stop loss for your positions (For every position you want to open).
Please follow your strategy, this is just my Idea, and I will be glad to see your ideas in this post.
Please do not forget the ✅' like '✅ button 🙏😊 & Share it with your friends; thanks, and Trade safe.

DXY 21May2023DXY analysis is still in accordance with last week's analysis, currently still looks bullish with the notation still unchanged. The invalid area is in wave 2, I assume if the price drops more than wave 2 then the Elliott notation will change and there may be a trend change.

#DXY-LONG BIG MOVE EXPECTED!!Hey Everyone, Strong USD is expected in coming weeks. meanwhile we are expecting price to be bearish during the upcoming days in the week.
If you like the setup please do like and comment your views!!!1

DXY needs a correction to grow again!!!DXY was able to finally break the descending channel and downtrend line with a strong upward trend last week.
But it seems that this week it is the turn of correction or pullback of DXY to the broken resistance zone.
I have specified for you the possible scenarios for the DXY to grow again on the
U.S.Dollar Currency Index ( DXYUSD ) Analyze, 4-hour time frame⏰.
Do not forget to put Stop loss for your positions (For every position you want to open).
Please follow your strategy, this is just my Idea, and I will be glad to see your ideas in this post.
Please do not forget the ✅' like '✅ button 🙏😊 & Share it with your friends; thanks, and Trade safe.

DXY 18May2023The mid-week DXY looks in accordance with the initial analysis, experiencing bullish entry into the impulse wave, if now is the period of wave C, and wave C usually consists of 5 waves, then wave 3 has at least the same length as wave 1. we can estimate the movement of the wave 3 using the Fibo Extension.

Dollar Index Chart View
AronnoFX will not accept any liability for loss or damage as a result of
reliance on the information contained within this channel including
data, quotes, charts and buy/sell signals.
If you like this idea, do not forget to support with a like and follow.
Traders, if you like this idea or have your own opinion about it,
write in the comments. I will be glad.
DXY: News prediction!My Outlook
The unexpected increase in inflation is not a positive development, contrary to what some headlines may suggest. While we anticipate a decrease in inflation, it is unlikely to reach the Fed's target of 2% for several years. This means that the US will likely have higher interest rates than other countries, even if inflation rates are higher elsewhere. This could result in a stronger dollar for an extended period, potentially throughout the year.

DXY 16May2023In my opinion, the dollar index this week will tend to be bullish, where the price looks to breakout from the previous swing high, even though there is a possibility of a correction, as long as this correction does not fall further than the invalid line, then the bullish trend is still a priority analysis

DXY Next MovePair : DXY Index
Description :
Bearish Channel as an Correction in Long Time Frame with the Breakout of the Upper Trend Line
Completed " 12345 " Impulsive Wave and " ABC " Corrective Wave
Break of Structure
Divergence - RSI
Symmetrical Triangle in STF with Breakout and Retracement

$DXY Bearish outlookAs expected, DXY continues showing weakness, with smaller increases of expected rate hikes, yields drop, and increase in CFTC net short positions, I expect the following bearish scenario to play out in the coming weeks,
Good luck and DYOR ,
CAPITALCOM:DXY

DXY EXPLOSIVE MOVE (LONG)= xxxUSD CRASHDXY is currently showing sign of strength from the BULLISH breakout we had last week, now we expected another explosive move to the upside.
DXY LONG = xxxUSD crash
INVALIDATION
If by any chance DXT goes below 101.360 that invalidates the BULLISH break, close all LONGS when this happens.
TARGETS
Overall TARGET for DXY is 200EMA on the D1
P.S I will post money making trades like this everyday and everything you see on my chart is
from the HOOD SUITE INDICATORS, everything you need is right in front on you inside the indicator.
(The key zones, Levels for manipulation, visible SL for invalidation, Alert when trade setup is ready).
No trend lines or complicated analysis, all you have to do is FOLLOW!


DXY short to mid-term analysis (Update)This post is an update to my original post few weeks ago where I presented the case for DXY bottoming out. Following is the link to that, please go through it to understand the context.
On Thursday DXY closed above 34( Red )EMA, on the daily, as mentioned in previous post, it a sign of strength and possible breakout, and we did breakout the following day and closed much higher.
I expect this breakout to hold, and the rally should continue for a while.
We can come down and flirt with 13( Green ) and 21( Blue ) EMA's again, this happens until 13 and 21 EMA's start moving up and crosses above 34 EMA, when that happens and sustains for few days, that's the confirmation of bull run and that's the most likely scenario.
Fundamentally also, we have reasons for Dollar gaining strength in short to midterm, mostly because of Hawkish Fed and no intention of stopping rate hikes in the coming months, with each upcoming rate hike DXY should keep pushing higher. We also have indications of a stronger than originally expected US economy and decreasing unemployment as contributing factors adding to DXY's strength.
Now talking about targets, The Boxes in my chart are very strong S/R zones going back months and years. So, the next zone of mid-size resistance for DXY is 103 price level, where I expect some retrace, then the big one is 104 which may cause a pause in the rally and some consolidation for big retrace.
If you like my content then please boost and share this post. I have over 6 years of trading and investing experience and have learned a lot in this time. I like to share what I have learned. If you would like to learn from my experience then follow me on trading view to get notified on my trade, market projections and several upcoming technical analysis and in-depth tutorials on technical Indicators. You can also leave a comment and let me know if you want me to look at any specific asset or want to learn about any specific topic in the world of Technical Analysis. I Will do my best to create a post for it.
Keep learning and Happy trading All.

DXY 23May2023if you follow my analysis update, then this analysis is also still valid from a few weeks ago, there is still a strengthening of the DXY possibly up to 104,300 - 104,500 next week

Intraday BUY dxy (08 MAY 2023)DXY intraday trading alert
3 simple steps to find a quality setup !
Risk Reward Ratio 1: 2
Anyone same idea with me?
BUY DXY
Good luck traders..

DXY New Week Possible MovePair : DXY Index
Description :
Bullish Channel in Long Time Frame as an Corrective Pattern
Completed " abc " Corrective Wave
Divergence
Impulse Correction
Break of Structure
Rejection from Fibonacci Level - 61.80%
Double Bottom
Bearish Channel in STF

Still looking to short DollarThe dollar is experiencing fundamental weakness due to its data, with yuan transactions surpassing it for the first time. The GDP was worse than anticipated, causing concerns of an impending recession. Today's core PCE data, a crucial inflation indicator, could potentially alter the trajectory of the dollar, therefore, be cautious.
From a technical standpoint, I am searching for a trend rejection.

DXY index 03 May MovePair : DXY Index
Description :
Falling Wedge as an Corrective Pattern in Long Time Frame with the Breakout of the UTL
Break of Structure
RSI - Divergence
Completed " ABC " Corrective Wave
Bullish Channel
Rising Wedge in Short Time Frame with the Breakout of the LTL

DXY still in bullish 3may2023DXY movement has been slow in the last 2 days, probably due to the big news releases this week. I believe DXY is still in a bullish position
