U.S. Dollar Index (DXY) – Key Resistance & Bearish Target Analys📊 Key Observations:
🔵 Resistance Zone (📍~103.5 Level)
A strong resistance area (🔵 blue box) is marked, indicating potential selling pressure if the price reaches this level.
The price is moving upwards (📈) towards this resistance, so watch for rejection or breakout.
🔵 Support/Target Zone (📍~101.5 Level)
A lower support zone (🔵 blue box) is marked as the bearish target 🎯.
If the price fails at resistance, it may head downwards (📉) to this level.
📉 Recent Price Action:
🚀 Sharp drop followed by a rebound (📈).
The price is currently moving back up (🔼), possibly forming a lower high before another drop.
📌 Exponential Moving Average (DEMA 9 - 102.488)
The price is hovering above the 9-period DEMA (📏), showing short-term bullish momentum.
If the price rejects resistance and falls below the DEMA, a bearish continuation (📉) is likely.
🚀 Potential Scenarios:
✅ Bullish Breakout: If price breaks above 🔵 resistance, it may continue rising (📈) to higher levels.
❌ Bearish Rejection: If price fails at resistance, expect a drop (📉) towards 101.5 🎯.
Dxyforecast

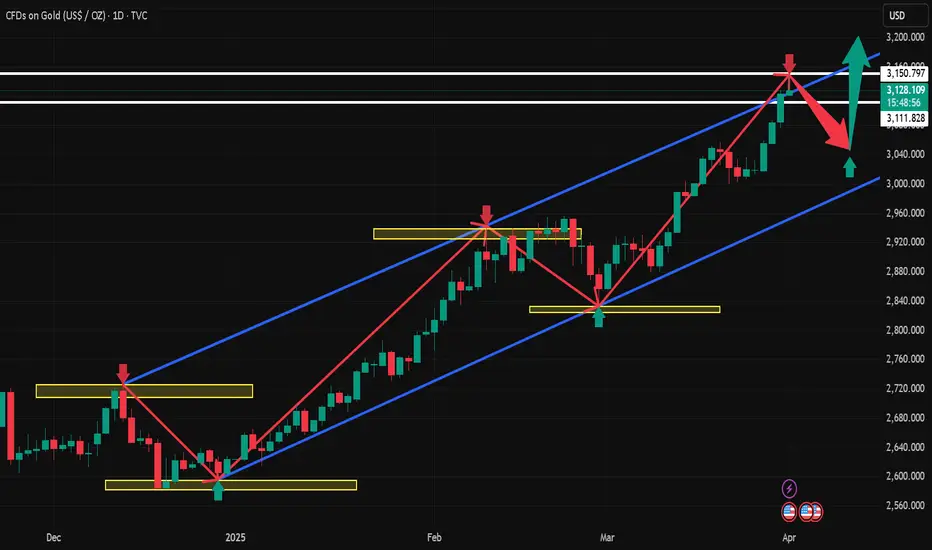
Gold continues to strengthen and fluctuates widely in the short Gold stabilized near the 200-period moving average at the beginning of this week, and the current upward trend is supported by the daily chart oscillator indicators. Both the daily RSI and MACD remain in the bullish range, with obvious momentum;
The upper target is concentrated in the 3167-3168 US dollar line, which is the historical high set at the beginning of this month; if it successfully breaks through this area, the gold price may enter a new upward channel.
In the short term, the support level below $3100 is concentrated in the 3065-3060 US dollar range, and a break below it will open a downward channel to $3000. The $3000 mark coincides with the 200-period moving average of the 4-hour chart, which is the key long-short dividing point;
If it falls below this point, it means that gold has entered the correction stage, and bulls need to remain vigilant; but the current fundamentals and market sentiment still strongly support the gold price to maintain high volatility.

Technical analysis of short-term operations in the US market on 4,9 US trading operation interpretation ideas:
Today, there was a bottoming out and rebound. In the morning, it first went south and then north. It fell sharply to 2970 and then quickly counterattacked 3000 after entering the Asian session! I emphasized in the morning that the gold short may be coming to an end! It will enter a short-term sharp decline and then rebound! But the current trend is obvious that today's increase has exceeded expectations!
We must beware of the possibility of a V-reversal in the US market! Although the large-scale purchase of gold caused by the selling of US bonds is still difficult to confirm the long position in the US market!
The intraday increase is close to 90 points! There may be two emotions.
1: The market impact after the tariffs are implemented has not been eliminated
2: If the bullish trend continues in the US market, it may retreat to around 3045 in the future, and continue to be bullish later!
Short-term support: 3045---3030----3000
Pressure level: 3075---3080---3100---3135

4.9 Gold price trend after the Fed meetingIn the early European session, spot gold maintained its amazing intraday gains, and the current price is around $3046/oz, up $64 on the day.
Gold's latest technical trading analysis:
Gold's recent sharp decline from its all-time high has stalled near the 61.8% Fibonacci retracement level of the February-April rally. The support level is around the $2957-2956/oz area, or the multi-week low hit on Monday, followed by the 50-day moving average (currently around $2952/oz). If gold falls below the latter, it will be seen as a new trigger by bearish traders and drag gold to the next important support level around $2920/oz, and then all the way down to $2900/oz.
On the other hand, the momentum of gold breaking through the overnight high (around the $3023/oz area) could push gold prices to the $3055-3056/oz barrier. Some follow-up buying should pave the way for gold to return to the $3,100/oz mark, with some intermediate barriers around $3,075-3,080/oz.
Support: 3,030 3,018 3,000
Resistance: 3,045 3,068 3,080
We will update regularly every day to introduce how we manage active thinking and settings. Thank you for your likes, comments and attention. Thank you very much

4.9 Technical analysis of short-term gold operations!Gold market analysis
Gold idea: We need to pay attention to whether the daily line will rise after reaching a low. The daily line is hovering at the bottom. In a volatile market, we must find a range of volatility. Finding the rhythm is the most important thing. Yesterday, the daily line formed a cross star again. Today, the white market is expected to fluctuate. In addition, there are many fundamentals in the near future. The market has been led by the rhythm. Gold rose well before. The sharp drop was also due to Trump’s tariff policy. The global tariff war is inevitable in the future. It will support the US dollar in the long term and suppress gold. The short-term top of the weekly line may be a long-term top.
Today’s idea: Let’s focus on the 2969-3022 volatility range. If the white market rebounds first and approaches 3022, go short first. On the contrary, if gold breaks and stands on 3022, it will also fluctuate, but the center of gravity of the volatility will rise to the 3000-3055 range. The volatility requires patience to wait for the position, and waiting is also part of the transaction.
Support level: 2990-2969,
Pressure: 3022 3035

4.9 gold rebound increases resistance level and continues shortiFundamentals:
On Tuesday (April 8), the price of gold fluctuated slightly higher in the early US trading. The market is currently expecting a continuous decline, and at the same time paying attention to the logic of short selling at resistance points. After briefly hitting a four-week low on Monday, the price of gold rebounded quickly and rebounded strongly to above $3,000 in the Asian and European trading on Tuesday.
Against this background, gold, as the ultimate safe-haven asset with "zero credit risk", has once again become the main allocation target of market funds. Every macro policy imbalance and external shock will bring cyclical buying to gold, and this time the intensity may be stronger. The current gold price has stabilized at the psychological level of $3,000 and is showing a short-term rising structure. From a technical perspective, the gold price in the daily chart quickly rose after stepping back on the Fibonacci 61.8% retracement level ($2,956), showing the resilience of buying. If the gold price breaks through the short-term resistance of $3,020, the upward target will be the $3,055 and $3,080 areas, and further may rise to the $3,100 mark. The key support level below is still around $2956. If it fails, it may test the 50-day moving average support (about $2947). Once this level is lost, it may trigger more technical selling pressure. The biggest variable facing the current market is no longer inflation data, but the destructive impact of Trump's tariff increase on the global trade pattern. The Fed's policy space is opening up rapidly. Driven by the expectation of interest rate cuts and risk aversion demand, gold not only stabilizes the $3,000 mark, but is also likely to re-enter the main upward trend.
Personal operation analysis:
Trend: shock trend
Support: 3000----2983------2965
Resistance: 3008-----3030-------3050
Strategy:
Viewpoint logic:
Short view near 3030, stop loss 3036, take profit near 3000----2970, and track stop loss 300 points.

4.8 Gold continues to run at a low point!Gold stabilized and rebounded on Tuesday (April 8), with an intraday increase of nearly 1%, successfully recovering the losses of the previous trading day. The rebound ended the three-day correction trend, and the gold price rebounded significantly from the key support level of $2,955. The current market focus is on the evolution of the Fed's policy path and the geopolitical trade situation. Under the interweaving of long and short factors, the short-term volatility of gold has risen significantly.
Fundamentals: The struggle between risk aversion and interest rate expectations
The rebound of gold at the beginning of this week was mainly driven by two factors:
1. The escalation of geopolitical trade risks
US President Trump's recent remarks on tariffs have triggered market concerns about the renewed tension in the global trade system.
2. The Fed's interest rate expectations fluctuated sharply
The interest rate futures market has undergone dramatic changes this week: On Monday, the market once bet that the Fed would cut interest rates five times in 2025, a significant shift from the expectation of "one or no interest rate cut" a week ago.
3. The coordination of the US dollar and capital flows
The US dollar index weakened slightly on Tuesday, reducing the cost of holding gold for non-US investors.
Technical aspect: Attack and defense of key support level
From the perspective of the market structure, the trend of gold this week showed typical "sharp drop and slow rise" characteristics:
Support confirmation: On Monday, the gold price accurately tested the support of $2955 and then rebounded. This position corresponds to the neckline of the platform that broke through in mid-March, and formed a double defense line with the 55-day moving average (US$2930). The intraday lows were densely bought, indicating that medium- and long-term investors viewed the correction as an opportunity to build positions.
Resistance distribution: The first resistance above is at US$3040 (daily line R1), and after breaking through, it may test US$3057 (March 20 pivot point) and US$3097 (R2). The historical high of US$3167 is still a psychological barrier, but it is difficult to challenge it directly in the short term.
In the short term, the trend of gold will depend on two major catalysts: 1. The minutes of the Fed's March meeting on Wednesday: If the minutes suggest an open attitude towards rate cuts, it may push gold prices to test the $3,050-3,070 range; conversely, if the emphasis is on inflation stickiness, it may trigger long profit-taking. 2. Progress in trade negotiations: Any substantive implementation or easing of tariff policies may trigger fluctuations of more than 5% in gold prices. In the medium term, the upward trend of gold has not been broken. Institutional research reports show that the current global central bank's demand for gold purchases is still at a historical high, and in the downward cycle of interest rates, the relative attractiveness of interest-free assets will continue to stand out. If the technical side breaks through $3,057, it will open up space for the impact of the previous high; the defense strength of the $2,950-2,930 area needs to be closely monitored below.

4.8 Technical analysis of short-term gold operations!Spot gold rebounded slightly during the Asian session on Tuesday (April 8), once rising above the 3,000 mark, and is currently trading around $2,995.51 per ounce. Spot gold may rebound to $3,049 per ounce, as the price has previously completed a five-wave cycle starting from $3,168.
Analysts pointed out that the peak of wave d is around $3,049, which can be used as a rebound target. It is still difficult to judge whether this cycle is an impulse wave cycle or a correction wave cycle.
If it is an impulse wave cycle, it means that the downward trend will extend to well below $2,950. The correction wave cycle shows that despite the sharp drop from $3,168, the upward trend from $2,831 remains intact.
The information shown on the daily chart is very clear. The sharp drop in the past few days seems to be driven by wave (4), which may end near the strong support level of $2,970. The next wave (5) will push the upward trend above $3167.
Resistance level: 3015----3038-----3050
Pressure level: 3000---29833-----2970

4.8 Interpretation of gold short-term operation ideasGold price has fallen below the previous row support band in the daily trend. The K-line continues to be under pressure from the short-term moving average and maintains a weaker trend of shock. In the short term, pay attention to the pressure band around 3030. In the 4-hour level trend, the K-line is currently under pressure from the short-term moving average and is maintaining a low-level shock repair. The strength and continuation of the intraday rebound are not too large. Pay attention to the continued downward trend after a small break in the 4-hour level trend. At present, after continuous shocks in the small-level cycle trend, the technical pattern has begun to gradually adjust. The K-line has begun to slowly stand on the short-term moving average and tends to have a certain rebound space in the short-term trend. Pay attention to the short-term adjustment.
Operational suggestions:
Short near 3017-8, stop loss 3023.9, or long near 2945-6, stop loss 2939.1.
Real-time market intraday guidance.
We will update regularly every day to introduce to you how we manage active ideas and settings. Thank you for your likes, comments and attention. Thank you very much

4.7 Interpretation of gold short-term operation ideas! US market4.7 Interpretation of gold late trading operation ideas:
Falling more than 70 points in the morning, it quickly rebounded and reversed! How will gold evolve tonight?
This V-reversal market frequently appears in these three trading days. It is difficult for us to encounter it once or twice a month. This increases the risk of trading. Once you make a mistake, it will be a reversal of dozens of points! When trading, you must strictly use the "stop loss".
We note that the three V-reversals in this stage have common characteristics. The stop in the last trading intensive period means that "3130" can be used as a reference for stage support and pressure. Then these three are: 3130, 3050, 2970---2980
The decline caused by the backlog of sell orders and insufficient liquidity! For gold, it will cause multiple stimulations, panic selling, and funds leaving the market for a short time to avoid risks. Selling gold to fill the gap in other markets and many other factors, and the central banks around the world that intend to reserve gold will not wait! They will still buy strategically, so the trend determines that the decline is limited.
2880 and 2630 are the two main observation positions.
After the small-cycle funds rebounded in the morning, the market entered a triangular consolidation state, the highs were gradually decreasing, and the lows were flattening. This is an obvious sign of market wait-and-see sentiment. The probability of a V-reversal phase or a continuous unilateral trend in the evening increased! If you follow this logic, gold should be under pressure around 3035-3038 during the rebound phase of 16-18 points!
And then continue to fall. Of course, if the EU further expresses its tariffs! It may cause the short-term volatility of the market to intensify!
Any unilateral trend needs to be confirmed in the US market. In the evening, whether it is a V-reversal from north to south or a continuation of the Asian and European market, it is normal. The overall framework will not deviate from the framework of 3130, 3050, 2980!
We will update regularly every day to introduce to you how we manage active ideas and settings. Thank you for your likes, comments and attention. Thank you very much

4.7 Gold short-term operation technical strategyLast week, gold and Dow Jones started to plummet across the board, and the short-selling of the band was a carnival. First of all, our initial short-selling target of 38,500 under the Dow Jones 45,000 has been completed. The only key support is the 36,300 line, and gold has also fallen to the 2970 line. There is no bottom at present, but there is a rebound in the key support level, so don't chase the low in the morning! From the closing point of view, the weekly line finally closed with a long upper shadow line and a quasi-inverted hammer pattern. After the end of this pattern, the market has been in the short stage this week. The intraday rebound is still mainly high-altitude. The market has a large amplitude, and the small stop loss has lost its meaning. At this time, the entry position is very important. In terms of points, the intraday rebound 3045-55 area continues to be high-altitude.
Short-term support: 3038, 3018, 2980, 2960
Do a good job of pushing the position protection! ! !

4.7 Gold opened lower and continued to fall!!!Gold fell sharply again at the opening of the morning session. The root cause is that the United States imposed tariffs on many countries and the countermeasures of various countries have triggered panic in the global financial market. The U.S. stock market fell sharply and the U.S. dollar index fluctuated. This macroeconomic uncertainty has increased the safe-haven demand for gold, but the liquidity problems caused by market panic may cause investors to sell gold in exchange for cash, so it will suppress the price of gold. The overall market sentiment is relatively complex, and the long-short game is fierce. From the disk, gold has gradually turned short!
In the current situation, don’t expect gold to rise sharply in a short period of time to form a rebound. The gold content of following the trend is still rising. We will go short in the morning when we wait for a rebound! The upper pressure level focuses on the closing price of 3036 last week, and the further pressure level is the top and bottom conversion level of 3054! You can ambush and short near 3050 in the morning! The falling market is all the way down, don’t blindly guess the bottom!
Specific strategy
Gold 3050 short, stop loss 3056, target 3000

U.S. Dollar Index (DXY) - Bearish Breakdown or Reversal?📊 U.S. Dollar Index (DXY) - 4H Chart Analysis
🔵 Supply Zone (104.400 - 104.683)
🟦 Resistance area where sellers may step in 📉
🟡 Key Level (~104.200)
🟧 Decision point – price struggling to hold this level
📉 Trend Line (Broken) 🔻
❌ Previous uptrend is broken, signaling potential bearish momentum
🟢 Demand Zone (103.200 - 103.400)
🟩 Support area where buyers may get active 📈
🚀 Potential Market Movement:
1️⃣ Bearish Breakdown Expected ⬇️
🔹 Price broke below trendline ➡️ selling pressure increasing
🔹 Possible pullback to key level (~104.200) before more downside
🔹 Targeting demand zone (~103.200-103.400) 🎯
2️⃣ Invalidation/Stop-Loss 🚫
🔺 If price moves back above 104.683, bearish setup is invalid
🔺 Stop-loss placed at 104.683 for risk management
🎯 Trading Strategy:
✅ Short Entry: After pullback near 104.200
🎯 Target: 103.200 demand zone
⚠️ Stop Loss: Above 104.683

How Worrying is the Weakening Dollar? A Departure from TraditionThe value of a nation's currency is a critical barometer of its economic health and global standing.1 Typically, in times of international turmoil or economic uncertainty, the U.S. dollar, as the world's reserve currency, tends to strengthen.2 This "safe-haven" effect is driven by increased demand for the dollar as investors seek stability and liquidity. However, recent trends have seen the greenback exhibit a notable weakening, even amidst persistent global anxieties.3 This begs the crucial question: how worrying is this deviation from the norm, and what are the potential implications for the U.S. and the global economy?
To understand the significance of a weakening dollar, it's essential to first recognize the factors that typically influence its strength. These include interest rates set by the Federal Reserve, inflation levels, the overall performance of the U.S. economy relative to others, trade balances, and geopolitical stability.4 Higher interest rates tend to attract foreign investment, increasing demand for the dollar and thus its value.5 Strong economic growth similarly boosts confidence in the currency.6 Conversely, high inflation erodes the dollar's purchasing power, while a significant trade deficit (importing more than exporting) can indicate an oversupply of the currency in global markets, leading to depreciation.
Historically, during periods of global crisis, the dollar has often acted as a port in a storm. Events like geopolitical conflicts, financial market meltdowns in other regions, or global pandemics have typically triggered a "flight to safety," with investors flocking to the perceived security and liquidity of U.S. dollar-denominated assets, thereby strengthening the currency.7 This was evident during past crises, where the dollar often appreciated as investors sought refuge from volatility elsewhere.
The current weakening of the dollar, therefore, raises eyebrows precisely because it seemingly contradicts this established pattern. While global uncertainties persist – ranging from ongoing geopolitical tensions in various parts of the world to concerns about the pace of global economic growth – the dollar has not consistently exhibited its traditional strengthening behavior. This departure suggests that underlying factors might be at play, potentially signaling deeper concerns about the U.S. economic outlook or the dollar's long-term standing.
One potential reason for this weakening could be a shift in relative economic strength. If other major economies are perceived to be on a stronger growth trajectory or offering more attractive investment opportunities, capital might flow away from the dollar, putting downward pressure on its value. For instance, improvements in economic prospects in the Eurozone or emerging markets could lead investors to diversify their holdings, reducing their reliance on the dollar.
Furthermore, concerns about the U.S.'s fiscal health, including rising national debt and persistent budget deficits, could also contribute to dollar weakness. While the dollar's reserve currency status has historically provided a buffer, a sustained period of fiscal imbalance could eventually erode investor confidence in the long-term value of the currency.8
Another factor to consider is the Federal Reserve's monetary policy. While higher interest rates typically support a stronger dollar, expectations of future rate cuts or a more accommodative monetary stance could dampen investor enthusiasm for dollar-denominated assets. If the market anticipates that the Fed will need to lower rates to support economic growth or combat deflationary pressures, this could lead to a weakening of the dollar.9
The implications of a weakening dollar are multifaceted and can have both positive and negative consequences for the U.S. economy. On the positive side, a weaker dollar makes U.S. exports more competitive in international markets, as they become cheaper for foreign buyers.10 This could potentially boost U.S. manufacturing and help to narrow the trade deficit. Additionally, a weaker dollar can increase the value of earnings that U.S. multinational corporations generate in foreign currencies, as these earnings translate into more dollars when repatriated.
However, the downsides of a weakening dollar can be significant. Firstly, it makes imports more expensive for U.S. consumers and businesses.11 This can lead to higher prices for a wide range of goods, potentially fueling inflation.12 For businesses that rely on imported components or raw materials, a weaker dollar can increase their costs of production, which may eventually be passed on to consumers.
Secondly, a sustained weakening of the dollar could erode its status as the world's reserve currency. While this is a long-term prospect, a decline in the dollar's dominance could have significant implications for the U.S.'s ability to borrow cheaply and exert influence in the global financial system.13
Thirdly, a weakening dollar could lead to concerns among foreign investors holding U.S. assets, such as Treasury bonds. If they anticipate further depreciation of the dollar, they might become less inclined to hold these assets, potentially leading to higher U.S. borrowing costs in the future.
In conclusion, the current weakening of the dollar, particularly in the face of ongoing global uncertainties where it would typically strengthen, is a trend that warrants careful attention. While a moderate depreciation can have some benefits for U.S. exports, a sustained or significant weakening could signal underlying economic vulnerabilities or a shift in global investor sentiment towards the greenback. Factors such as relative economic performance, U.S. fiscal health, and the Federal Reserve's monetary policy will likely play a crucial role in determining the future trajectory of the dollar. The departure from its traditional safe-haven status serves as a reminder that the dollar's dominance is not immutable and underscores the importance of maintaining sound economic policies to underpin its long-term strength and stability. Monitoring these trends will be critical for understanding the evolving global economic landscape and its implications for the United States.

Non-agricultural gold is expected to fall sharply. On Friday (April 4), at 20:30 Beijing time, the U.S. Bureau of Labor Statistics released the highly anticipated March non-farm payrolls report, which put pressure on gold.
Fundamentals: Today, gold is expected to fall sharply. The market continues to short at resistance points.
Market volatility is expected to increase during the period. The long-short game of the US dollar index near the 102 mark will determine whether it can continue to rise. If it breaks through 103, it may further suppress gold and non-US currencies. Gold is looking for direction in the range of 3080-3100 US dollars/ounce. If risk aversion picks up, it may retest the 3100 mark; on the contrary, if the US dollar continues to strengthen, breaking through 3080 will open up downside space. The decline in US stock futures may continue until early next week.

4.5 Gold falls off a cliff and waits to stabilize! ! !Gold 4-hour level: The last wave of pull-up started from the low point of 2999 to 3167. Yesterday, it fell back and tested the 618 split position 3063. The current support is still valid, which is also the MA66 day position; From the perspective of macd, it is still short-selling and has not been fully repaired. Wait until it crosses below the zero axis, and then slowly stabilizes and tends to golden cross in the future market, then a wave of trend pull-up will gradually form, and it will take time; if 3063 cannot be maintained, the two split positions below are 3035 and 3018, and attention should be paid to stabilization.
Intraday support: 3035 3018 3005
Resistance: 3045 3070 3100

Dollar Index at Risk: Key Support Holds the Fate of the TrendThe U.S. Dollar Index (DXY) has broken down from a Head & Shoulders pattern, confirming a bearish reversal after a successful retest of the neckline. The price is currently near a key support area, and if it fails to hold, a drop toward the lower strong support zone is likely.
Additionally, RSI is showing bearish divergence and is below the neutral 50 level, indicating weakening momentum.
DYOR, NFA

4.4 Gold is low and long, wait for non-agricultureYesterday, the gold market opened at 3134.1 in the morning. The market first fell back to 3122.6 and then rose strongly. After breaking the previous high, it reached a high of 2167.9. After that, the market began to fall under the cooperation of fundamentals and technical profit-taking. The intraday low was 3053.6. After that, the market rose strongly and reached 3135.8 before consolidating. The daily line finally closed at 3114.1. The daily line closed in a spindle shape with a very long lower shadow. After this shape ended, after the break of 2940 and 2958, the long positions were reduced, and the stop loss was followed up at 3050. If it falls back to 3082 first today, the long stop loss is 3075. The target is 3115 and 3132. If it breaks, the target is 3140 and 3150.

4.4 Analysis of gold short-term operation strategy!!!On Thursday (April 3), spot gold experienced a surprising volatility, with a single-day fluctuation of nearly $114, and the price of gold finally closed down.
Analyze the technical outlook of gold intraday.
The 4-hour chart of gold shows that the price of gold is trading below the currently flat 20-period SMA, but it is still well above the bullish 100-period SMA, which provides support near $3040/oz. At the same time, technical indicators have recovered from near oversold readings and stabilized within negative levels. If the price of gold falls below the above-mentioned $3040/oz area, the price of gold may fall sharply.
Support: $3086.70/oz; $3073.90/oz; $3061.10/oz
Resistance: $3123.10/oz; $3136.70/oz; $3150.00/oz

"DXY/Dollar Index" Bull Money Heist Plan (Scalping / Day Trade)🌟Hi! Hola! Ola! Bonjour! Hallo! Marhaba!🌟
Dear Money Makers & Robbers, 🤑 💰💸✈️
Based on 🔥Thief Trading style technical and fundamental analysis🔥, here is our master plan to heist the "DXY/Dollar Index" Indices Market. Please adhere to the strategy I've outlined in the chart, which emphasizes long entry. Our aim is the high-risk Red Zone. Risky level, overbought market, consolidation, trend reversal, trap at the level where traders and bearish robbers are stronger. 🏆💸"Take profit and treat yourself, traders. You deserve it!💪🏆🎉
Entry 📈 : "The heist is on! Wait for the MA breakout (104.100) then make your move - Bullish profits await!"
however I advise to Place Buy stop orders above the Moving average (or) Place buy limit orders within a 15 or 30 minute timeframe most recent or swing, low or high level.
📌I strongly advise you to set an "alert (Alarm)" on your chart so you can see when the breakout entry occurs.
Stop Loss 🛑:
Thief SL placed at the recent/swing low level Using the 1H timeframe (103.500) Scalping/Day trade basis.
SL is based on your risk of the trade, lot size and how many multiple orders you have to take.
🏴☠️Target 🎯: 105.000 (or) Escape Before the Target
🧲Scalpers, take note 👀 : only scalp on the Long side. If you have a lot of money, you can go straight away; if not, you can join swing traders and carry out the robbery plan. Use trailing SL to safeguard your money 💰.
"DXY/Dollar Index" Indices Market Heist Plan (Scalping / Day Trade) is currently experiencing a bullishness,., driven by several key factors.
📰🗞️Get & Read the Fundamental, Macro Economics, COT Report, Geopolitical and News Analysis, Sentimental Outlook, Intermarket Analysis, Index-Specific Analysis, Positioning and future trend targets... go ahead to check 👉👉👉🔗
⚠️Trading Alert : News Releases and Position Management 📰 🗞️ 🚫🚏
As a reminder, news releases can have a significant impact on market prices and volatility. To minimize potential losses and protect your running positions,
we recommend the following:
Avoid taking new trades during news releases
Use trailing stop-loss orders to protect your running positions and lock in profits
💖Supporting our robbery plan 💥Hit the Boost Button💥 will enable us to effortlessly make and steal money 💰💵. Boost the strength of our robbery team. Every day in this market make money with ease by using the Thief Trading Style.🏆💪🤝❤️🎉🚀
I'll see you soon with another heist plan, so stay tuned 🤑🐱👤🤗🤩

Monthly closing line, gold is alert to pull higher and fall backAt the end of March, the monthly and quarterly lines of gold and silver closed with saturated strong positive lines. The first trading day of the month has broken the high by inertia, which is consistent with expectations. Next, the focus should be on guarding against the potential scenario of pulling up shipments in the first half of the month, and the possibility of extreme volatility.
There are a lot of heavy news data from the 2nd to the 4th. I think there is a high probability that there will be an obvious turning point. However, given that the global political and economic situation has not cooled down significantly, even if there is a turning point and a correction, or even a sharp correction, it is still difficult to make a real judgment of a reversal of the big cycle trend. Therefore, I think the general idea of the short and medium-term line should be to maintain short first and then long.
The small resistance is around 3145--3155, and the important support during the week is around 3050. Given the recent volatility, it is obviously necessary to continue to be prepared to deal with continued large fluctuations.
The above strategy is based on current market analysis, and specific operations need to be combined with real-time data!

DXY Bounces Back: I’m Staying BullishAfter breaking below the 104 support and hitting a low of 103.75, TVC:DXY staged a strong recovery, reclaiming support and signaling a potential false breakout.
The overnight retest of 104 established a higher low, suggesting further upside potential.
As long as 104 holds, I remain bullish and will look to sell EUR/USD and GBP/USD.

Monthly line saturated big positive line, gold and silver swordsYesterday, the gold market opened slightly higher at 3088 in the morning, and then fell back. The daily line reached a low of 3076.5, and then the market rose strongly. After breaking the 3100 integer mark, the daily line rose strongly. The daily line reached a high of 3128, and then the market consolidated widely. The daily line finally closed at 3123.8, and then the market closed with a long lower shadow. After this pattern ended, today's market still has technical bullish demand. In terms of points, after the breakout of 2940 and 2958, the stop loss followed up at 2990. Today, the stop loss of 3110 is 3105, and the target is 3128 and 3132. The breakout is 3140 and 3150-3152.
We will update regularly every day to introduce how we manage active ideas and settings. Thank you for your likes, comments and attention. Thank you very much