DXY trading tactics:The price is trading near the support line.
Strong support at 95.94
if break 97.41 conform bullish
Dxyidea

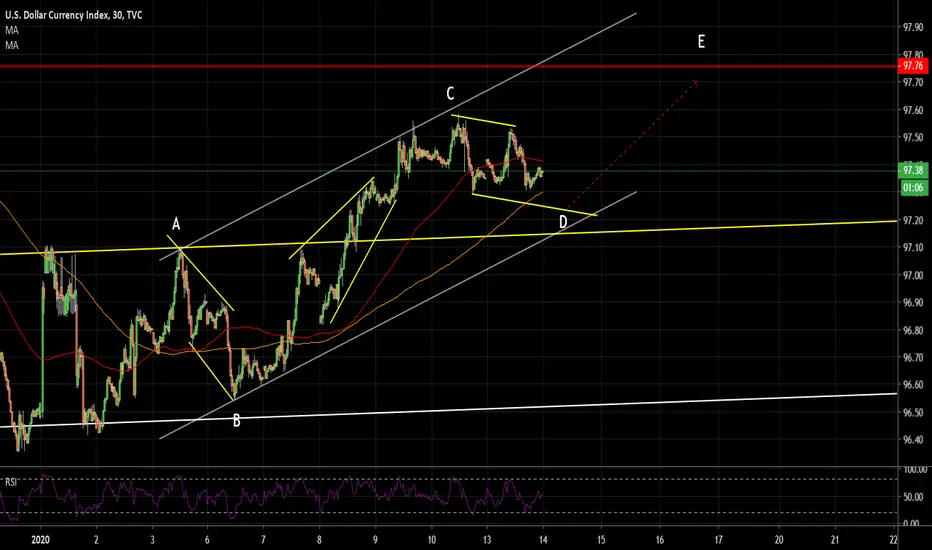
DXY Weak? Monthly Chart shows the oppositeWe are at the moment on a major DXY sell off, It might look like it will continue to crash, but monthly chart shows a different story, we are just at Wave D, with Wave E being final rally for Dxy to 110 area, until the moment Dxy respected the trendline, support at 96.40 will decide the continuation of uptrend of break to the downtrend.
This is pure technical analysis but some other major factors such as stocks being in uptrend for months now also can support this since they move opposite, and we can probably see another sell off at stocks on a next liquidation phase.

What is DXY doing and why it matters?Technical Analysis:
* Price is above 200EMA and above both 14&21EMA, and are acting as support.
* RSI is above 55, indicating good buyer strength.
* RSI has broken the downward trend line and is retesting that trend line.
Trade Idea:
To be a good and comprehensive trader, its always a good practice to check correlations of other forex pairs and indices so as to get that extra confirmation and confidence on your trade analysis. So, in this post, I will be demonstrating how the Dollar Index is expected to move in the coming weeks or even days so every trader knows what to look out for.
DXY is currently in a range bound market. As of now, we can see the 200EMA in combination with 14&21EMA are both acting as support, so with favourable price action, I am expecting one more leg up from the dollar index to the yellow trend line before reversing back down to the recent major support zone. As extra confirmation, the RSI has also broken the downward trend line and is bouncing off that trend line, indicating that buyers are most likely to gain more strength than sellers, hence will likely push the index higher in the coming days.
Overall, DXY is expected to be bullish at least for this week. So, traders who are holding major pairs such as EURUSD, GBPUSD, USDJPY, USDCAD, USDCHF, AUDUSD, NZDUSD should pay close attention to this. #tradesafe


DXY Price Outlook: $USD Reversal ThreatensThe Dollar weakened against every single G10 currency on Thursday after terrible US economic data fuelled concerns over the health of the largest economy in the world.
The US Dollar has been making sharp moves as the only market trading in the green in the current economic crisis. On the US Dollar Index ( DXY ), the greenback has been living up to its name by making steady gains since the 9th of March, rising from below 95 points to above 101, the highest it has been since 2017.
This gain in the USD has been due to the fact that investors are now pulling out of other markets due to their extreme volatility , and withdrawing it back to liquid cash. The global economic uncertainty has caused the markets to fall with no bottom in sight.
The Trump administration recently announced a stimulus plan of $1 trillion, the largest of any country, as a response to the current chaos in the markets. As part of this plan, the government said they were talking about sending cheques of up to $2000 per month in order to offset loss of income, as well as being able to defer up to $1 million in income taxes.
Nearly 3.3 million Americans applied for unemployment benefits last week which was more than triple the previous record set in 1982 amid the widespread economic shutdown caused by the pandemic. These figures are certainly a shocking reflecting of how badly the coronavirus has hit theeconomy with the pace of layoffs expected to jump as the United States sinks into a recession. Dollar weakness could become a short term theme if economic data continues to paint a gloomy picture, despite the efforts of the Federal Reserve and Senate to promote stability.
Looking at the technical picture, the Dollar Index is under intense pressure on the daily charts with prices trading around 99.90. A solid daily close below this level could open a path towards 99.00

DXY: What's ahead of USDIdea is to complement your research.
Check comments section for future updates on idea.
Like this idea?
Like, Share, Follow, and Support channel for future content.
Thank you and happy trading.

DX index 2020 year forecast by PowerfulTradersTraders we do not like to write more.
The prediction of the price you can find on chart!
Regards, Team Traders "Powerful Traders"


DXYwill it get back in that daily channel or will it drop further down we will see after this ends... it will very much depends on what moves will show in the correction that will follow somewhere there...
#DXY, Red Week?If you thought the dollar was on its way to a new high, think again!
Last week, the dollar was on a strong uptrend until it stopped at the resistance line at $ 98.3 and started to fall.
The Stochastic also indicates a trend change or a trend ending.
The Ichimoku Cloud Indicator changed to a red cloud meaning a bear cloud
Target: 97.5

DXY institutional reversalHere I have the DXY where it is creating two new equal lows... essensially for the reversal we would be looking at the next 'bounce' point for price action
Here I use Fibbs to mitigate my entry with 50% being the higher risk and 71% being more sniper entry!!

Forecast for the coming week #DXYSince last week the dollar broke resistance but failed to keep up the momentum, the dollar weakened and dropped back to support line 97.4.
The area where the dollar stops is also supported by the yellow line (200 moving average line).
The Stochastic is in a bullish position on the daily graph.
The dollar is trending up in the daily graph.
Bullish signal with a target: 98.3


My Idea on the USD Index DXY looking at a bullish Chanel I'm looking at a Bullish Chanel on DXY even do it broke the 50% level and it will continue to retest the .144 zone before we see a push to the .500 zone

Jerome Powell will destroy the #dollar's upward trend? #DXYLast week the dollar broke the resistance at 94.4 (breaking resistance usually accelerates trend)
The dollar is on the rise with excellent technical data.
We will remain bullish on the dollar, Despite the interest rate decision on Wednesday and the high chances of seeing an interest rate hike
Target: 98.3
Second target: 99.7


DXY Long Trade Idea (5/7/19) 4HR Chart DXY Long Idea (5/7/19) 4HR Chart
- Price currently broke the trend line that I have placed on the 4HR, and had a retest of that trend line .
- I am looking for the lower high to be formed on the overall bullish trend line , so once price reaches the 61.8% fib level and the 4hr disturbance
zone (orange).
- Once the reversal occurs, price will then reach at least our first fib target at 99.00

DXY Long Trade Idea (5/7/19) Daily Chart DXY Long Idea (5/7/19) Daily Chart
- Price currently broke the trend line that I have placed on the 4HR, and had a retest of that trend line.
- I am looking for the lower high to be formed on the overall bullish trend line, so once price reaches the 61.8% fib level and the 4hr disturbance
zone (orange).
- Once the reversal occurs, price will then reach at least our first fib target at 99.00
(4HR Markup Linked Below)

#DXY Analysis for the next week After the dollar crossed the resistance at 97.50 the way to continue the gains was supposed to be easy but it quickly returned to decline, if the dollar will stop in support and return to rise then the chances are increased to return to the gains, In case he continues the declines should take the last rise in a false alarm


