Euraud daily timeframe
"Hello friends, focusing on EUR/AUD on the daily time frame, the price is currently in a bullish trend and appears to have completed its pullback to a critical level on the daily chart. In the 4-hour timeframe, there are indications of upward momentum.
After observing the price behavior this week, I believe that higher prices are more likely. However, it is important to note that if the price closes below the 1.7100 level on the 4-hour chart, this analysis may prove incorrect."
If you have any more details to add or need further assistance, please let me know!
Dxyindex

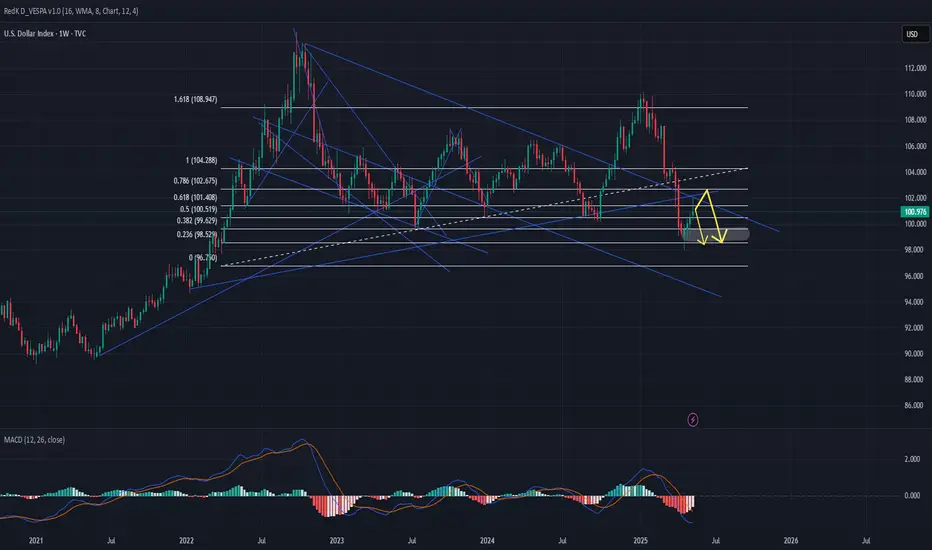
DXY - Dollar Index AnalysisThe U.S. Dollar Index (DXY) remains in a bearish zone, as indicated by the current weekly chart. There is potential for further downside movement toward the 99.70 level, which serves as a strong support area. If this level is breached, the next key support could be found near 98.56.
Alternatively, the index may experience a short-term correction to the upside. A breakout above 101.40 could trigger a move toward the 102.40 resistance level. However, this upward movement is likely to be limited, and the broader trend suggests a probable return to bearish momentum, potentially driving the index back down toward 98.56.
DXY weekly outlookWeekly analysis for DXY: the broader bias remains bullish. I expect price to respect the stacked 3‑hour demand zones, with the lower zone likely providing the stronger reaction.
After that bounce, a short‑term bearish pullback could unfold from the 4‑hour supply zone. Although I don’t trade the dollar directly, I track DXY for its correlations with other pairs to add confluence and strengthen my setups.

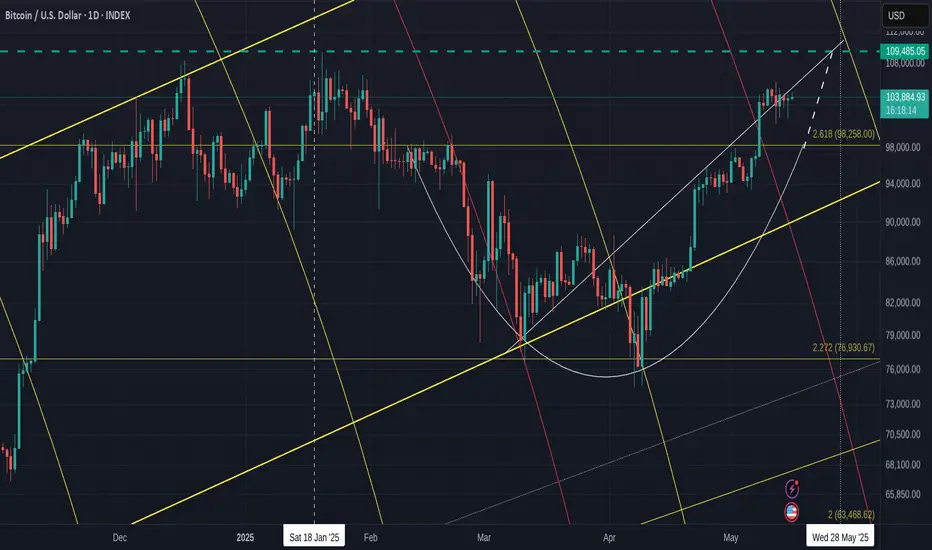
Comprehensive BITCOIN Analysis for the next 7 days - DAILY chart
First Off - Sorry for all the lines on the chart but EVERY one is very relevant to what is happening right now.
The Dashed Blue Horizontal line is the current ATH line. possible Resistance.
The 2.618 Fib extension has not yet been tested as support. This could happen still, at any point till end of month and is around the 98K usd zone.
PA has Ranged through the Local rising line of support, as if it no longer existed, which was a little surprising given the strength that PA has still. There maybe some uncertainty in the air.
PA is above the neckline of the Cup pattern it printed and, again, it would not be unusual to see PA come back down to test this Neckline as support, which is on that 2.618 Fib extension.
The Bold Yellow line is Long Term Support line since 2015, showing that Bitcoin PA is in the Lower side of a Long Term ascending channel, with plenty of room to rise,
PA has a lot of inert strength right now, so, we may not see this retest happen.
We just have to wait.
BUT you can see that Rising dashed line, the extension of the Cup pattern.
PA may range across into this and bump into it next week. If it acts as support again, PA will then be pushed into a tight Squeeze against the other rising line of support, with an Apex on the current ATH line.
PA ALWAYS REACTS BEFORE THE APEX
All that points towards some Volatile times next week if PA remains in this area.
The other descending line there is a 618 Fib Circle. You can see that 98% of the Time, PA is effected by these.
All this shows us 4 points of resistance, in the same Zone, All Next week and PA will Either Shoot through it with a Big push, Or we may see PA Drop back down. The Big question being, how Far ?
We do not want to loose the 2.618 Fib ext at 98K
But what else can we look at. ?
The RSI DAILY
This is still up high in the near Over Bought zone. It can range up here for extended periods but this is something we should be aware of as the possibility of a drop does exist.
On the weekly, RSI has room to move higher & the 4 hour is in neutral zone, again with ability to push higher.
The MACD DAILY
This is once again curling over and about to test the red signal line as support.
On a 4 hour chart, the MACD is down on Neutral line, giving it strength to push higher and if that continues, we will see the yellow MACD line bounce off the Red signal line on the Daily chart.
Once again, Look at the Histogram and the similarity to the area that the Arrow is pointing at.
We could repeat this but on a larger scale. We have to wait and see if this happens.
But also note how there was a Visit into a red Histogram ( for 4 days ) before the bigger push and I remind you about what has been said above.
So, what else can we look at that may offer some ideas ?
The Chart below is the 4 main Crypto Dominance charts by market Cap - 4 hour
BTC.D - ETH.D
OTHERS.D - USDT.D
( OTHERS = Top 125 Coins MINUS Top 10 by Market Cap) Mid to Low cap
We have recently seen a Drop in Bitcoin dominance, giving the ALTS some time to push higher. This is seen with the BTC.D dropping and the ETH.D and OTHERS.D rising
Also note how USDT.D Dropped, showing that stable coins were being exchanged for Crypto,
And as we see now, we have the possibility of BTC.D being rejected by its 50 SMA ( Red)
ETH.D is above its 50 SMA, showing it had a good push and may get support if PA drops
OTHERS.D has already fallen below its 50 SMA, showing a brutal sell off, rapid profit taking.
That is the world of ALTS.
In the last 48 hours, we saw a return for Bitcoin as it rose from a shallow Low in its Range. This was enough to cause a sell off of the ALT coins as we see in the Drop in Others.D
ETH however, remains in a range with obvious intention to continue higher if the market allows.
Lastly, we can compare Bitcoin to the other Markets
Bitcoin - CFD GOLD
DXY - S&P500
Bitcoin has performed well. It has reclaimed some position on Gold recently while it climbed alongside the S&P
We can also see how BTC climbed while DXY dropped.
This highlights some Flaws in using the BTC USD pair to judge the success of BTC but this is explaned better in another post. But in short, If the $ looses Value and your BTC USD pair appears to climb, theg ain is lost as the $ is worth less.
Use BTC XAUT pairs. Bitcoin Gold Pair - Historically, GOLD looses little Value by comparison. So when Bitcoin gains against Gold..It is WIN WIN
So, in conclusion, we see Bitcoin under some pressure to avoid Lower or sharper Drop in the short tern.
The Lower Timeframes show us that BTC has the ability for a Continued Range but with caution.
We see ETH ( and larger Alts ) intent on remain in the game now they have had a small glimpse of Gains
And we see that Mid and Lower Cap Alts are mostly just money makers providing you play the game right. And that game may have some more time if Bitcoin Stumbles in the next 7 days.
And that possibility does exist.
Today is crucial in many ways and will set the tone for the following week.
There is Financial Data being released by the USA today and if unfavourable, we may see some sharp moves.
And ,Longer Term VERY BULLISH - I HOLD AND CONTINUE TO BUY WHEN I CAN ON SPOT ORDERS
I hope this helps and I am grateful for comments
USD Index (DXY) Short Setup: Reversal Expected from Resistance Z1. Entry Point: ~102.430
The price is currently below this level at 101.583, suggesting a potential short setup once the entry level is reached or confirmed.
2. Stop Loss: ~103.196
This is the price level where losses are limited if the trade moves against the intended direction. It's placed above a strong resistance zone.
3. Resistance Point: ~100.580
This was a previous resistance level which has now been broken, indicating a bullish push. The current price is above this, which may signal a breakout.
4. EA Target Point: ~97.857
The take-profit level, significantly lower, indicating a bearish target. This suggests a short position is intended from the entry point.
Indicators and Signals
The chart uses moving averages (likely 50 EMA and 200 EMA), and the price has surged above them, often a bullish signal.
However, the analysis seems to anticipate a reversal from the 102.430 level, expecting a drop back down toward 97.857.
The move from the current price to the target would be a 4.40% decline, a significant move for an index.
Trade Plan Summary
Trade Type: Likely a short/sell from the 102.430 level.
Risk: ~0.77 (103.196 - 102.430)
Reward: ~4.57 (102.430 - 97.857)
Risk-to-Reward Ratio: Approx. 1:6, which is favorable if the setup works out.

Bearish drop?US Dollar Index (DXY) is reacting off the pivot and could reverse to the 1st support.
Pivot: 102.05
1st Support: 100.41
1st Resistance: 103.28
Risk Warning:
Trading Forex and CFDs carries a high level of risk to your capital and you should only trade with money you can afford to lose. Trading Forex and CFDs may not be suitable for all investors, so please ensure that you fully understand the risks involved and seek independent advice if necessary.
Disclaimer:
The above opinions given constitute general market commentary, and do not constitute the opinion or advice of IC Markets or any form of personal or investment advice.
Any opinions, news, research, analyses, prices, other information, or links to third-party sites contained on this website are provided on an "as-is" basis, are intended only to be informative, is not an advice nor a recommendation, nor research, or a record of our trading prices, or an offer of, or solicitation for a transaction in any financial instrument and thus should not be treated as such. The information provided does not involve any specific investment objectives, financial situation and needs of any specific person who may receive it. Please be aware, that past performance is not a reliable indicator of future performance and/or results. Past Performance or Forward-looking scenarios based upon the reasonable beliefs of the third-party provider are not a guarantee of future performance. Actual results may differ materially from those anticipated in forward-looking or past performance statements. IC Markets makes no representation or warranty and assumes no liability as to the accuracy or completeness of the information provided, nor any loss arising from any investment based on a recommendation, forecast or any information supplied by any third-party.


GBPUSDToday's other trade opportunity comes from the GBPUSD pair.
The first days of the week usually don’t behave exactly as expected — there's often volatility, fake moves, and false breakouts.
That's why I prefer to approach Mondays with a lower risk appetite.
🔍 Criteria:
✔️ Timeframe: 15M
✔️ Risk-to-Reward Ratio: 1:2
✔️ Trade Direction: Sell
✔️ Entry Price: 1.32940
✔️ Take Profit: 1.32690
✔️ Stop Loss: 1.33066
🔔 Disclaimer: This is not financial advice. It's a trade I’m taking based on my own system, shared purely for educational purposes.
📌 If you're also interested in systematic and data-driven trading strategies:
💡 Don’t forget to follow the page and subscribe to stay updated on future analyses.

DXY is entering the Smart Money play — Are you ready Temporary selling pressure is unfolding, but a powerful bullish reversal zone is on the horizon! Don’t miss this key USD cycle setup
The US Dollar Index (DXY) is currently breaking down for a temporary selling phase, approaching a high-probability demand zone between 96.40–98.00.
According to the Smart Money Concept, institutional players are clearing liquidity before driving price back towards the higher supply zone (106–110).
Key Insights:
– Temporary Sell-Off: Price is moving toward the demand zone
– Bullish Reversal Expected: Watch for signs of accumulation around 96.40–98.00
– Next Target: Supply zone near 106+ levels
– Strategy: Monitor for bullish confirmation before longing
Stay ahead with clean Smart Money setups —

EURUSDThe third and final trade of the day will be on EURUSD.
Following the significant depreciation of the Euro during the U.S. and Asian sessions yesterday, I expect this downward trend to continue today as well. That’s why I’m opening a sell trade on the 15-minute chart (as always, using a short-term timeframe).
🔍 Criteria:
✔️ Timeframe: 15M
✔️ Risk-to-Reward Ratio: 1:2
✔️ Trade Direction: Sell
✔️ Entry Price: 1.12932
✔️ Take Profit: 1.12743
✔️ Stop Loss: 1.13028
🔔 Disclaimer: This is not financial advice. It's a trade I’m taking based on my own system, shared purely for educational purposes.
📌 If you're also interested in systematic and data-driven trading strategies:
💡 Don’t forget to follow the page and subscribe to stay updated on future analyses.

EURUSDHello everyone.
I'm here to share a new EURUSD signal and also explain the reasoning behind this trade.
Normally, this strategy is designed for mid- to higher-timeframe trading. However, I noticed a signal from this strategy aligning perfectly with my own system on the 15M chart, which made the setup appear twice as strong.
That said, there's one caveat: the delta value is currently positive, which adds a bit of risk to this trade. Please take that into consideration.
🔍 Criteria:
✔️ Timeframe: 15M
✔️ Risk-to-Reward Ratio: 1:2
✔️ Trade Direction: Sell
✔️ Entry Price: 1.13636
✔️ Take Profit: 1.13473
✔️ Stop Loss: 1.13717
🔔 Disclaimer: This is not financial advice. It's a trade I’m taking based on my own system, shared purely for educational purposes.
📌 If you're also interested in systematic and data-driven trading strategies:
💡 Don’t forget to follow the page and subscribe to stay updated on future analyses

EURUSD EURUSD presents another buy opportunity, and I've just activated the trade.
I wanted to share it with you as well. This trade has three different Take Profit levels, which are:
1.13455 / 1.13563 / 1.13786
However, I personally plan to close the trade at 1.13455 in order to stick to my game plan.
This will be the last trade of the day for me.
🔍 Criteria:
✔️ Timeframe: 15M
✔️ Risk-to-Reward Ratio: 1:1.50 / 1:2.50 / 1:4.50
✔️ Trade Direction: Buy
✔️ Entry Price: 1.13290
✔️ Take Profit: 1.13455
✔️ Stop Loss: 1.13180
🔔 Disclaimer: This is not financial advice. It's a trade I’m taking based on my own system, shared purely for educational purposes.
📌 If you're also interested in systematic and data-driven trading strategies:
💡 Don’t forget to follow the page and subscribe to stay updated on future analyses.

EURUSDHello everyone!
I'd like to share an ideal **Buy opportunity** on the **EURUSD** pair with you. The trade is currently **active** on my side.
🔍 **Criteria:**
✔️ Timeframe: 15M
✔️ Risk-to-Reward Ratio: 1:1.17
✔️ Trade Direction: Buy
✔️ Entry Price: 1.13204
✔️ Take Profit: 1.13335
✔️ Stop Loss: 1.13092
🔔 **Disclaimer:** This is not financial advice. It's a trade I’m taking based on my own system, shared purely for educational purposes.
📌 If you're also interested in systematic and data-driven trading strategies:
💡 Don’t forget to follow the page and subscribe to stay updated on future analyses.

GBPUSD The second trade of the day comes from the GBPUSD pair.
Even though I'm not a big fan of this pair, I believe it's worth taking advantage of the signal.
However, for this pair, I recommend slightly reducing your lot size and overall risk.
🔍 Criteria:
✔️ Timeframe: 15M
✔️ Risk-to-Reward Ratio: 1:3
✔️ Trade Direction: Buy
✔️ Entry Price: 1.32793
✔️ Take Profit: 1.33054
✔️ Stop Loss: 1.32706
🔔 Disclaimer: This is not financial advice. It's a trade I’m taking based on my own system, shared purely for educational purposes.
📌 If you're also interested in systematic and data-driven trading strategies:
💡 Don’t forget to follow the page and subscribe to stay updated on future analyses.

Oil on high time frame
"Regarding WTI oil, the price trend on high time frames is bearish, especially on the daily chart. After completing its pullback on the 4-hour chart, there are indications of further downside potential.
The market's volatility may be influenced by geopolitical tensions and political factors between Iran and the USA, as well as tariff issues. Despite these fluctuations, candle formations suggest the potential for prices to drop towards the $58 zone."
If you require more assistance or have any specific questions, feel free to ask!

DXY (US Dollar Index) – Bullish Setup📊 DXY (US Dollar Index) – Bullish Setup from FVG & Trendline Confluence
Price tapped into a well-defined Fair Value Gap (FVG UP) aligning with bullish trendline support. I'm anticipating a small retracement toward the 99.88–99.81 area before continuation upward.
📍 Entry Zone: 99.88 – 99.81 (FVG + Trendline)
🛑 Stop Loss: 99.71
🎯 Target (TP): 100.32
📐 RR: Approx. 1:3
Confluences:
Bullish market structure
FVG filled & respected
Ascending trendline support
Liquidity taken below previous lows
🔔 Watching for bullish reaction after the minor pullback for confirmation.

US INDEX (DXY) TIME TO BUY !!!HELLO TRADERS
As i can see this chart created a harmonic pattren and it crystal clear showing the levels till it hold above our design Stop Loss Trade War Talks and NFP results with slowing down the inflation shows us that $ will recover from this zone if not break SL make a proper research befor taking any trade we appriciate your cooments and support us Stay Tuned for more updates ...

NFP Analysis: More Bullish Order Flow?The Dollar has broken structure to the upside and is now pulling back into equilibrium. From this discounted level, I'm looking to capitalise on any valid bullish setups, as break-of-structure moves often lead to continuation towards previous highs.

DXY (Dollar index) Shorts from 1hr supply zone My general outlook on the DXY this week leans bearish, as I expect price to continue trending lower. I’ve identified a nearby 1H supply zone, where we could see price react and begin pushing lower. There is also a larger supply zone further above, but it’s currently out of reach unless price pulls back significantly.
Looking back, the 2-day demand zone I marked over a week ago has played out well, with a strong bullish reaction from that level — price is still rising from that zone. During this move, a new 11H demand zone has formed, which also led to a change of character to the upside. If price revisits that zone, we may see another bullish continuation from there.
Key Points:
Overall bearish trend expected to continue in the short term.
1H supply zone nearby is a potential trigger point for a sell-off.
2D demand zone previously marked is still holding and influencing price.
11H demand zone has caused a bullish shift and could provide another long opportunity if price returns.
P.S. This is my general DXY outlook for the week. I don’t trade the dollar directly, but I use it as a key confluence when analysing and executing trades across other major pairs.

Eur/Gbp Elliott wave May/02 hello eveyone...
as you can see it seems wave 4 completed ( Holding 50% ) and wave 5 can start....

USD/JPY Bullish Setup with Ascending Trend line This is a 2-hour chart of USD/JPY showing a bullish setup. The price is currently respecting an ascending support trend line, indicating potential upward momentum. There are two marked resistance levels: the first target around 144 . and the second target near the 146.00– 146.50 zone . The chart suggests a bullish continuation if the price breaks above the first target zone, with the second target acting as a stronger resistance area. Ichimoku cloud support below the price also reinforces the bullish bias.

DXY Forecast: More Bearish OrderflowThis week, I anticipate further downside movement on the DXY, with price potentially reaching a key area of interest—a bullish order block. While the reaction at this level remains uncertain, my current bias remains bearish unless a break of structure to the upside signals a continuation of the bullish trend.

AUDCHF m15 SellLet the final trade of the day come from AUDCHF.
I expect the pair to decline first to 0.52545 and then towards 0.52419 / SL 0,52861.
Adjust your risk accordingly and activate the trade.
Wishing everyone a profitable day!
📊 Don’t forget — I share these trade ideas daily on my TradingView profile. Follow me there for full analysis and daily setups.
🔔 I post detailed trade ideas and daily market analysis like this every day on my TradingView profile.
👉 Follow me to get notified and read the full breakdowns.
