$DXY DOLLAR FALL CORRELATION WITH $BTCMacro Man1pulat10n indicates the fall could be 85pts for $DXY but could be more lower before the possible recession. Eyes ON the next weeks. Hyperbolic moves in world incoming.
Dxyindex

US Dollar Reaches 3-Month Low; Get Ready for a Reversal!I bring fantastic news that will surely get your adrenaline pumping: the US Dollar has reached a 3-month low, signaling an imminent tightening by the Federal Reserve. Buckle up as we embark on an exciting journey to profit from this potential reversal!
As astute traders, you know the US Dollar has been on a rollercoaster ride lately. However, recent developments have shed light on a significant shift that could present a lucrative opportunity for all of us. With the Federal Reserve hinting at tightening measures, it's time to gear up and take advantage of the situation.
Now, let's get down to business. I encourage you to consider shorting the US Dollar while closely examining the market for signs of an upcoming reversal. We can potentially maximize our gains and minimize risks by positioning ourselves strategically. Timing is crucial, so be prepared to act swiftly when the market shows signs of turning.
While we anticipate a reversal in the near term, it's essential to approach this opportunity with caution and maintain a balanced perspective. Market dynamics can be unpredictable, so staying informed, adapting quickly, and managing your risk is crucial. Conducting thorough research and analysis will be essential to your success.
To help you stay ahead of the game, I recommend staying updated with the latest news, economic indicators, and expert opinions. Engage in discussions with fellow traders, and leverage educational resources that can provide valuable insights into market trends. You can make well-informed decisions and capitalize on this exciting opportunity by staying informed and connected.
Remember, the forex market is dynamic and ever-changing. While we anticipate a reversal in the near term, we must remain adaptable and ready to adjust our strategies as new developments unfold. Embrace this opportunity enthusiastically, but always keep a level head and manage your risk responsibly.
In conclusion, the US Dollar's recent decline and the Federal Reserve's tightening hints have given us an exciting chance to profit from an upcoming reversal. So, let's dive into action, short the US Dollar, and position ourselves for potential gains. Stay informed, stay connected, and be ready to adapt as the market evolves.

Dollar Weakens After FED AnnouncementsAs of now, the FED interest rate decision has been announced and the FED has kept the interest rate constant. In addition to keeping it steady, Powell still made harsh and hawkish statements. Personally, I have question marks in my mind about how full these explanations are. Because now the job is not just to reduce inflation and most business sectors have started to break. I don't think it can go on like this.
If we are talking about interest rates, the only factor we need to look at is the dollar index. The dollar index has technically formed a descending triangle. The level to be seen in a down break will be $ 98.

DXY OutlookThere are endless reasons why DXY will get rejected strongly. I have explained some of them here. We can expect Bitcoin to hit 300K.

DXY index Road Map🗺️!!!(4-hour time frame⏰)DXY index managed to break the 🟢 support zone($102.24-$101.91) 🟢 and support line during the last day.
Based on the theory of Elliott waves, the DXY indicator is completing a corrective Zigzag structure(ABC/5-3-5) .
🔔I expect the main wave C to finish at the 🟢 heavy support zone($101.30-$100.82) 🟢.
U.S.Dollar Currency Index ( DXYUSD ) Analyze, 4-hour time frame⏰.
Do not forget to put Stop loss for your positions (For every position you want to open).
Please follow your strategy, this is just my Idea, and I will be glad to see your ideas in this post.
Please do not forget the ✅' like '✅ button 🙏😊 & Share it with your friends; thanks, and Trade safe.


Mind-Blowing Surge: US Dollar Skyrockets 5000% against Argentina
I come bearing astonishing news that will undoubtedly leave you stunned and intrigued. Brace yourselves for a mind-blowing revelation: the US dollar has soared an unprecedented 5000% against the Argentina peso!
Yes, you read that correctly! The US dollar's monumental surge against the Argentina peso has sent shockwaves through the forex market. This staggering increase has left many traders astounded, and rightfully so. It is a testament to the volatile nature of currency fluctuations and the potential opportunities that arise from such dramatic shifts.
As we witness this extraordinary event unfold, it is crucial to consider the implications and potential ramifications. Countries like Argentina, grappling with economic uncertainties, are now contemplating the adoption of the US dollar as a viable alternative. This development has sparked a flurry of discussions among economists and policymakers, drawing attention to the stability and strength of the US dollar in tumultuous times.
In light of this monumental shift, I urge you to carefully evaluate the potential benefits of including the US dollar in your forex strategies. One effective way to gauge the US dollar's performance against a basket of other major currencies is by monitoring the Dollar Index (DXY). This index, which measures the dollar's value against a weighted average of six major currencies, can provide valuable insights and assist in making informed trading decisions.
Considering the recent surge of the US dollar against the Argentina peso, keeping a close eye on the DXY becomes increasingly pertinent. By doing so, you can stay ahead of the curve and capitalize on potential opportunities that arise from countries considering the adoption of the US dollar.
So, fellow traders, let us seize this moment of surprise and possibility. Explore the potential of the US dollar, leverage the power of the DXY, and stay one step ahead in the ever-evolving forex market.

Technical Analysis of the US Dollar IndexA bearish cross was made between the 20-day Simple Moving Average (SMA) and the 50-day SMA on Friday, as the US Dollar Index (DXY) closed below the 100-day Simple Moving Average (SMA). After moving sideways near 50 in the past couple of weeks, the Relative Strength Index (RSI) dropped below 50.
As a key support, psychological level 102.00 (static level) aligns on the downside. As long as that level is closed below on a daily basis, there is a possibility that sellers will be attracted to the price and it may slide towards 101.50 (static level) and 101.00 (static level, psychological level) for an extended period of time.
There appears to be strong resistance at 103.00 (100-day SMA, 50-day SMA, Fibonacci 38.2% retracement of the June-May uptrend). A break above that level could lead the DXY to target 103.50 (Fibonacci 23.6% retracement) and 104.00 (psychological level) in the near future.

DXYDXY BUY
TP in the chart
SL in the chart
Good luck guys
Note: To reduce the risk on your balance
you have to use only 2% of your balance.
-
-
-
-
-
-❤️If you have any questions, please, ask me in the comment section.
Please, support my work with like, thank you!❤️.

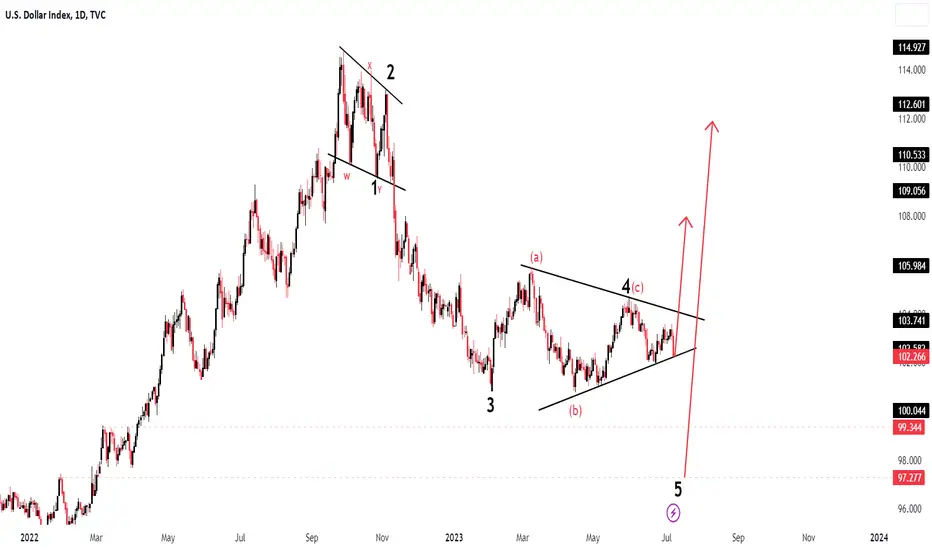
DXY Index New Possible MovePair : DXY Index
Description :
Completed " 1234 " Impulsive Wave
Divergence - RSI
Break of Structure
Impulse Correction
Bearish Channel as an Corrective Pattern in STF
S / R Level
DXY Bullish Long Term ?Price broke bearish trendline and formed higher lows. It is consolidating now. It is possible to see bullish move (long term). What do you think ?


DXY will go UP by Symmetrical Triangle🚀DXY index managed to form a Symmetrical Triangle Pattern near the 🟢 support zone($102.85-$102.66) 🟢 and support line.
DXY broke the upper line of the symmetrical triangle.
I expect the breaking of the upper line of the symmetrical triangle to be a sign for the DXY index to go up in the coming days.
U.S.Dollar Currency Index ( DXYUSD ) Analyze, 1-hour time frame⏰.
Do not forget to put Stop loss for your positions (For every position you want to open).
Please follow your strategy, this is just my Idea, and I will be glad to see your ideas in this post.
Please do not forget the ✅' like '✅ button 🙏😊 & Share it with your friends; thanks, and Trade safe.

DXY Analysis 4July2023This analysis is still the same as the last analysis, I am still bullish for this analysis. the price is currently at support, with several signs of rejection candles, there is a possibility of continuing the bullish trend again. if the price drops from support, there is a high probability that the price will retest the SnD area below.

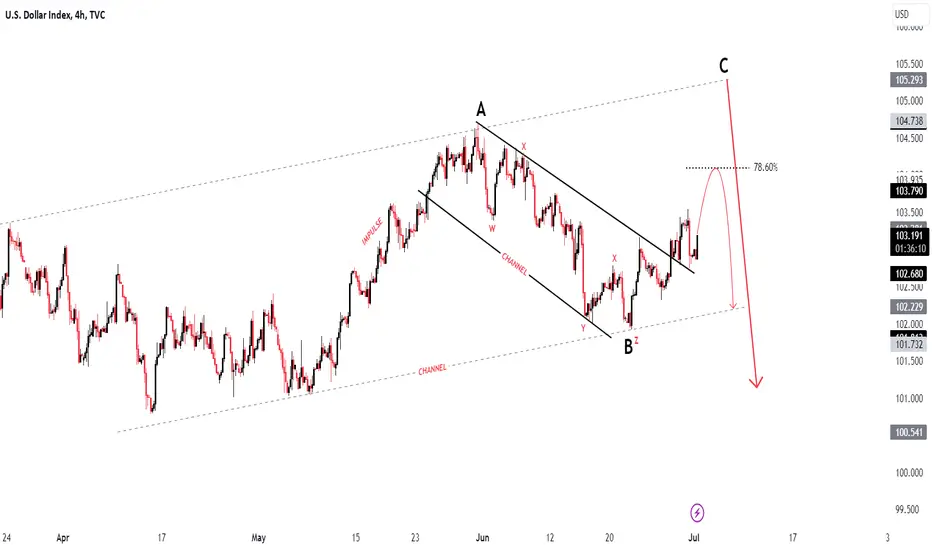
DXY Index Next Possible MovePair : DXY ( U.S Dollar ) Index
Description :
Bullish Channel as an Corrective Pattern in Long Time Frame
Completed " ABC " Corrective Wave
Divergence - RSI
Break of Structure
Impulse Correction
Fibonacci Level - 78.60%
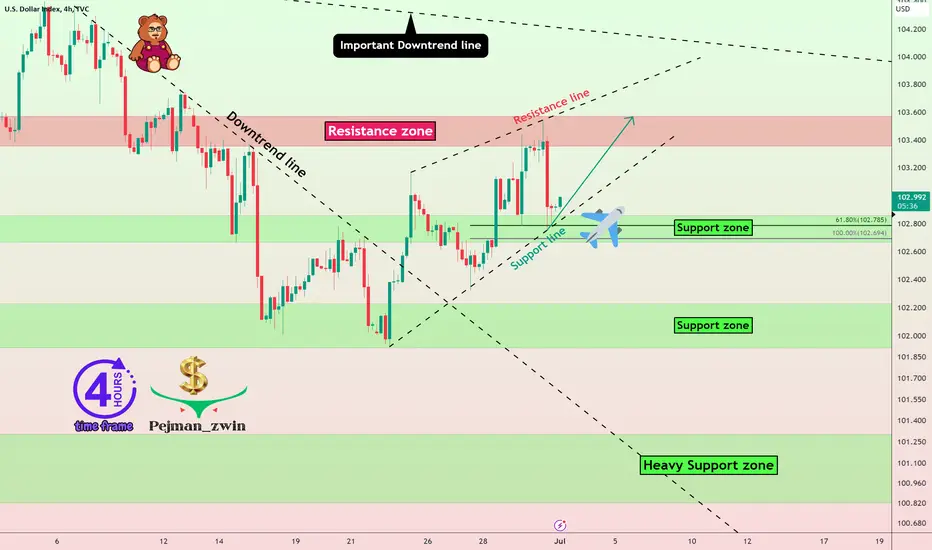
DXY ready to FLY again✈️DXY Index is moving near the 🟢 support zone($102.85-$102.66) 🟢 and support line.
In general, after the DXY succeeds in breaking the downtrend line , we should expect growth of the DXY .
I expect DXY to go ✈️ UP ✈️ again to at least the 🔴 resistance zone($103.57-$103.35) 🔴.
U.S.Dollar Currency Index ( DXYUSD ) Analyze, 4-hour time frame⏰.
Do not forget to put Stop loss for your positions (For every position you want to open).
Please follow your strategy, this is just my Idea, and I will be glad to see your ideas in this post.
Please do not forget the ✅' like '✅ button 🙏😊 & Share it with your friends; thanks, and Trade safe.