The impact of tariffs on the DXYIn the long term, the imposition of tariffs will trigger countermeasures from trading partners 😡, leading to a shrinkage of the global trade scale 😔. The import costs of raw materials for American enterprises will rise, and their export markets will be restricted, which will curb the economic growth of the United States 😩. This will exert depreciation pressure on the US dollar, causing the DXY to decline 📉.
U.S. Tariff Policies
Since April 9th, the United States has imposed tariffs ranging from 10% to 25% on goods from China, the European Union, Canada, and other regions, covering key sectors such as automobiles, steel, and semiconductors.😒
Countermeasures of Various Countries
China: On April 4th, China announced that it would impose a 34% tariff on U.S. goods starting from April 10th. On April 9th, the tariff rate was further increased to 84%, covering all U.S. goods.😠
The European Union: Announced that it would impose a 25% tariff on U.S. motorcycles, diamonds, and other goods starting from May 16th.😤
Canada: Imposed a 25% retaliatory tariff on U.S. automobiles on April 9th, but exempted auto parts.😏
This upward movement has led to the clearing of many traders' accounts or significant losses 😫. You can follow my signals and gradually recover your losses and achieve profitability 🌟.
💰💰💰 DXY 💰💰💰
🎯 Sell@103 - 100
🎯 TP 96 - 94
Traders, if you're fond of this perspective or have your own insights regarding it, feel free to share in the comments. I'm really looking forward to reading your thoughts! 🤗
Dxyindex

DXYWe are expecting DXY to give us slow push to the upside towards 101.5 level.
Disclosure: We are part of Trade Nation's Influencer program and receive a monthly fee for using their TradingView charts in our analysis.

$DXY to 100 and heading lower, bullish for $EURUSDTVC:DXY the dollar index, was the primary driver of the equity bear market in 2022. With TVC:DXY hitting a 5 year high of 114 marked the bottom in AMEX:SPY and $QQQ. The recent strength in TVC:DXY was out of stock with TVC:DXY and Stock markets rising at the same time and dropping when the TVC:DXY is falling. Usually, the risk assets have an inverse correlation to the US Dollar index. These periods in history are unusual and are marked by some kind of macro events like recession etc. With tariffs discussion everywhere that might not be unrealistic to expect some kind of recession.
In that case where is the TVC:DXY headed? Currently the TVC:DXY is at a psychological level of 100. Once it breaks below 100 the next stop might be 95. If we see some kind of soft recession which is my worst-case scenario then we might see the lows of 90 in $DXY. If TVC:DXY goes down by 10% or lower than we can expect to the FX:EURUSD to go back to its recent high of 1.23.
Verdict: Short TVC:DXY ; Long FX:EURUSD , AMEX:SPY and NASDAQ:QQQ

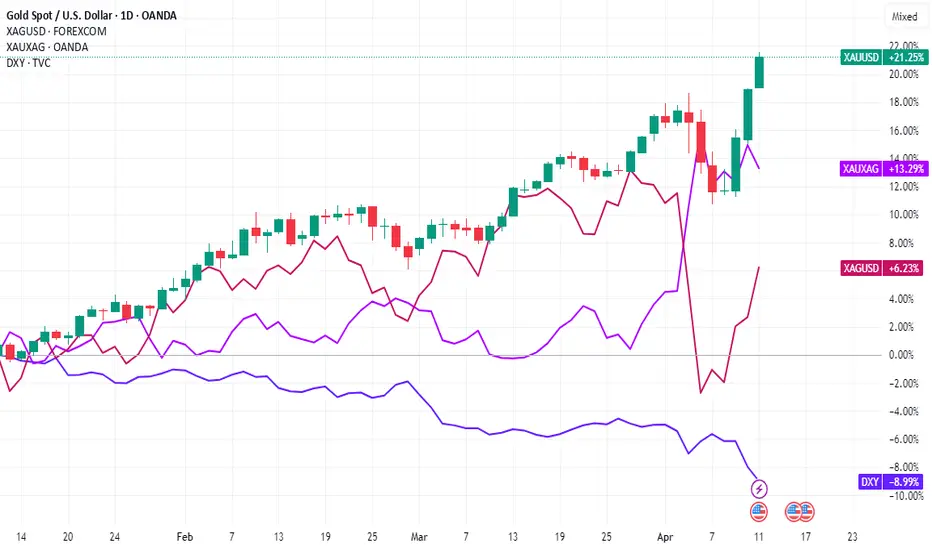
Gold & Silver Soar: Trade War RallyAnatomy of a Rally: How US-China Trade Tensions Propelled Gold to Record Highs and Lifted Silver
Introduction
The global financial landscape is frequently reshaped by geopolitical events, and few have cast as long a shadow in recent memory as the trade tensions between the United States and China. During periods of heightened friction, characterized by escalating tariffs, retaliatory measures, and pervasive economic uncertainty, markets often witness significant shifts in asset allocation. One of the most prominent beneficiaries during such times is gold. This document explores the dynamics behind gold prices reaching record highs amidst a US-China trade war, examining the multifaceted reasons for its ascent and noting the concurrent, significant rise in silver prices, which often move in tandem with the yellow metal due to overlapping market drivers.
The US-China Trade War: A Catalyst for Uncertainty
The trade conflict between the world's two largest economies represents more than just a dispute over tariffs and trade balances. It embodies a fundamental clash over technology, intellectual property, global influence, and differing economic models. The imposition of tariffs on hundreds of billions of dollars worth of goods creates direct economic consequences:
1. Increased Costs: Businesses face higher import costs, which can be absorbed (reducing profits), passed onto consumers (potentially fueling inflation), or lead to shifts in supply chains (causing disruption and inefficiency).
2. Reduced Trade Flows: Tariffs act as barriers, potentially dampening global trade volumes and impacting export-oriented economies.
3. Economic Growth Concerns: The uncertainty surrounding future trade policies makes businesses hesitant to invest and expand, potentially leading to slower global economic growth or even recessionary fears.
4. Supply Chain Disruptions: Companies reliant on cross-border supply chains face significant operational challenges, needing to find alternative suppliers or routes, often at higher costs and lower efficiency.
5. Currency Volatility: Trade disputes can lead to fluctuations in exchange rates, particularly involving the US dollar and the Chinese yuan, adding another layer of risk for international businesses and investors.
This pervasive uncertainty becomes a powerful driver pushing investors towards assets perceived as safe.
Gold: The Quintessential Safe Haven
Gold's reputation as a safe-haven asset is deeply ingrained in financial history. During times of economic stress, political instability, or market turmoil, investors flock to gold for several key reasons, all amplified by a US-China trade war:
1. Store of Value: Unlike fiat currencies, which can be devalued by inflation or government policy, gold is seen as retaining its intrinsic value over the long term. Fears that trade wars could lead to competitive currency devaluations or necessitate inflationary monetary policies (like extensive quantitative easing) make gold particularly attractive.
2. Hedging Against Uncertainty: When the outlook for traditional assets like stocks and bonds becomes cloudy due to geopolitical risks like a trade war, gold offers a perceived refuge. Its price often exhibits a low or negative correlation to equity markets during downturns, making it valuable for portfolio diversification.
3. Geopolitical Risk Premium: Major international conflicts or tensions invariably add a risk premium to gold prices. A trade war between global superpowers significantly elevates perceived geopolitical risk, prompting safe-haven buying.
4. Weakening US Dollar Potential: While the US dollar itself can act as a safe haven, a protracted trade war could raise questions about the US economic outlook or lead to policies aimed at weakening the dollar to boost exports. Since gold is typically priced in US dollars globally, a weaker dollar generally makes gold cheaper for holders of other currencies, potentially increasing demand and pushing the dollar price higher.
5. Central Bank Demand: In an environment of heightened geopolitical tension and questions surrounding the dominance of the US dollar, central banks (particularly those in emerging markets or nations seeking to reduce reliance on the USD) often increase their gold reserves. This diversification strategy provides a steady source of demand, underpinning prices. A US-China trade conflict could accelerate this trend among various nations.
6.
The Mechanics of the Price Surge
The record high in gold prices isn't just a passive reaction; it's driven by active market dynamics:
• Increased Investor Demand: Retail and institutional investors increase allocations to gold through physical bullion, gold futures contracts, and gold-backed Exchange Traded Funds (ETFs). Large inflows into major gold ETFs are often a visible indicator of this heightened demand.
• Speculative Activity: Traders in the futures market anticipate further price increases driven by the ongoing trade tensions and safe-haven flows, adding upward momentum.
• Sentiment: Market psychology plays a crucial role. As prices rise and news headlines focus on the trade war and gold's rally, a positive feedback loop can emerge, drawing in more buyers afraid of missing out (FOMO).
Silver's Ascent: Riding Gold's Coattails and Its Own Merits
Silver prices registering a steep rise alongside gold during such a period is a common phenomenon, though its drivers are slightly more complex:
1. Monetary Asset Correlation: Silver, like gold, has a long history as a monetary metal and store of value. It often trades as "poor man's gold," attracting investors seeking safe-haven exposure at a lower price point per ounce. During strong gold rallies driven by macroeconomic fear, silver typically follows suit.
2. Industrial Demand Component: Unlike gold, silver has significant industrial applications (electronics, solar panels, medical devices). This is a double-edged sword during a trade war. While safe-haven demand pulls prices up, fears of a trade-war-induced global economic slowdown could theoretically dampen industrial demand, potentially capping silver's gains relative to gold. However, in scenarios where safe-haven buying dominates market sentiment, this factor often takes a backseat initially.
3. Higher Volatility: Silver markets are smaller and typically more volatile than gold markets. This means that significant inflows driven by safe-haven sentiment can lead to sharper percentage gains (and potentially sharper losses during corrections) compared to gold. The "steep rise" noted is characteristic of silver's higher beta.
4. Gold-Silver Ratio: Traders often watch the gold-silver ratio (the number of silver ounces needed to buy one ounce of gold). When this ratio reaches historical extremes, some investors may buy silver, betting that it is undervalued relative to gold and that the ratio will revert closer to its historical mean. A major gold rally can stretch this ratio, triggering such trades and boosting silver demand.
Global Trends and Context
While the US-China trade war serves as a potent catalyst, it often occurs within a broader context of global trends that can support precious metal prices. These might include accommodative monetary policies from major central banks (low interest rates reduce the opportunity cost of holding non-yielding assets like gold), existing geopolitical hotspots beyond the US-China relationship, concerns about sovereign debt levels, or nascent inflationary pressures. The trade war acts as an accelerant, amplifying the impact of these underlying factors on gold and silver.
Conclusion
The surge of gold prices to record highs during a period marked by an intense US-China trade war is a textbook example of the metal fulfilling its traditional role as a premier safe-haven asset. The conflict breeds deep economic uncertainty, stokes fears of currency devaluation, heightens geopolitical risk perception, and potentially influences central bank reserve policies – all factors that historically drive capital towards gold. The simultaneous sharp rise in silver prices underscores its strong correlation with gold as a monetary asset, benefiting from the same wave of risk aversion, albeit with the added complexity of its industrial demand profile. Understanding these dynamics is crucial for investors navigating volatile periods, highlighting gold's enduring appeal as a portfolio diversifier and a refuge when storm clouds gather over the global economy, particularly when sparked by friction between major world powers.
DXY In Difficult Circumstances Since the Start 80's I decided to give a go at the Dollar Index given the circumstances around the world. And to be honest, I tried to put on the positive glasses.
I believe the dollar has been in a complex correction since the mid 80's. Starting out with a large dump in '85 with the a-wave, the correction slowed down and only grew more and more complex.
Thought about current wave: What I believe we are going through now is, that we are finishing up the purple C-wave in a green (C)-wave. This wave can end at any time now, since it's now at the 61.8% fib level of the purple A-wave. But it might go down to the 95 level (The green box) to complete at the 100% fiblevel of the purple A-Wave.
But first we will have the fourth wave meaning the DXY is gonna struggle for some weeks. Because we had a swift two week wave 2, which means we are probably going have a slow fourth wave according to the rule of alternation. This mean the purple C-wave could drag out into the end of '25 into early '26.
This is also with that in mind that a C-wave most likely will take longer than an A-wave. These are the Purple boxes.
BUT, after this, DXY is gonna experience some happy years again, going back up to the yellow box somewhere between 110 and 120 to finish the WXY of x of the larger degree. This will take DXY into a couple of years bull-run as long as the green (C) wave runs and completes no earlier than late '27, depending when the purple C-wave prior to the green (C) wave ends. But I believe the green (C)-wave will take about two years to complete.
But after this, DXY could again go into some dark ages and considering the high degree purple w-wave took 23 years to complete (blue giant box), there is no reason to believe this high degree purple y-wave will be a swift matter and actually don't complete before the year 2050. And it will take the DXY all the down to start 60's or lower.
The reason I said I tried to put on the positive glasses, is that I tried seeing the white channel as a leading diagonal for a new bull run, but I just don't see it as such.
I also tried seeing it as a C-wave of a flat diagonal, but this would result in another C-wave afterwards, and also take us down to the 60's level. So that didn't do us any good.
For the sake of DXY, I hope I'm wrong, but this is how I see it.

Tariff Pause. Who wins ? BITCOIN leads the surge higherI don't meed to say to much ehre, the charts tell the stiry.
All are 4 hour
BITCOIN - GOLD
DXY $ - S&P500
And BITCOIN has the highest Rise in this time.
Gold was rising as safety seemed sensible but now, Risjier asset are safe for 3 months. ( for now)
The DXY dained against other currencies, taking back gains maybe
And the S&P riases though the NASDAQ has marginally higher gains.
Europeon markets will open tomorrow with a burst I expect.
This is not accident and it is the USa showing the worlf how much control it has over world finance.
As I have said many time in thepast 3 years. The New world war is not foght with Blood, it is fought with MONEY and the USa is , once again, Showing its force.
And the fact that BITCOIN has the highest gains, is DECENTRALISED, shows you why the USa wamts as mauvh of ot as possible
BITCOIN cannot be "Owned" and used as a Tool of War.
Buy BITCOIN, Spread the Power

Gold: Economic Risks May Drive Prices UpGold Surges Amid Global Uncertainty, Testing Key Resistance
Gold has continued its impressive rebound, climbing steadily from its recent trough at $2,957 to reclaim territory above the psychological $3,000 mark. This upward momentum is being driven by a confluence of macroeconomic factors, including a softening US dollar and a pause in the previously relentless climb of US Treasury yields. With markets recalibrating their expectations around interest rate cuts by the Federal Reserve, investor appetite for safe-haven assets like gold has gained renewed strength.
At the heart of the current rally lies mounting geopolitical tension, particularly the intensifying trade standoff between the United States and China. Washington's proposal to impose 50% tariffs on a broad array of Chinese goods has rattled global markets. In response, Beijing is signaling potential retaliatory measures, further stoking fears of a prolonged economic conflict between the world's two largest economies. These developments are injecting volatility into risk assets and increasing demand for traditional hedges such as gold.
From a technical standpoint, the precious metal is currently grappling with a significant resistance level near $3,013. If the price manages to consolidate above this threshold following the current retracement, it could pave the way for a continued upward drive toward the next resistance zones at $3,033 and $3,057. These levels represent key pivot points that could dictate the short- to medium-term trajectory of gold.
On the downside, immediate support lies at $2,996, with stronger backing at $2,981. These levels may provide a cushion for any near-term pullbacks, especially as traders look for opportunities to re-enter the market during dips.
The broader narrative remains highly fluid, shaped by the ever-changing dynamics of global trade policy and monetary strategy. As the tug-of-war between Washington and Beijing intensifies, markets are left navigating a highly politicized and uncertain environment. With neither side showing signs of capitulation—China maintaining its firm stance, and the US administration likely to resist backing down—the potential for further escalation remains high.
In this context, gold’s appeal as a strategic asset grows stronger. The current setup suggests that the metal may gain additional bullish traction if it finds support around the 0.5 Fibonacci retracement level or holds above $3,013. Investors are keenly watching these technical and fundamental cues, weighing the growing economic risks that could propel gold into a sustained rally.

BTC, GOLD, DXY & S&P comparison - Who won yesterdayI have not posted this chart for a while.
For me, I find it an excellent way of looking at the general Market sentiment.
And I see determination to NOT fail.
And interestingly, It is the $ that won out yesterday ( Monday 7 April 2025 )
The charts are 4 hour.
The DXY got a Boost as other currencies fell in value against the $, so making the $ the winner.
Also interesting to see how the British £ continued to dive against the Euro, despite the lower Tariff %
But today,. Tuesday 8 April, we see the DXY is Dropping steeply as other currencies pick each other up. Going to be interesting to see how this plays out this week.
The 2nd strongest was BITCOIN with a Solid but cautious recovery.
Again, today we are seeing a pause as PA comes up under resistance.
However, the MACD is in such good shape now and the Histogram currently showing a softening of the Bear with a white candle...
This is the weekly MACD chart
We are still in early week, so we need to watch this
On the 4 hour, MACD has bounced off the OVERSOLD line and has a LOT of room to move higher, and the ability to do so. BTC PA is now like a coiled Srping...
GOLD was a surprising Looser with sharp drops and a slow sluggish recovery.
The MArket Cap on Gold is HUGE and so moving PA is tough but for me, just the fact that the "safe Haven" has been selling off shows us all that Gold is exhausted after its recent, slow, methosical rise to ATH. It is Overbought, as IIIIIIIII mentioned in a previous post when compared to BTC.
As we can see, Gold is currently Under a line of Local resistance that could prove strong enough to reject it again. We need to watch this and if it sells off, find out where the Money is going.
S&P500, like many marketd, eventually began recovering but Slowly.
The Biggest Losers and still to show recovery are London and European.
]
The chart is the London stock excahnge 4 hour. As you can see, a recovery was attempted but so far has failed. The Europeon is slightly better.
Over All, Trumps plan is working, Boosting the $ internationally against foreign currencies and Bitcoin has picked up the real money. We have yet to see the full results and things can change quickly.
To many extents, this is good timing as to upset the worlds Economies ( when gauged against he $) in Spring allows foer the dust to settle before Summer sets in and the Markets settle for the Sumer holidays ( in the northern hemisphere )
Interesting days ahead

EUR USD BUY Entry Setup 1 hour timeframe EUR USD has formed a bullish break and retest pattern on the 1 hour timeframe, following the bullish trend from last week.

Bitcoin Lost 50 SMA overnight, what next ? - still BULLISH.In a week where I am still expecting the beginnings of a bounce, we saw a Major Drop overnight.
This has pushed PA below the 50 SMA that I was hoping PA would bounce off, as it had previously.
So, Whats Next ?
It is not as bad as it may appear but CAUTION is a Very Very good idea.
There are a number of lines of support below and if we do not find any soon, 73K is the next line of Support. then down to 71K and ultimately, the long term line at 64K, though I still doubt we will get that low.
But FEAR is BIG...be a Vulture..Buy the remains of people Fear...Bitcoin IS a Scarce asset and people Still want it.
The Weekly MACD
The MACD is now in the bounce Zone. Yes, it may drop below neutral if this "Tariff Fear" continues. But Technically, We now have the ability to bounce once sentiment turns
On a slightly more bearish side is the fact that Histogram has dived deep and Red. The Bears are biting and has momentum
The RSI Relative Strength Index
Like the MACD, the RSI is now in an area where it has bounced in the past and yet, it can still drop further before we reach Neutral ( 30 line ) . It has to be said, the RSI is a bit behind the MACD in that it has a later date when it could reach Neutral. There is no guarantee that Neutral will hold RSI up....
Other Markets are struggling also
The DXY $ has had a sustained drop but is near an area of support. I am watching this closely.
Normaly, we see DXY and BTC move in opposite directions but we have seen both Recover at the same time, The lines between the teo are getting blurred.
GOLD - has been doing well for some omnths
However, in th elast 2 weeks, Gold has been selling off also and saw a steep drop towards the end of last week. Will be very interesting to see where this goes this week
The fact that Gold was selling, shows that investors were comfortable to leave a safe haven.
Lets see if that changes this weel
Conclusion for BITCOIN HOLDERS
This could all sound a little scary for Bitcoin and it should be taken as a HUGE Warning that we Lost the 50 SMA Support. This does open up the possibility of further drops and it may well happen
We are currently heading towards major support at 73K
This is an area I said we could hit a few weeks back and so I am not in a bad state of mind just yet.
If we Loose 71K, I will get uncomfortable.
The Lower timeframes are very much heading to OVERSOLD and so we shold get some support here and then we wait to see if Fear takes hold further.
This week, we Get the FOMC minutes and then Inflation data coming out of the USA
Thsi could Tip the balance either way, depending on the data
For me, I am NOT Selling Just yet.
I imagine many Short term holders will be and these coins will be snapped back up
We wait to see how today plays out
BUY THE DIP

Golden Horizons on the PrecipiceGold on the Brink of a Downturn: A Shift in Market Sentiment
Gold, once a shining symbol of financial security and prosperity, now finds itself on the cusp of a significant bearish turn. The precious metal, which has long been a safe haven for investors during times of economic uncertainty, is entering a new phase that could see its value dwindle in the face of shifting global financial conditions.
The Russian central bank, historically one of the major players in the gold market, is currently at the forefront of this market retreat. By liquidating a significant portion of its gold reserves, Russia is not just participating in the market shift, but may be sending a signal to other nations and financial institutions. Their decision to sell is not an isolated move; it could well be the beginning of a broader trend.
As the Russian central bank offloads its holdings, it's highly probable that other central banks, which have long viewed gold as an essential asset for economic stability, may soon follow suit. These institutions, often holding vast quantities of the precious metal, could begin liquidating their reserves in an effort to take advantage of the currently elevated prices. The global economic landscape is constantly in flux, and with many countries facing mounting fiscal pressures, the temptation to cash in on gold's recent price surge could become too great to resist.
Hedge funds and private investors, always looking for opportunities to capitalize on price movements, may also jump on the bandwagon. They have the flexibility and agility to react swiftly to market shifts, and with a growing consensus that gold may have reached its peak, it would not be surprising if they decide to sell off their positions in the metal. With such a large portion of the market potentially pulling away from gold, the selling pressure could intensify, leading to a sharp drop in prices.
If this trend gains momentum, we could witness a rapid and dramatic decline in gold’s value. The metal, which has been the go-to asset for many investors during times of economic uncertainty, could soon lose its appeal as a safe haven. The factors driving this potential downturn are multifaceted, ranging from shifting monetary policies and global inflationary pressures to geopolitical tensions and central bank strategies.
The impact of this market shift could be far-reaching. Not only would it affect the price of gold, but it could also send shockwaves through the broader commodities and financial markets. If the sell-off gathers pace, it could have a cascading effect, causing investors to rethink their positions in other assets traditionally viewed as safe havens, such as silver or even government bonds.
The question on many investors’ minds is whether this bearish trend is a temporary correction or the beginning of a longer-term downturn. Only time will tell, but one thing is certain: the dynamics of the gold market are shifting, and the once steady climb of the metal may now be facing a downward spiral.
For those who are closely following the market, it is essential to stay updated on the latest developments. A deeper analysis of the factors driving this potential gold sell-off and the broader market implications can offer valuable insights into the direction of this volatile asset.
As we continue to monitor the situation, I encourage you to stay informed and consider how these developments could impact your own investments. While gold may still hold value in the eyes of many, its future trajectory is now uncertain, and the risk of significant price fluctuations looms large.
Thank you for your attention, and I wish you the best of luck navigating these turbulent financial waters!

WTI , road map on high time frame
"Hello traders, focusing on WTI on high time frames, this analysis is based on the liquidity concept. Observing the chart, the price has surpassed the $69 level, which was significant for institutional orders. Consequently, I anticipate a decline towards lower prices. In my view, the next potential level could be around $64."
If you have any specific questions or require further assistance with your message, feel free to let me know!

How Worrying is the Weakening Dollar? A Departure from TraditionThe value of a nation's currency is a critical barometer of its economic health and global standing.1 Typically, in times of international turmoil or economic uncertainty, the U.S. dollar, as the world's reserve currency, tends to strengthen.2 This "safe-haven" effect is driven by increased demand for the dollar as investors seek stability and liquidity. However, recent trends have seen the greenback exhibit a notable weakening, even amidst persistent global anxieties.3 This begs the crucial question: how worrying is this deviation from the norm, and what are the potential implications for the U.S. and the global economy?
To understand the significance of a weakening dollar, it's essential to first recognize the factors that typically influence its strength. These include interest rates set by the Federal Reserve, inflation levels, the overall performance of the U.S. economy relative to others, trade balances, and geopolitical stability.4 Higher interest rates tend to attract foreign investment, increasing demand for the dollar and thus its value.5 Strong economic growth similarly boosts confidence in the currency.6 Conversely, high inflation erodes the dollar's purchasing power, while a significant trade deficit (importing more than exporting) can indicate an oversupply of the currency in global markets, leading to depreciation.
Historically, during periods of global crisis, the dollar has often acted as a port in a storm. Events like geopolitical conflicts, financial market meltdowns in other regions, or global pandemics have typically triggered a "flight to safety," with investors flocking to the perceived security and liquidity of U.S. dollar-denominated assets, thereby strengthening the currency.7 This was evident during past crises, where the dollar often appreciated as investors sought refuge from volatility elsewhere.
The current weakening of the dollar, therefore, raises eyebrows precisely because it seemingly contradicts this established pattern. While global uncertainties persist – ranging from ongoing geopolitical tensions in various parts of the world to concerns about the pace of global economic growth – the dollar has not consistently exhibited its traditional strengthening behavior. This departure suggests that underlying factors might be at play, potentially signaling deeper concerns about the U.S. economic outlook or the dollar's long-term standing.
One potential reason for this weakening could be a shift in relative economic strength. If other major economies are perceived to be on a stronger growth trajectory or offering more attractive investment opportunities, capital might flow away from the dollar, putting downward pressure on its value. For instance, improvements in economic prospects in the Eurozone or emerging markets could lead investors to diversify their holdings, reducing their reliance on the dollar.
Furthermore, concerns about the U.S.'s fiscal health, including rising national debt and persistent budget deficits, could also contribute to dollar weakness. While the dollar's reserve currency status has historically provided a buffer, a sustained period of fiscal imbalance could eventually erode investor confidence in the long-term value of the currency.8
Another factor to consider is the Federal Reserve's monetary policy. While higher interest rates typically support a stronger dollar, expectations of future rate cuts or a more accommodative monetary stance could dampen investor enthusiasm for dollar-denominated assets. If the market anticipates that the Fed will need to lower rates to support economic growth or combat deflationary pressures, this could lead to a weakening of the dollar.9
The implications of a weakening dollar are multifaceted and can have both positive and negative consequences for the U.S. economy. On the positive side, a weaker dollar makes U.S. exports more competitive in international markets, as they become cheaper for foreign buyers.10 This could potentially boost U.S. manufacturing and help to narrow the trade deficit. Additionally, a weaker dollar can increase the value of earnings that U.S. multinational corporations generate in foreign currencies, as these earnings translate into more dollars when repatriated.
However, the downsides of a weakening dollar can be significant. Firstly, it makes imports more expensive for U.S. consumers and businesses.11 This can lead to higher prices for a wide range of goods, potentially fueling inflation.12 For businesses that rely on imported components or raw materials, a weaker dollar can increase their costs of production, which may eventually be passed on to consumers.
Secondly, a sustained weakening of the dollar could erode its status as the world's reserve currency. While this is a long-term prospect, a decline in the dollar's dominance could have significant implications for the U.S.'s ability to borrow cheaply and exert influence in the global financial system.13
Thirdly, a weakening dollar could lead to concerns among foreign investors holding U.S. assets, such as Treasury bonds. If they anticipate further depreciation of the dollar, they might become less inclined to hold these assets, potentially leading to higher U.S. borrowing costs in the future.
In conclusion, the current weakening of the dollar, particularly in the face of ongoing global uncertainties where it would typically strengthen, is a trend that warrants careful attention. While a moderate depreciation can have some benefits for U.S. exports, a sustained or significant weakening could signal underlying economic vulnerabilities or a shift in global investor sentiment towards the greenback. Factors such as relative economic performance, U.S. fiscal health, and the Federal Reserve's monetary policy will likely play a crucial role in determining the future trajectory of the dollar. The departure from its traditional safe-haven status serves as a reminder that the dollar's dominance is not immutable and underscores the importance of maintaining sound economic policies to underpin its long-term strength and stability. Monitoring these trends will be critical for understanding the evolving global economic landscape and its implications for the United States.

DXY:Today's trading strategyTrump's announced comprehensive tariff plan has triggered global attention. As for the U.S. Dollar Index, on Thursday, the price of the U.S. Dollar Index generally showed a significant downward trend. On that day, the price rose to a high of 103.931 at most, dropped to a low of 101.232, and closed at 101.937.
Looking back at the performance of the U.S. Dollar Index price on Thursday, after the opening in the morning, the price continued to decline in the short term. Subsequently, the price remained weak all the way with almost no rebound. It underwent short-term oscillatory consolidation and finally closed with a large bearish candlestick on the daily chart. For now, pay attention to the resistance in the 102.80 area and the level of 102.40, and keep a continuous watch for further bearish pressure.
Trading Strategy:
Sell@102.50-102.60
TP:101.50-101.30
Get daily trading signals that ensure continuous profits! With an astonishing 90% accuracy rate, I'm the record - holder of an 800% monthly return. Click the link below the article to obtain accurate signals now!

"DXY/Dollar Index" Bull Money Heist Plan (Scalping / Day Trade)🌟Hi! Hola! Ola! Bonjour! Hallo! Marhaba!🌟
Dear Money Makers & Robbers, 🤑 💰💸✈️
Based on 🔥Thief Trading style technical and fundamental analysis🔥, here is our master plan to heist the "DXY/Dollar Index" Indices Market. Please adhere to the strategy I've outlined in the chart, which emphasizes long entry. Our aim is the high-risk Red Zone. Risky level, overbought market, consolidation, trend reversal, trap at the level where traders and bearish robbers are stronger. 🏆💸"Take profit and treat yourself, traders. You deserve it!💪🏆🎉
Entry 📈 : "The heist is on! Wait for the MA breakout (104.100) then make your move - Bullish profits await!"
however I advise to Place Buy stop orders above the Moving average (or) Place buy limit orders within a 15 or 30 minute timeframe most recent or swing, low or high level.
📌I strongly advise you to set an "alert (Alarm)" on your chart so you can see when the breakout entry occurs.
Stop Loss 🛑:
Thief SL placed at the recent/swing low level Using the 1H timeframe (103.500) Scalping/Day trade basis.
SL is based on your risk of the trade, lot size and how many multiple orders you have to take.
🏴☠️Target 🎯: 105.000 (or) Escape Before the Target
🧲Scalpers, take note 👀 : only scalp on the Long side. If you have a lot of money, you can go straight away; if not, you can join swing traders and carry out the robbery plan. Use trailing SL to safeguard your money 💰.
"DXY/Dollar Index" Indices Market Heist Plan (Scalping / Day Trade) is currently experiencing a bullishness,., driven by several key factors.
📰🗞️Get & Read the Fundamental, Macro Economics, COT Report, Geopolitical and News Analysis, Sentimental Outlook, Intermarket Analysis, Index-Specific Analysis, Positioning and future trend targets... go ahead to check 👉👉👉🔗
⚠️Trading Alert : News Releases and Position Management 📰 🗞️ 🚫🚏
As a reminder, news releases can have a significant impact on market prices and volatility. To minimize potential losses and protect your running positions,
we recommend the following:
Avoid taking new trades during news releases
Use trailing stop-loss orders to protect your running positions and lock in profits
💖Supporting our robbery plan 💥Hit the Boost Button💥 will enable us to effortlessly make and steal money 💰💵. Boost the strength of our robbery team. Every day in this market make money with ease by using the Thief Trading Style.🏆💪🤝❤️🎉🚀
I'll see you soon with another heist plan, so stay tuned 🤑🐱👤🤗🤩

DXY Bounces Back: I’m Staying BullishAfter breaking below the 104 support and hitting a low of 103.75, TVC:DXY staged a strong recovery, reclaiming support and signaling a potential false breakout.
The overnight retest of 104 established a higher low, suggesting further upside potential.
As long as 104 holds, I remain bullish and will look to sell EUR/USD and GBP/USD.

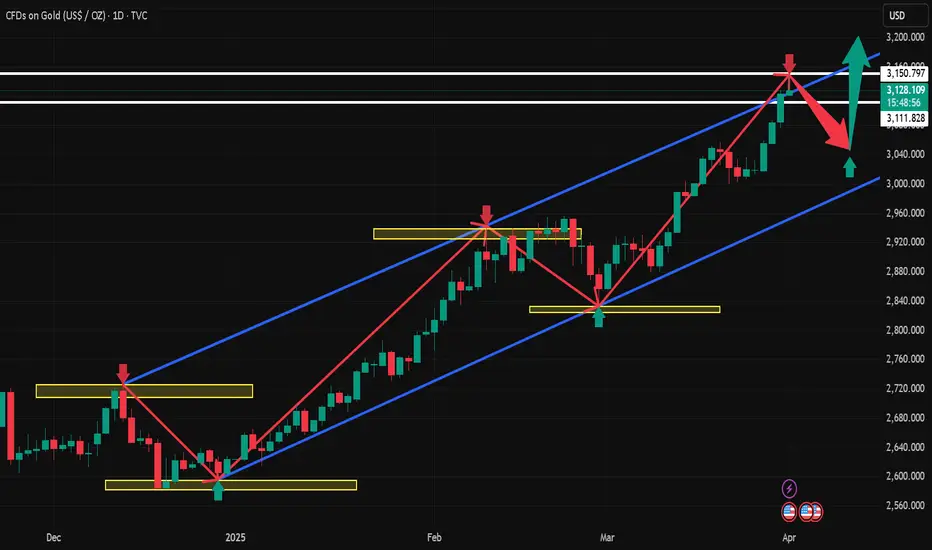
Monthly line saturated big positive line, gold and silver swordsYesterday, the gold market opened slightly higher at 3088 in the morning, and then fell back. The daily line reached a low of 3076.5, and then the market rose strongly. After breaking the 3100 integer mark, the daily line rose strongly. The daily line reached a high of 3128, and then the market consolidated widely. The daily line finally closed at 3123.8, and then the market closed with a long lower shadow. After this pattern ended, today's market still has technical bullish demand. In terms of points, after the breakout of 2940 and 2958, the stop loss followed up at 2990. Today, the stop loss of 3110 is 3105, and the target is 3128 and 3132. The breakout is 3140 and 3150-3152.
We will update regularly every day to introduce how we manage active ideas and settings. Thank you for your likes, comments and attention. Thank you very much
DXY:Seize the opportunity to sell short at high pricesThe situation in the Middle East is clearly deteriorating, which undoubtedly has a huge stimulating effect on the global risk aversion sentiment. More funds have started to seek safe havens. However, the best choice at present is not the US dollar. With the continuous rise of the East, more and more capital will favor this side of the East. Therefore, the pressure on the US dollar index is actually increasing, and it will be very difficult for it to rise.
Regarding the trend of the US dollar index today, although the current situation exerts great pressure, the actions to support the market of the US dollar index still take effect from time to time. So the price will not keep falling, and there will still be some oscillatory patterns. However, even if it moves in an oscillatory pattern, the upward pressure on the US dollar index will be significant. Therefore, when the price reaches the effective resistance level, it will be an excellent opportunity to short the US dollar index.
DXY Trading Strategy:
buy@104.500
TP:103.500
Get daily trading signals that ensure continuous profits! With an astonishing 90% accuracy rate, I'm the record - holder of an 800% monthly return. Click the link below the article to obtain accurate signals now!

Dollar IndexWe are expecting Dollar index to give us reaction above he recent top, if it corrects above the Top then NFP will push it further up otherwise break it down to break the last bottom.
Disclosure: We are part of Trade Nation's Influencer program and receive a monthly fee for using their TradingView charts in our analysis.
DXY:It is about to witness a quarterly declineBecause concerns about tariffs causing a slowdown in U.S. economic growth have pushed down U.S. Treasury bond yields, the stock market, and the U.S. dollar exchange rate. The U.S. dollar is likely to experience a quarterly decline next week, and we can seize the opportunity to short on rebounds.
Trading strategy:
buy@104.500
TP:103.500
Get daily trading signals that ensure continuous profits! With an astonishing 90% accuracy rate, I'm the record - holder of an 800% monthly return. Click the link below the article to obtain accurate signals now!
$DXY IdeaWhen analyzing the weekly DXY chart, we identify the presence of two CRTs: one bullish and one bearish. However, the bearish CRT has a low probability of success due to the candle formation and the fact that the price is still in a discounted region within the range.
Given this, our initial expectation is for the price to drop at the beginning of the week to seek liquidity in the equilibrium region of the daily range, which coincides with the 50% level of the bearish CRT. This movement may act as a correction within the predominant trend, pushing the price up toward the premium region of the weekly range. From that point, we will once again look for selling opportunities, as the market may resume its downward movement.
Based on this analysis, we initially seek selling opportunities down to the equilibrium region. Once this level is reached, we will wait for confirmation of a bullish reversal to look for buying opportunities up to the 50% mark of the bullish CRT.

DXY LONG/BUYBy utilizing Fibonacci retracement levels, historical patterns, , we can formulate a hypothesis that the market might follow a similar trajectory if bullish sentiment prevails.

DXY next possible moveWe are waiting for our asset to reach our action zone, and based on the reaction, we’ll decide on our next moves.ALWAYS WAIT FOR A CONFIRMATION TO SEE IF THE PRICE VALIDATES THE ZONE.and you what is your vision of the EURUSD its interests me! i wait you in the commentary
