DXY Dollar Index Market Bearish Heist Plan (Day/Swing Trade)🌟Hi! Hola! Ola! Bonjour! Hallo!🌟
Dear Money Makers & Robbers, 🤑 💰🐱👤🐱🏍
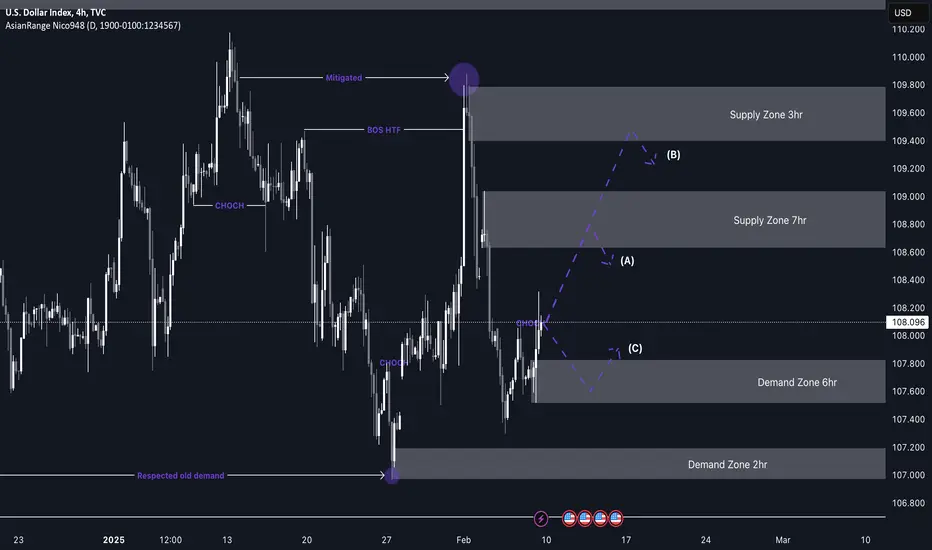
Based on 🔥Thief Trading style technical and fundamental analysis🔥, here is our master plan to heist the DXY Dollar Index Market. Please adhere to the strategy I've outlined in the chart, which emphasizes short entry. Our aim is the high-risk Green Zone. Risky level, oversold market, consolidation, trend reversal, trap at the level where traders and bullish thieves are getting stronger. 🏆💸Book Profits Be wealthy and safe trade.💪🏆🎉
Entry 📈 : "The vault is wide open! Swipe the Bearish loot at any price - the heist is on!
however I advise to Place Sell limit orders within a 15 or 30 minute timeframe. Entry from the most recent or closest low or high level should be in retest.
Stop Loss 🛑: Thief SL placed at 108.500 (swing Trade Basis) Using the 4H period, the recent / swing high or low level.
SL is based on your risk of the trade, lot size and how many multiple orders you have to take.
Target 🎯: 105.500 (or) Escape Before the Target
🧲Scalpers, take note 👀 : only scalp on the Short side. If you have a lot of money, you can go straight away; if not, you can join swing traders and carry out the robbery plan. Use trailing SL to safeguard your money 💰.
📰🗞️Fundamental, Macro, COT, Sentimental Outlook:
DXY Dollar Index Market is currently experiencing a Bearish trend., driven by several key factors.
💠Fundamental Analysis
Weakening US Economy: The US economy's growth is slowing down, which could lead to a decline in the dollar's value.
Falling Interest Rates: The US Federal Reserve's decision to cut interest rates could weaken the dollar.
💠Macroeconomic Analysis
The US economy's growth, inflation rates, and employment numbers influence the dollar's strength.
Global economic trends, such as trade tensions and geopolitical events, also impact the dollar's value.
💠COT Data Analysis
Net Short Positions: Institutional traders and large banks have increased their net short positions in the DXY Dollar Index, indicating a bearish sentiment.
COT Ratio: The COT ratio has fallen to 1.2, indicating a bearish trend.
💠Market Sentimental Analysis
Bearish Sentiment: 55% of client accounts are short on this market, indicating a bearish sentiment.
Option Skew: The 25-delta put option skew has increased to 15, indicating a bearish sentiment.
💠Positioning Data Analysis
Institutional Traders: Institutional traders and large banks are positioning themselves for a bearish trend, with some predicting a decline to 105.50.
Corporate Traders: Corporate traders are also monitoring the index's performance, considering factors like interest rates and global economic trends.
💠Overall Outlook
Bearish Trend: The DXY Dollar Index is experiencing a bearish trend, with a potential decline to 105.50.
Key Support Levels: 106.57, 105.50.
💠Technical Analysis
Moving Averages: The 50-day MA is indicating a bearish trend.
Relative Strength Index (RSI): The RSI has fallen to 40, indicating oversold conditions.
Bollinger Bands: The lower band breakout indicates a bearish trend.
⚠️Trading Alert : News Releases and Position Management 📰 🗞️ 🚫🚏
As a reminder, news releases can have a significant impact on market prices and volatility. To minimize potential losses and protect your running positions,
we recommend the following:
Avoid taking new trades during news releases
Use trailing stop-loss orders to protect your running positions and lock in profits
📌Please note that this is a general analysis and not personalized investment advice. It's essential to consider your own risk tolerance and market analysis before making any investment decisions.
📌Keep in mind that these factors can change rapidly, and it's essential to stay up-to-date with market developments and adjust your analysis accordingly.
💖Supporting our robbery plan will enable us to effortlessly make and steal money 💰💵 Tell your friends, Colleagues and family to follow, like, and share. Boost the strength of our robbery team. Every day in this market make money with ease by using the Thief Trading Style.🏆💪🤝❤️🎉🚀
I'll see you soon with another heist plan, so stay tuned 🤑🐱👤🤗🤩
Dxyindex


Gold 5hr TFGold required a stronger pullback to a zone with more confluence, and now with the DXY dropping—something that's heavily correlated—I expect gold to trend toward $3000. Silver is also showing bullish price action, which is a good sign that gold will start moving higher as well.

Eur/Usd Major Area1.0444 to 1.0422 is a major area for euro...i'm waiting to see price react to this area or not...
.................................
( This is an idea and entry-tp-sl placed for my own trade , you can change entry-tp-sl depends on your risk management )

U.S. Dollar Index (DXY) Technical Analysis1. Long-Term Uptrend & Ascending Channel
The DXY has been respecting a well-established ascending channel for over two decades, with price action bouncing between the upper and lower trendlines. This suggests a macro bullish structure, despite periodic corrections.
2. Wave Structure for Clarity
The green waves highlight significant price swings within the trend.
These waves illustrate market cycles of expansion and correction, showing how DXY has moved through phases of strength and retracement.
The current movement suggests a similar pattern is playing out, with a likely correction before the next potential leg higher.
3. Key Price Levels
Resistance at ~113.07: A major historical level where the index has faced selling pressure.
Support Zone (~100-102): The blue area represents a critical support region that has acted as a demand zone in previous corrections.
Lower Trendline (~98): If selling pressure continues, the lower boundary of the channel (~98) could act as the final line of support before a potential reversal.
4. Potential Market Scenario
The price has recently rejected the upper region and is heading toward support.
If the 102-100 range holds, a bounce toward the upper trendline (~113) is likely.
If broken, the next target would be the lower channel support (~98) before a possible long-term recovery.

DXYAfter the liquidity removal and complete filling of the weekly FVG, a short structure begins to form on lower time frames.
Targets for decline:
Target 1 = 105
Target 2 = 103.1
Target 3 = 99

Gold Teeters on the Edge: 2942 Retest Before the Big Leap!XAU/USD: Gold Eyes New Highs as Market Dynamics Align for Further Upside
Gold (XAU/USD) is once again testing its all-time high (ATH), a critical technical level that historically increases the probability of continued upward momentum. With the psychological 3000 level gradually coming into focus, the market remains on edge, closely monitoring key economic data and geopolitical developments that could fuel the next leg higher.
Current Market Conditions & Fundamental Drivers
Gold’s latest consolidation phase follows an impressive rally, maintaining its long-term uptrend while digesting recent gains. The metal remains well-supported by a combination of macroeconomic and geopolitical factors that continue to favor bullish sentiment:
Trump’s Tariff Plans: Former U.S. President Donald Trump has reiterated his stance on imposing tariffs if re-elected, a policy move that historically strengthens gold as investors hedge against trade uncertainty and inflationary pressures.
Federal Reserve’s Dovish Shift: Market expectations for the Federal Reserve to initiate rate cuts remain elevated. While Fed Chair Jerome Powell has hinted at the necessity of monetary easing, he has refrained from providing a specific timeline. This uncertainty has kept the dollar under pressure, indirectly benefiting gold.
Weakening Dollar & Falling Bond Yields: Recent Producer Price Index (PPI) data reinforced a dovish sentiment, signaling softening inflationary pressures. The dollar and U.S. Treasury yields have reacted accordingly, weakening in response and creating a more favorable environment for non-yielding assets like gold.
Markets have also digested the delay in tariff implementations and mixed messages from policymakers. While the rhetoric from Powell and Trump suggests a growing consensus on the need for lower interest rates, the lack of concrete action leaves room for speculation-driven volatility.
Technical Landscape: Key Levels & Price Structure
Gold is currently consolidating just below its ATH, with a delicate balance between profit-taking and renewed buying pressure. The key technical levels to watch include:
Resistance Levels:
$2942.6 – The immediate barrier gold needs to clear to confirm a breakout.
$2950 – A psychological and technical level that, if breached, could accelerate bullish momentum toward the much-anticipated 3000 mark.
Support Levels:
$2929 – A critical short-term support zone that has previously acted as a springboard for renewed buying interest.
$2922 – A deeper support level where buyers may step in to defend the uptrend.
$2908 – A major pivot point; a break below this level could signal a temporary shift in momentum.
Potential Scenarios & Market Outlook
Direct ATH Retest & Breakout
If gold manages to sustain its momentum and push past $2942-$2950, a test of ATH will be imminent. A decisive breakout above this level could open the doors for a rapid move toward $2975 and beyond, with $3000 becoming a realistic short-term target.
Support Retest Before Further Upside
Should gold fail to break above immediate resistance, a pullback toward $2929-$2922 remains a plausible scenario. This retracement would likely serve as a healthy correction, providing stronger support for the next leg higher.
Deeper Correction Toward $2908
While less likely in the absence of a major catalyst, a sharper decline could see gold testing $2908. Such a move would challenge the uptrend in the short term but might present an attractive buying opportunity for long-term bulls.
Market Catalysts Ahead: U.S. Retail Sales Data
The upcoming U.S. retail sales report is poised to be a key market-moving event. Strong consumer spending data could momentarily boost the dollar, exerting short-term pressure on gold. Conversely, weaker-than-expected retail numbers would reinforce the Fed’s dovish stance, adding fuel to gold’s bullish narrative.
Final Thoughts: Bullish Momentum Intact, Eyes on ATH
Gold remains in a strong uptrend, with macroeconomic factors and technical signals aligning in favor of further gains. While a support retest is possible before another rally, the overall trajectory remains bullish, with the 3000 milestone inching closer. Traders and investors should keep a close eye on resistance levels and upcoming economic data, as they could dictate the next major move in gold’s journey toward new highs.

EUR/USD Poised for a Pivotal Resistance BreachEUR/USD: Eyeing a Breakout Amid Dollar Weakness
The EUR/USD pair is navigating a critical juncture as it attempts to capitalize on the ongoing correction in the U.S. dollar. After a prolonged period of downward pressure, the price is now testing a crucial resistance level, hinting at the possibility of a breakout that could pave the way for renewed bullish momentum.
Technical Overview
Following an initial attempt to breach the overarching downtrend resistance, EUR/USD has transitioned into a consolidation phase, creating a defined trading range between 1.053 and 1.021. Within this broader structure, a more localized consolidation channel has emerged, with the price repeatedly challenging resistance at 1.038. This level is proving to be a pivotal inflection point, where market participants are carefully assessing the potential for a sustained bullish reversal.
The ongoing price action suggests that the market is still in the process of determining whether the recent correction in the dollar is sufficient to establish a structural shift in trend. A successful breakout above 1.038, followed by a decisive price stabilization above this threshold, would significantly increase the probability of continued upward movement.
Market Sentiment and Fundamental Factors
Beyond technical considerations, the fundamental landscape remains highly complex. Global economic uncertainties, compounded by the lingering effects of trade disputes and inflationary pressures, continue to shape investor sentiment. The ongoing tariff war and economic slowdown in key regions add another layer of unpredictability, making market reactions more sensitive to macroeconomic developments.
Despite these challenges, the weakening U.S. dollar provides a window of opportunity for the euro to gain traction. If the dollar correction deepens, it could further bolster the euro's position, enabling it to sustain higher levels and potentially embark on a more pronounced bullish trajectory.
Key Levels to Watch
Resistance Levels: 1.038, 1.053
Support Levels: 1.033, 1.021
A confirmed breakout above 1.038, supported by strong buying momentum and sustained price action above this zone, could unlock additional upside potential, allowing EUR/USD to advance further within the broader framework of accumulated market energy. Conversely, a failure to hold above this level may result in renewed downward pressure, keeping the pair trapped within its consolidation range.
As the market awaits further clarity, traders and investors should remain vigilant, keeping a close eye on both technical signals and fundamental catalysts that could influence the pair's next major move.


DXY Weekly BiasMy bias for this index is bearish and the price might target the Sellside Liquidity at 105.4. My Optimum Trade Entry would be around the 107.28 Zone.


Bearish drop?The US Dollar Index (DXY) has reacted off the pivot and could drop to the pullback support that lines up with the 100% Fibonacci projection.
Pivot: 107.51
1st Support: 105.72
1st Resistance: 109.67
Risk Warning:
Trading Forex and CFDs carries a high level of risk to your capital and you should only trade with money you can afford to lose. Trading Forex and CFDs may not be suitable for all investors, so please ensure that you fully understand the risks involved and seek independent advice if necessary.
Disclaimer:
The above opinions given constitute general market commentary, and do not constitute the opinion or advice of IC Markets or any form of personal or investment advice.
Any opinions, news, research, analyses, prices, other information, or links to third-party sites contained on this website are provided on an "as-is" basis, are intended only to be informative, is not an advice nor a recommendation, nor research, or a record of our trading prices, or an offer of, or solicitation for a transaction in any financial instrument and thus should not be treated as such. The information provided does not involve any specific investment objectives, financial situation and needs of any specific person who may receive it. Please be aware, that past performance is not a reliable indicator of future performance and/or results. Past Performance or Forward-looking scenarios based upon the reasonable beliefs of the third-party provider are not a guarantee of future performance. Actual results may differ materially from those anticipated in forward-looking or past performance statements. IC Markets makes no representation or warranty and assumes no liability as to the accuracy or completeness of the information provided, nor any loss arising from any investment based on a recommendation, forecast or any information supplied by any third-party.

EUR/USD on high time frame
"Regarding EUR/USD on high time frames, as per my recent analysis, the price has shifted towards a bullish momentum. I anticipate the price to surpass the mitigated order block on the 4-hour chart and reach the 1/1 price zone on the weekly and daily time frames. However, this analysis would be invalidated if the price closes below 1.02 on the daily time frame."
If you have any specific questions or if you need further assistance with your text, please let me know!

$BTC.D and $DXY are in diametrically opposite directionsIn this blog space we have been discussing Bitcoin Dominance ( CRYPTOCAP:BTC.D ) since Dec 2024. On 9th Feb 2025 I posted a blog where we discussed the Fib Retracement levels in CRYPTOCAP:BTC.D chart and we said that we can expect more upside and has broken past 0.618. I said it is possible that the dominance can reach the 0.786 Fib level at 66.12%.
I tried to plot the Dollar index TVC:DXY in the same weekly chart as CRYPTOCAP:BTC.D and it was quite surprising that the FIB retracement levels in CRYPTOCAP:BTC.D are the same as the top to the bottom levels in the TVC:DXY chart. We are looking at the last 5 years for our analysis.
When CRYPTOCAP:BTC.D has broken past 0.618 Fib level and trying to reach 0.786 @66.12%. But the TVC:DXY has broken below 0.786 and in the near term the TVC:DXY level can end up at 0.618 Fib levels which can take TVC:DXY to 104.
So, in the near to medium term is CRYPTOCAP:BTC.D @ 66.12% and TVC:DXY @ 104.

Elliott Wave Insight: DXY Correction to 100 ?PEPPERSTONE:USDX TVC:DXY TVC:DXY CAPITALCOM:DXY
📊 DXY Analysis with Elliott Waves 🌊
Wave (B) appears to be completing around 109.
A corrective decline toward the 100 zone (Wave (C)) is likely.
Key Fibonacci targets: 100% at 95.06 and 127.2% at 90.93.
🔎 Keep an eye on price action near these levels for potential reversals.
⚠️ Disclaimer : This analysis is not financial advice. Always conduct your own research before investing.

Gold: Northbound GoGold Market Outlook: Northbound Momentum Persists Amid Inflation and Trade Concerns
XAU/USD Rebounds from Inflation Shock, Poised for Further Gains
Following a temporary shakeout triggered by inflation data, gold (XAU/USD) has regained its bullish momentum, reinforcing the narrative of an ongoing uptrend. The precious metal demonstrated remarkable resilience, bouncing back from its dip to $2,865 and reclaiming higher levels as buyers stepped in swiftly. Currently, gold is navigating a pivotal zone around $2,908, a level that could determine the next major price move. Key upcoming events, such as the release of U.S. Initial Jobless Claims and Producer Price Index (PPI) data, will likely influence gold's trajectory in the short term.
Macroeconomic Landscape: Inflation, Fed Policy, and Trade Risks
The broader macroeconomic environment remains supportive of gold, primarily driven by persistent inflationary pressures and uncertainty surrounding U.S. trade policy. Former President Donald Trump’s proposed tariffs have injected fresh uncertainty into the global economic landscape, further bolstering demand for safe-haven assets like gold. Meanwhile, the Federal Reserve continues its hawkish stance in response to rising inflation, resulting in higher bond yields that temporarily pressured gold prices downward. However, investors quickly capitalized on the dip, reinforcing the metal’s strong underlying demand.
The upcoming PPI report will be a critical factor in shaping market expectations for the Fed’s next move. Should inflationary pressures remain elevated, gold could benefit as investors hedge against potential economic turbulence. Conversely, a softer PPI reading might provide temporary relief for the dollar and yields, exerting short-term pressure on gold.
Technical Analysis: Key Levels and Market Sentiment
Gold’s price action suggests that the market is in a consolidation phase within a key support zone. The $2,900–$2,908 range has emerged as an important battleground for bulls and bears. If buyers maintain control above $2,908, the potential for gold to retest and surpass its all-time high (ATH) in the medium term remains strong.
Key Resistance Levels:
$2,920: A critical near-term level that, if breached, could accelerate bullish momentum.
$2,929: A significant resistance point that could attract selling pressure but, if surpassed, would signal continued strength.
$2,942: A breakout above this level could set the stage for a new price discovery phase.
Key Support Levels:
$2,908: The immediate support level that must hold to maintain bullish sentiment.
$2,902: A deeper retracement zone that could serve as a springboard for another leg higher.
Additionally, traders should closely watch the $2,918–$2,920 region, as consolidation above this zone would reinforce bullish momentum and increase the likelihood of an extended rally.
Conclusion: Gold’s Path Forward
Gold remains well-supported by macroeconomic uncertainties and inflationary concerns, with technical indicators pointing to further potential upside. While short-term fluctuations may occur in response to economic data releases, the broader trend suggests that XAU/USD is positioned to continue its northbound journey. Investors should monitor price action around key levels, as a successful defense of support at $2,908 or a decisive break above $2,920 could confirm the next directional move.
With the Federal Reserve’s policy stance and geopolitical risks in focus, gold remains a crucial asset for portfolio diversification and risk management. As market participants await further economic data, the precious metal's resilience underscores its role as a preferred safe-haven asset in times of economic uncertainty.

Scenario on DXY 13.2.2025I would see the dollar index like this if I was considering going short I would first consider going above the monthly level of 108.048 if the market continued then I have one more SFP at a price around 108.6 if I was going to talk about a long position then first around the monthly level of 107.053 then the next one below the daily level of 106.724.

Gold Alert: Testing 2881 Risk Zone!Gold at a Crossroads: Awaiting Key Triggers
XAUUSD is navigating a critical juncture, testing a pivotal risk zone that could dictate its next major move. From this level, we either witness a trend continuation or a deeper corrective phase.
Key Drivers: CPI Data & Policy Uncertainty
All eyes are on the upcoming US CPI report, which could inject fresh momentum into the market. Inflation figures will play a decisive role in shaping expectations for the Federal Reserve’s next steps, influencing both gold and the broader financial landscape.
Meanwhile, geopolitical and economic uncertainties add complexity. The Wall Street Journal reports that the Biden administration is preparing new tariffs, which could introduce fresh volatility and global economic risks. At the same time, Fed Chair Jerome Powell has signaled a cautious stance, reinforcing expectations of only a single rate cut in July. This has pushed bond yields higher, creating additional headwinds for gold.
Technical Outlook: Key Levels to Watch
Resistance: 2898, 2910, 2929
Support: 2881, 2870, 2855
Potential Scenarios:
🔹 Bullish Case: A false break below 2881 could signal ongoing bullish momentum. If buyers defend the 2881 – 2885 zone, gold may stage a rally towards 2930 – 2950 in the short to medium term.
🔹 Bearish Case: A decisive break and consolidation below 2881 could trigger a wave of liquidation, driving prices lower towards 2855 – 2848.
Market Sentiment: A Stalemate Before the Storm
With crucial news ahead, the market is at a tipping point. Whether gold surges or sinks depends on inflation data, Fed policy clarity, and potential tariff developments. Traders should brace for volatility as these catalysts unfold.

Eur/Usd Buying at Golden PocketLast trade closed with 30% profit....
i'm buying at this area...i'm bullish on euro for this week...

#DXY 1DAYDXY (1D Timeframe) Analysis
Market Structure:
The price has broken below the uptrend support, signaling a potential shift from bullish to bearish momentum. This breakdown indicates that buyers were unable to sustain the upward trend, leading to increased selling pressure. Additionally, a sell engulfing candlestick has formed, further confirming bearish sentiment.
Forecast:
A sell opportunity is expected as the breakdown of uptrend support and the sell engulfing pattern suggest further downside movement.
Key Levels to Watch:
- Entry Zone: After a confirmed breakdown and possible retest of the broken support as resistance.
- Risk Management:
- Stop Loss: Placed above the broken support or recent swing high.
- Take Profit: Target lower support zones for potential downside movement.
Market Sentiment:
The combination of the uptrend support breakdown and a sell engulfing pattern indicates that bearish momentum is increasing. Waiting for confirmation of continued selling pressure will help align with the prevailing market trend.


DXY Weekly BiasMy bias for this index is bearish considering that we retested and confirmed the Weekly Bearish Order Block at 109.65.
I do anticipate that the index might be attracted towards Sellside Liquidity at 107.27, 106.95 ,and 105.4.
Our daily setup will further give us the best entry and stop loss.

DXY (Dollar index) short from 108.800My DXY analysis aligns with the expectation of a bearish move, which suggests that my pairs—EU and GU—could push higher. However, before that, we may see a minor pullback as price moves toward a demand zone.
Price has recently broken structure to the upside, leaving behind a fresh demand level. Once price reaches this area, I anticipate accumulation before a potential move upward. I will look for opportunities to capitalize on this movement across the pairs I trade, such as Gold, EU, and GU.
The price action has been very clean so far, which is promising, and we can expect more of the same as we move further into Q1.
Have a great week ahead and remain vigilant!