DXY LOOKING STRONGdxy continue to make historical tops.
Higher highs and higher lows on the way..
CPI data came higher than expected and interest rate expectation changed from 75bp to 100bp
Under theese circumstances no reason to think that DXY will get lower.
So it seems that cash will rise as crypto continue to suffer..
Dxylong

DXYThe main direction of the price is still upward.
Everything is clear in the chart.
This is my personal opinion. Please do not trade based on my analysis and data.

DXY - US Dollar Indexthe US Dollar Index (DXY), leaves behind two consecutive daily drops and advances to new cycle tops past 108.60 on Thursday.
The US Dollar Index, also known as DXY, is used by traders seeking a measure of the value of USD against a basket of currencies used by US trade partners. The index will rise if the Dollar strengthens against these currencies and will fall if the Dollar weakens against these currencies.
1207 Dollars Index now is targeting 111.2Hello traders,
Dollars got a breakout after NFP last Friday.
EURUSD now only 1.0, this is written in history now.
Dollars could take a correction back to 107.5-108 before any new leg up.
Take your chance to join the buyer team.
I dont think any discussion here to anticipate the end of bull trend for DOLLARS is helpful for now. So why not just follow its main trend and try to find your chance.
Sell EURUSD when you got a chance. Also GOLD.
GOOD LUCK !!!
LESS IS MORE!

USD Inverted Head and ShouldersUSD has been climbing like crazy so it's hard to believe that it's got a lot higher to go but I'm pretty sure it does.
Some T/A that supports this thesis is the inverted head and shoulders pattern on this 6 month chart which gives a short term target in a range that extends all the way to $110.

The USD is going to zero relative to BitcoinEarly today I was talking with a good trader friend, whom I respect very much, about Bitcoin. I said that "the U.S. dollar is going to zero relative to Bitcoin". My statement seemed to have ruffled his feathers quite a bit and he replied in a manner that suggested I was ludicrous for thinking that Bitcoin could ever be more valuable than the dollar, or that the dollar could ever go to zero.
Interestingly, though, the fact is that mathematically speaking, the U.S. dollar has already effectively gone to zero relative to Bitcoin over the past decade, as the above chart shows.
The equation 1 over BTCUSD is mathematically the same as USD/BTC or the relative value of the USD to BTC. As the chart shows, the USD is approaching zero relative to Bitcoin, and despite the "crypto winter" the trend is still holding up.
Notice, interestingly that the 20 EMA is resisting further declines in the relative value. While this single metric may not indicate the absolute bottom is in for Bitcoin, it is a fact that the USD/BTC equation suggests, to a higher degree of mathematical certainty, that the US dollar has already and will continue to move ever closer to zero relative to the value of Bitcoin. It's hard for people who do not understand logarithmic growth and decay to look at the Bitcoin chart and see anything but a shattered bubble right now (in 2022). I have seen multiple reputable traders try to impose a measured move on Bitcoin invalidly projecting it into negative numbers. Meanwhile, the trend is holding up, and between the US dollar and Bitcoin, over the long term, the logarithmic decay will likely continue for the U.S. dollar as measured relative to Bitcoin.
Indeed, the fact that the value of the dollar is going to zero on a relative basis is nothing new. This very fact is why we almost always have some degree of inflation, and very rarely deflation. With each new dollar printed the previously printed dollars are worth less. The chart below shows the downward movement of the value of the U.S. dollar toward zero relative to its past value. At some points in history, such as when the Federal Reserve moved away from the gold standard and when it began quantitative easing, the dollar's move toward zero has accelerated. This is logarithmic decay.
While the U.S. dollar is and always has been moving toward zero relative to its past value, it has not been until the past decade or so that a decentralized cryptocurrency using blockchain technology has come into existence as a means to hedge the dollar's decline. Anyone who does not hold any Bitcoin in their portfolio whatsoever as a long-term investment will regret it in the decades to come. Right now Bitcoin is on sale because the Federal Reserve has been reducing the money supply to curve inflation and temporarily giving the dollar a relative bump. This is a mere hiccup in the broader trend of the log curve growth in Bitcoin relative to the USD.
It's simple math and simple economics. Supply and demand dictate price. While the Federal Reserve will eventually restart the printing press and print limitless more U.S. dollars, the number of new Bitcoin coming into existence will be much less and is ultimately finite. Both Bitcoin and the U.S. dollar are fiats in the sense that the actual asset does not have inherent worth, both are merely valuable so long as people's faith in the underpinnings of the asset remains. While the U.S. dollar's status as the reserve currency diminishes over time, Bitcoin's adoption continues to grow.
Only time will tell which currency will be a better store of value over time, but the charts and the basics of economics make clear that a finite asset like Bitcoin inevitably is a better means of storing wealth than holding cash. So long as the money supply continues to grow exponentially, the value of the dollar will follow a logarithmic decay.
To have all your eggs in one basket, regardless of which basket, will likely prove a bad decision over the long term.

Positive cup and handle for DXYA positive cup and handle pattern formed for the dollar
on the daily interval, and its target is most likely 10.387

AUDUSD bout to go down underA couple of key factors here need to come into play, inflation figures need to come back worse than expected in July, followed by the fed becoming more hawkish with their monetary policy. Australia will follow suit and hit that cash rate target of 3-4%. Cost of living isn't taking a reprieve and the mining industry isn't saving the australian economy atm. If we see a reversal of QT from the fed we could see a bounce in risk on markets. But for now the USD looks to reign supreme. Shorting the bear flag to 0.6780 with a breakdown in the support we could see a bearish continuation to 0.6100! Things are getting spicy and you're kidding yourself if you think the markets seen the last of volatility. NFA DYOR

DXY more room for up before short sell DXY or dollar index had saw a nice bullish momentum for the upside, and that because of the inflation and the delta between dollar fed fund rate and the other foreign currencies rates.
last week a ECB member told the press that the ECB will start to raise rates gradually this year to fight against inflation, this will narrow the gap between interest rates.
DXY can push more up for this moment to 110.00 level before facing a major threshold where United States Dollar will be less attractive in comparison to other currencies.

DXY Idea H1Here is my view for DXY on H1. The price could go up, you can put a pending order on the Order block or find an entry on LTF within OB Zone. Trade Safe!

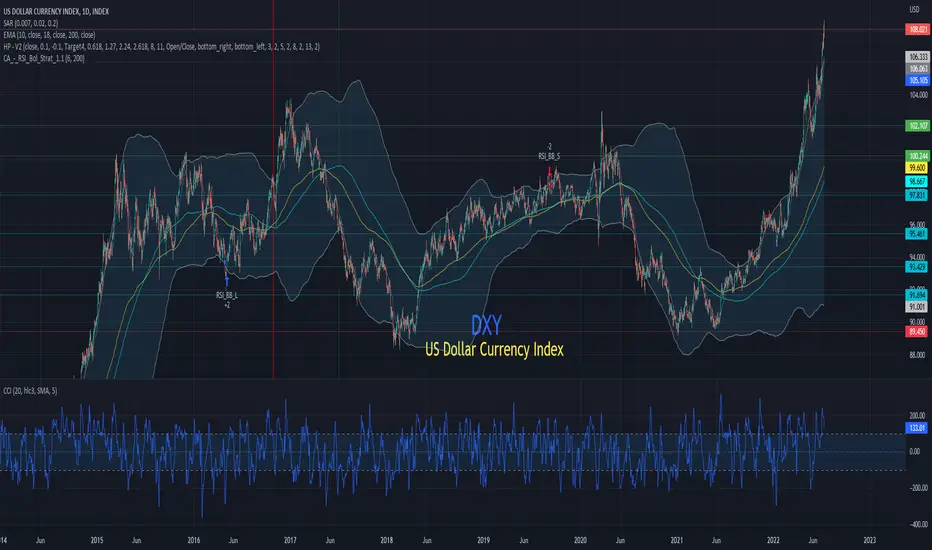
Did the Dollar Index Just Top?This is a chart of the U.S. dollar currency index with Fibonacci Retracement levels applied.
These Fibonacci levels take the entire history of the dollar index into account as they were drawn from the all-time high in 1985 to the all-time low in 2008.
On the bottom is the monthly RSI. It is extremely rare for an asset to create bearish divergence on a timeframe as high as the monthly chart, as the dollar index just did at the close of June!
Specifically, the dollar index closed June with a higher price than it closed in April but with a lower RSI. When price continues to move higher but the RSI moves lower this is a bearish divergence, and it usually indicates a reversal especially when the divergence occurs at overbought RSI levels. Bearish divergences have similarly been occurring on the weekly timeframes for the dollar index. These divergences are used by experienced traders as sell signals.
Neither the commodity charts nor the Eurodollar Futures are confirming the dollar index's continued move higher.
With the economy slowing rapidly, there's little reason to believe that the Fed will become any MORE aggressive than it already is. If the Fed will not get any more aggressive than is already priced in, the dollar index should not go any higher.
While anything can happen, now that the dollar index has even reached a Fibonacci level, it seems quite likely that a major top is underway.

Jamie Gun2Head - Buying DXYTrade Idea: Buying DXY
Reasoning: Breaking through resistance, looking for the move higher to be extended today
Entry Level: 107.32
Take Profit Level: 107.93
Stop Loss: 107.02
Risk/Reward: 2.03:1
Disclaimer – Signal Centre. Please be reminded – you alone are responsible for your trading – both gains and losses. There is a very high degree of risk involved in trading. The technical analysis , like all indicators, strategies, columns, articles and other features accessible on/though this site is for informational purposes only and should not be construed as investment advice by you. Your use of the technical analysis , as would also your use of all mentioned indicators, strategies, columns, articles and all other features, is entirely at your own risk and it is your sole responsibility to evaluate the accuracy, completeness and usefulness (including suitability) of the information. You should assess the risk of any trade with your financial adviser and make your own independent decision(s) regarding any tradable products which may be the subject matter of the technical analysis or any of the said indicators, strategies, columns, articles and all other features.

DXY LONG!!!The price will go up!! Expect BTC to crash!! I can't wait for the whole manipulation to be over!

Flight to safetyWith Burry saying we still have 50% more downfall to go - that leads me to think the DXY has quite a bit more room to run (along with plenty of other macroeconomic contributing factors of course) I just decided to single out Burry lol.
I can easily see a ~120 DXY which would be carnage for stocks and crypto - earlier today I saw that the the euro/dollar had collapsed to it's 20 year low which is just more fuel for DXY to run higher.
The VIX is also telling us something big is brewing. Should be a big week.

DXYPossible long after coch & imb retest confirmed by 2hr ob. sl below ob, below imb or low. tp new high

DXY bullish case scenario. I'm looking at DXY monthly chart from bullish side. I expect it pump and reach a broken horizontal rectangle target with double top and strong rejection. In this case BTC will drop to 10-12K and when DXY hits its target and starts drop BTC starts its 5th leg up.
