US Dollar Index - 4h Chart (CAPITALCOM)4-hour chart of the US Dollar Index (DXY) from CAPITALCOM shows the index's recent price movements. The current value is 96.955, with a slight increase of 0.054 (+0.06%). Key levels include a support at 96.413 and resistance at 97.554. The chart highlights buy signals at 97.012 and sell signals at 96.958 and 96.955, with a notable downward trend breaking below a support zone around 97.150.
Dxysell

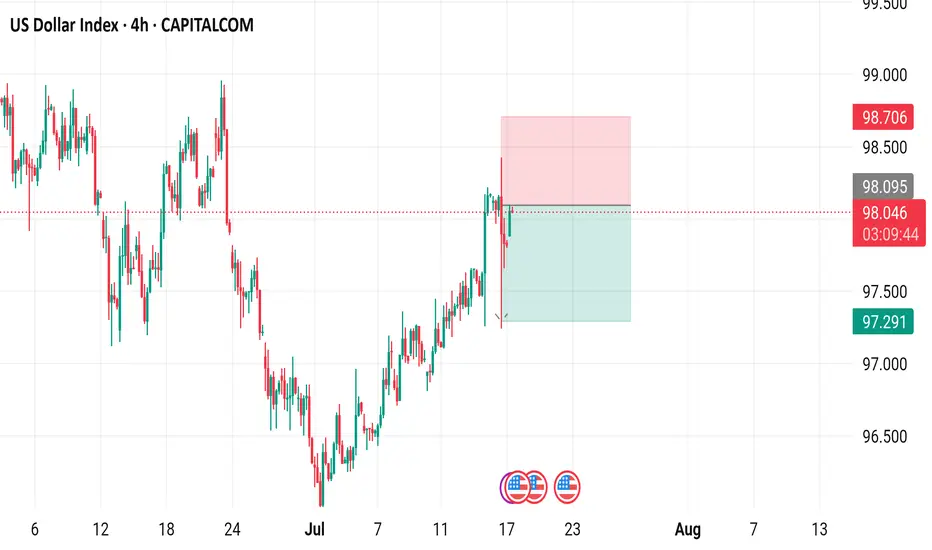
US Dollar Index (DXY) - 4 Hour Chart4-hour performance of the US Dollar Index (DXY) from CAPITALCOM, showing a current value of 98.040 with a 0.23% increase (+0.222). The chart includes recent buy and sell signals at 98.094 and 98.040, respectively, with a highlighted resistance zone around 98.706-99.000 and a support zone around 97.291-98.040. The timeframe covers data from early July to mid-August 2025.
U.S. Dollar Index (DXY) Bearish Setup – Supply Zone Rejection & 🔹 Trend Overview
📊 Overall Trend: Bearish (Downtrend)
📉 Price is forming lower highs and lower lows within a descending channel.
🔻 Recently bounced off a support zone, now heading toward a potential pullback.
🔵 Supply Zone (Resistance Area)
📍 Zone Range: 100.049 – 100.601
🧱 Acts as a resistance block where sellers might step in.
📏 Confluent with EMA 70 at 100.178, strengthening its validity.
🔸 Trade Setup – Short Position
🟠 ENTRY POINT: 100.088
❌ STOP LOSS: 100.587 – 100.595 (Just above supply zone)
🎯 TARGET: 98.000 (With intermediate support levels)
📌 Support Levels
🔹 98.112 – First minor support
🔹 98.106 – Close-range confirmation
🔹 97.885 – Additional support zone
🟦 Main Target: 98.000
⚖️ Risk/Reward Ratio
🟧 Small risk above supply zone
🟩 Large reward to downside = Favorable R:R
📌 Summary
📈 Expecting a pullback into supply zone.
🧨 Look for bearish confirmation around 100.088.
🎯 Target the downside at 98.000 for profit.

The DXY shows a downward tendency.In the long run, the implementation of tariffs will prompt trading partners to take countermeasures 😡, resulting in a contraction of the global trade scale 😔. American enterprises will face higher import costs for raw materials, and their export markets will be restricted, thus curbing the economic growth of the United States 😩. This will put depreciation pressure on the US dollar, causing the DXY to decline 📉.
U.S. Tariff Policies
Since April 9th, the United States has levied tariffs ranging from 10% to 25% on goods from China, the European Union, Canada, and other regions. These tariffs cover crucial sectors like automobiles, steel, and semiconductors 😒.
Countermeasures of Various Countries
China: On April 4th, China declared that it would impose a 34% tariff on U.S. goods starting from April 10th. Then, on April 9th, the tariff rate was further hiked to 84%, applying to all U.S. goods 😠.
The European Union: Announced that it would impose a 25% tariff on U.S. motorcycles, diamonds, and other goods as of May 16th 😤.
Canada: On April 9th, imposed a 25% retaliatory tariff on U.S. automobiles, while exempting auto parts 😏.
💰💰💰 DXY 💰💰💰
🎯 Sell@ 100 - 101
🎯 TP 98 - 97
Traders, if you're fond of this perspective or have your own insights regarding it, feel free to share in the comments. I'm really looking forward to reading your thoughts! 🤗
👇The accuracy rate of our daily signals has remained above 98% within a month! 📈 We sincerely welcome you to join our channel and share in the success with us! 👉

U.S. Dollar Index (DXY) – Key Resistance & Bearish Target Analys📊 Key Observations:
🔵 Resistance Zone (📍~103.5 Level)
A strong resistance area (🔵 blue box) is marked, indicating potential selling pressure if the price reaches this level.
The price is moving upwards (📈) towards this resistance, so watch for rejection or breakout.
🔵 Support/Target Zone (📍~101.5 Level)
A lower support zone (🔵 blue box) is marked as the bearish target 🎯.
If the price fails at resistance, it may head downwards (📉) to this level.
📉 Recent Price Action:
🚀 Sharp drop followed by a rebound (📈).
The price is currently moving back up (🔼), possibly forming a lower high before another drop.
📌 Exponential Moving Average (DEMA 9 - 102.488)
The price is hovering above the 9-period DEMA (📏), showing short-term bullish momentum.
If the price rejects resistance and falls below the DEMA, a bearish continuation (📉) is likely.
🚀 Potential Scenarios:
✅ Bullish Breakout: If price breaks above 🔵 resistance, it may continue rising (📈) to higher levels.
❌ Bearish Rejection: If price fails at resistance, expect a drop (📉) towards 101.5 🎯.

The impact of tariffs on the DXYIn the long term, the imposition of tariffs will trigger countermeasures from trading partners 😡, leading to a shrinkage of the global trade scale 😔. The import costs of raw materials for American enterprises will rise, and their export markets will be restricted, which will curb the economic growth of the United States 😩. This will exert depreciation pressure on the US dollar, causing the DXY to decline 📉.
U.S. Tariff Policies
Since April 9th, the United States has imposed tariffs ranging from 10% to 25% on goods from China, the European Union, Canada, and other regions, covering key sectors such as automobiles, steel, and semiconductors.😒
Countermeasures of Various Countries
China: On April 4th, China announced that it would impose a 34% tariff on U.S. goods starting from April 10th. On April 9th, the tariff rate was further increased to 84%, covering all U.S. goods.😠
The European Union: Announced that it would impose a 25% tariff on U.S. motorcycles, diamonds, and other goods starting from May 16th.😤
Canada: Imposed a 25% retaliatory tariff on U.S. automobiles on April 9th, but exempted auto parts.😏
This upward movement has led to the clearing of many traders' accounts or significant losses 😫. You can follow my signals and gradually recover your losses and achieve profitability 🌟.
💰💰💰 DXY 💰💰💰
🎯 Sell@103 - 100
🎯 TP 96 - 94
Traders, if you're fond of this perspective or have your own insights regarding it, feel free to share in the comments. I'm really looking forward to reading your thoughts! 🤗

U.S. Dollar Index (DXY) - Bearish Breakdown or Reversal?📊 U.S. Dollar Index (DXY) - 4H Chart Analysis
🔵 Supply Zone (104.400 - 104.683)
🟦 Resistance area where sellers may step in 📉
🟡 Key Level (~104.200)
🟧 Decision point – price struggling to hold this level
📉 Trend Line (Broken) 🔻
❌ Previous uptrend is broken, signaling potential bearish momentum
🟢 Demand Zone (103.200 - 103.400)
🟩 Support area where buyers may get active 📈
🚀 Potential Market Movement:
1️⃣ Bearish Breakdown Expected ⬇️
🔹 Price broke below trendline ➡️ selling pressure increasing
🔹 Possible pullback to key level (~104.200) before more downside
🔹 Targeting demand zone (~103.200-103.400) 🎯
2️⃣ Invalidation/Stop-Loss 🚫
🔺 If price moves back above 104.683, bearish setup is invalid
🔺 Stop-loss placed at 104.683 for risk management
🎯 Trading Strategy:
✅ Short Entry: After pullback near 104.200
🎯 Target: 103.200 demand zone
⚠️ Stop Loss: Above 104.683

U.S. Dollar Index (DXY) – Bearish Outlook with Key Levels📉 Bearish Bias on U.S. Dollar Index (DXY) – 4H Chart
🔹 Resistance Zone & Stop Loss 🚫
📍 Resistance: 104.200 - 104.432
🛑 Stop Loss: 104.432 (Above resistance zone)
🔸 Support Zone 🛠️
📍 Intermediate Support: 103.300 (Possible bounce)
🔻 Target Point 🎯
📍 Target Price: 102.232 (Expected downside)
📊 Price Action Outlook:
✅ Bearish Scenario:
Price rejected from resistance 🔽
Lower highs forming ⚡
Breakdown expected toward 102.232 🎯
❌ Invalidation:
If price breaks above 104.432, bearish setup fails 🚫
🔥 Conclusion:
⬇️ Sell Bias below 104.200 targeting 102.232
❌ Cut losses if price closes above 104.432

US Dollar Index Short Term Sell IdeaH4 - Strong bearish momentum
Lower lows
Until the two strong resistance zones hold my short term view remains bearish here.

DXY "DOLLAR INDEX" Market Money Heist Plan on Bullish SideHii! My Dear Robbers / Money Makers & Losers, 🤑 💰
This is our master plan to Heist DXY "DOLLAR INDEX" Market Market based on Thief Trading style Technical Analysis.. kindly please follow the plan I have mentioned in the chart focus on Long entry. Our target is Red Zone that is High risk Dangerous level, market is overbought / Consolidation / Trend Reversal / Trap at the level Bearish Robbers / Traders gain the strength. Be safe and be careful and Be rich.
Entry 📈 : Can be taken Anywhere, What I suggest you to Place Buy Limit Orders in 15mins Timeframe Recent / Nearest Low Point take entry in pullback.
Stop Loss 🛑 : Recent Swing Low using 2H timeframe
Attention for Scalpers : Focus to scalp only on Long side, If you've got a lot of money you can get out right away otherwise you can join with a swing trade robbers and continue the heist plan, Use Trailing SL to protect our money 💰.
Warning : Fundamental Analysis news 📰 🗞️ comes against our robbery plan. our plan will be ruined smash the Stop Loss 🚫🚏. Don't Enter the market at the news update.
Loot and escape on the target 🎯 Swing Traders Plz Book the partial sum of money and wait for next breakout of dynamic level / Order block, Once it is cleared we can continue our heist plan to next new target.
💖Support our Robbery plan we can easily make money & take money 💰💵 Follow, Like & Share with your friends and Lovers. Make our Robbery Team Very Strong Join Ur hands with US. Loot Everything in this market everyday make money easily with Thief Trading Style.
Stay tuned with me and see you again with another Heist Plan..... 🫂

Analysis of the U.S. Dollar Index (DXY)Technical Analysis
Monthly Chart:
Since January 2023, the DXY has been moving within a range. The upper boundary of this range was marked by the 107.348 level, which has now been cleared. This breach of the previous high suggests that liquidity above the range has been taken, signaling the potential for a downside move. Historically, such liquidity grabs often precede significant reversals, aligning with the current bearish setup.
Daily Chart:
On the daily timeframe, the DXY displayed a sharp decline after taking out its last significant high. This aggressive sell-off has formed a strong bearish pattern, indicating a potential continuation to the downside. The presence of strong bearish momentum highlights sellers' dominance in the current market conditions, reinforcing the bearish outlook initiated by the liquidity grab on the monthly chart.
Price Targets:
Short-Term Target: A move toward 104.636 is expected as the DXY continues its bearish momentum, which aligns with immediate support and prior structural lows.
Medium-to-Long-Term Target: If the bearish trajectory persists, the DXY could reach the 101.917 level, which aligns with a significant support zone from previous price action. This target reflects the potential for extended downside in a broader bearish scenario.
Fundamental Analysis
Federal Reserve and Interest Rates:
Recent minutes from the Federal Reserve highlight concerns about continuing rate cuts due to the potential risks they pose to inflation. The Fed has signaled that further rate reductions would only be considered if both the labor market weakens and inflation continues to decline. However, these two factors are closely intertwined.
Labor Market Conditions:
Historically, the months of November and December exhibit strong employment trends due to holiday hiring. This seasonality reduces the likelihood of immediate rate cuts, as a robust labor market typically does not align with the conditions necessary for easing monetary policy.
Inflation Outlook:
For the Fed to proceed with aggressive rate cuts, inflation figures would need to remain stable or show further declines. If unemployment rises and inflation remains under control, the Fed may have room for another round of cuts. Such a scenario would support a long-term bearish outlook for the DXY, as lower interest rates reduce demand for the U.S. dollar.
Summary and Outlook
Technically, the DXY is positioned for further downside following the liquidity grab above the 107.348 level and the subsequent bearish pattern on the daily chart. Fundamentally, while seasonal strength in the labor market may delay immediate bearish moves, the broader macroeconomic context suggests that eventual rate cuts are likely.
Key factors to monitor include:
Unemployment data in the coming months.
Inflation trends to confirm stability or further declines.
Any changes in the Fed’s tone regarding rate policy.
Price Expectations:
In the short term, we could see the DXY reach 104.636, reflecting a retracement toward a key support zone.
In the medium to long term, the DXY is likely to target 101.917, aligning with major support from prior price structures and further confirming the bearish outlook.
If unemployment begins to rise and inflation remains under control, these targets become even more probable, reinforcing the alignment between technical and fundamental factors.

DXY IndexPair : DXY Index
Description :
Completed " 12345 " Impulsive Waves and " A " Corrective Waves
Break of Structure
RSI - Divergence
Bearish Channel as an Corrective Pattern in Short Time Frame
Fibonacci Level - 38.20%

DXY INDEXPair : DXY INDEX
Description :
Completed " 12345 " Impulsive Waves
Break of Structure
CHoCH
RSI - Divergence
Consolidation Phase

DXY USD 1WDXY ~ NSE:DOLLAR ~ 1W
#DXY Movement is always in the opposite direction of #Bitcoin.
Looking at this Chart, #DXY Loss of Momentum and breakdown of this support line.
Send Bitcoin price $100,000+ in 2025 Q1

DXY Shorts from the daily supply at 104.200 back down.The dollar has broken significant structure to the downside, leaving a clean, unmitigated daily supply zone with an imbalance that adds validity to this point of interest. Once price reaches this level, I'll likely refine the zone and wait for a CHOCH on the lower timeframe.
If price moves down first, I’ll watch for it to enter the newly created 3-hour demand zone, which swept previous higher-timeframe structure. This could propel the dollar up to the supply zone.
Confluences for DXY Shorts:
Strong bearish momentum on the higher timeframe, breaking previous structure.
Significant liquidity to the downside.
A solid daily supply zone caused this move, with an imbalance below.
This pro-trend trade aligns with my other pairs.
P.S. I expect Monday to start slow, with consolidation before either zone is mitigated. We'll make our move from there.

US Dollar Index Short Term Sell IdeaH4 - Bearish trend pattern
Strong bearish momentum
Until the strong resistance zone holds I expect the price to move lower further after pullbacks.

DXY IndexPair : DXY Index
Description :
Bullish Channel as an Corrective Pattern in Short Time Frame
RSI - Divergence
Break of Structure
Completed " 1234 " Impulsive Waves
CHoCH

lsearch for sales in usdcadIf the price closes with a candle below the white line, I will wait for the pullback to look for sales with the orange line as the objective.

DXY IndexPair : DXY Index
Description :
Completed " 12345 " Impulsive Waves and " ABC " Corrective Waves
Break of Structure
RSI - Divergence
Demand Zone
Bullish Channel as an Corrective Pattern in Short Time Frame

DXY IndexPair : DXY Index
Description :
Bullish Channel as an Corrective Pattern in Long Time Frame and Rejection from Upper Trend Line
RSI - Divergence
Break of Structure
Completed " 12345 " Impulsive Waves and " ABC " Corrective Waves

DXY observations (short term bearish trend)DOLLAR OBSERVATIONS
As price continues its downward trajectory, it has shifted its trend to the downside, leaving behind clear supply zones. One of these zones was previously identified and respected as per last week's forecast. I anticipate this short-term bearish trend to persist until it reaches the 104.200 mark. At that point, I expect a bullish reversal to occur, especially considering the presence of an imbalance just above this level.
Additionally, with price currently in a downtrend, my bullish biases on GU and EU align accordingly. This correlation is logical until either of them reaches the supply zone on the daily chart, which should coincide with the same daily demand zone marked out on DXY.

good entry model in to be long in gbpaudWe have a change of character in 4 hours so we are going to look for purchases in (backwards) to the sales area so we have a lineup in 15 minutes to go shopping. I'm just waiting for the liquidity from Asia to be able to react in an order block of 30 minutes with confirmation. We enter.

DXY Index New Week MovePair : DXY INDEX
Description :
Bullish Channel as an Corrective Pattern in Short Time Frame
Completed " 12345 " Impulsive Waves
Break of Structure
RSI - Divergence
Fibonacci Level - 78.60%
