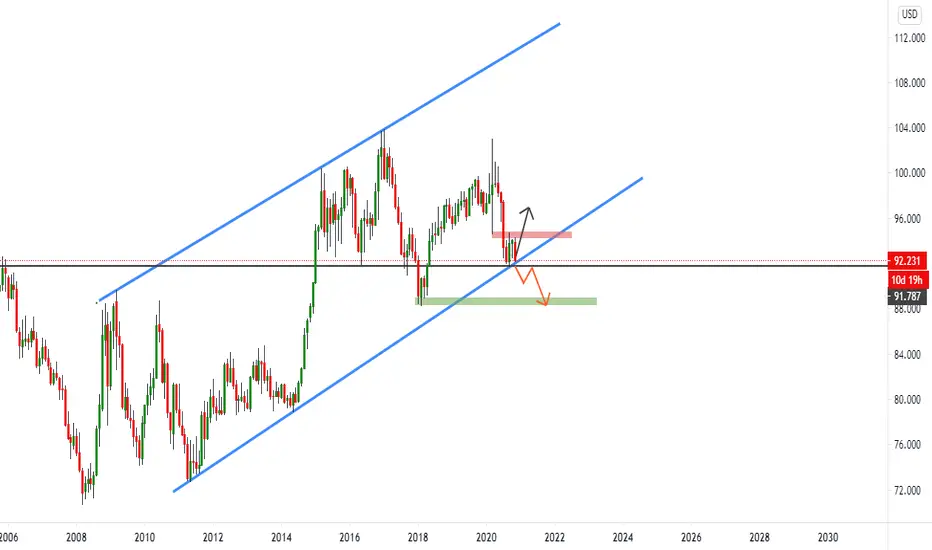
DXY Daily charts.DXY has hit the bottom of the channel, apparently in my opinion, the market will respect the channel support, and we can look forward, retaining its upward trend. However, it is a risk I am happy to take, for a BUY trade.
Dxysetup

DXY: UPDATE FOR THIS MONTHDollar index performance for this month.
expect for bearish target Imabalance daily


DXYas I said on March 21 ... DXY is in a strong downward trend and if for 1 week it rejected 3 weeks in a row from the Fibonacci 0.5 area, I expect it to continue the descent to Fibonacci 382!
...exactly as I said in the last 3 months DXY rejected from the 786 Fibonacci level and went down thus closing the Fibonacci chart that I drew 3 months ago!
From this area, I expect DXY to reject and start rebuilding the W I've been talking about lately ....
THIS WEEK...as I was saying last week ... DXY has stopped falling and is starting to form support in this area and form W!
If the next weekly candle will still be green then I will look for BUY around 92,600 or even higher ...
NOTE: Please, give a LIKE if you find this idea useful!
GREAT ATTENTION:
*This information is not a Financial Advice.

DXY Full Analysis And How To Trade USD Pairs In The Next DaysThis is an educational + analytic content that will teach why and how to enter a trade
Make sure you watch the price action closely in each analysis as this is a very important part of our method
Disclaimer : this analysis can change at anytime without notice and it is only for the purpose of assisting traders to make independent investments decisions

DXYas I said on March 21 ... DXY is in a strong downward trend and if for 1 week it rejected 3 weeks in a row from the Fibonacci 0.5 area, I expect it to continue the descent to Fibonacci 382!
...even if it climbed to the Fibonacci 786, DXY continues its downward trend we were talking about and will reach the Fibonacci zone 0.382 where it is a very strong area ... and even if it rejects and rises again to the 91,950 area ... the trend is in continue to descend!
...as I said last week DXY rejected from Fiboinacci 382 and closed under Fibonacci 0.236 from where ... even if it will go down a little to the area 89.800-89.300 I think it will start an ascent and will form a W
THIS WEEK...exactly as I said in the last 3 months DXY rejected from the 786 Fibonacci level and went down thus closing the Fibonacci chart that I drew 3 months ago!
From this area, I expect DXY to reject and start rebuilding the W I've been talking about lately ....
NOTE: Please, give a LIKE if you find this idea useful!
GREAT ATTENTION:
*This information is not a Financial Advice.


DXY: UPDATE AFTER NFPDXY create new trend line and will touch the support and start grow up soon.
If you have any idea, leave comment below and give like.
Thank you

DXY New Analysis And What Will Happen With Non Farm Payroll NewsThis is an educational + analytic content that will teach why and how to enter a trade
Make sure you watch the price action closely in each analysis as this is a very important part of our method
Disclaimer : this analysis can change at anytime without notice and it is only for the purpose of assisting traders to make independent investments decisions


DXY New Analysis This is an educational + analytic content that will teach why and how to enter a trade
Make sure you watch the price action closely in each analysis as this is a very important part of our method
Disclaimer : this analysis can change at anytime without notice and it is only for the purpose of assisting traders to make independent investments decisions


US DOLLAR INDEX OUTLOOK FOR 2021dxy still can drop another leg in short term trades , but i don't think it will continue to much lower levels in 2021.
when the equity markets goes for correction (up %40 can be expected) , DXY can spike up over 100 again.


Dxy Waiting for either a breakout or a rejection.
The dollar may get stronger coz Pfizer vaccine news can work as a catalyst.
Has Us dollar(dxy) strength Resumed?We are currently analyzing a possible inverted head and shoulder which shows a reversal chart pattern that the previous downtrend might has ended and the the former uptrend may resume.
We expect a retracement to the neckline and a candlestick confirmation to trigger the buy order. Target is as shown on the chart and the ideal stop loss should be set below the right shoulder.
