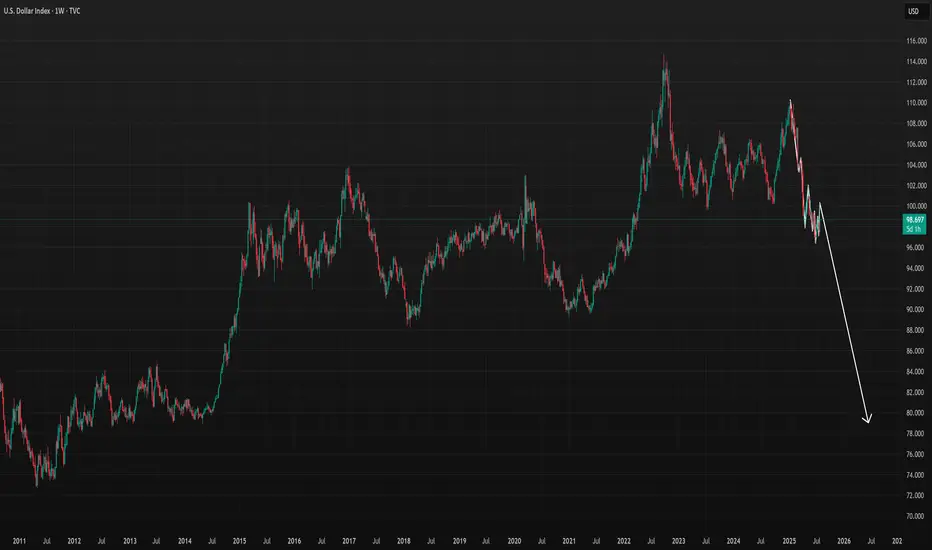
DXY to go extremely low due to Tariffs and Market ManipulationDXY to go extremely low due to Tariffs and Market Manipulation Reports
- The US Debt is almost over $38 Trillion in under 3 months
- Continue to monitor for weekly bearish signals on the chart
TVC:DXY
OANDA:USDCAD
OANDA:NZDUSD
Dxyshort
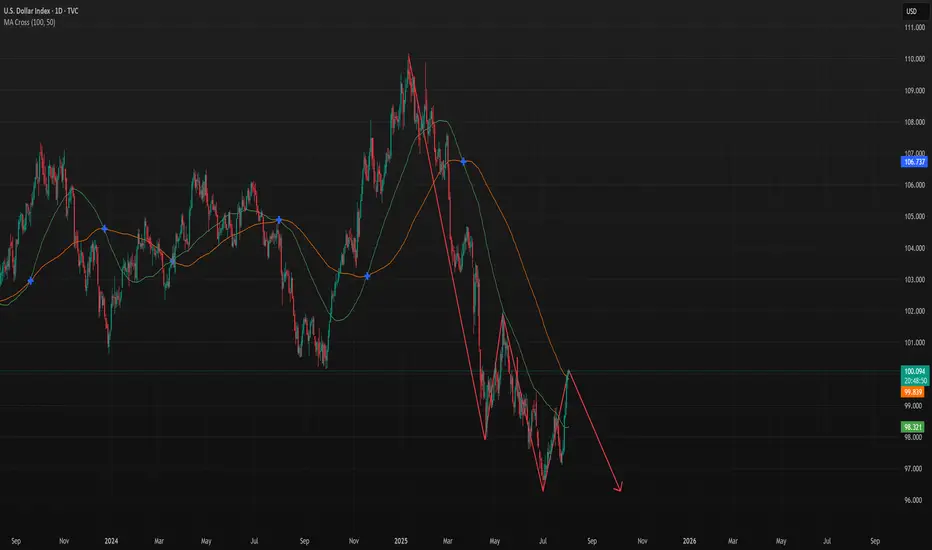
DXY - Possible Down Swing to continue furtherTVC:DXY
CMCMARKETS:USDCAD
OANDA:NZDUSD
CMCMARKETS:EURUSD
We may have a further down swing pattern forming let's continue to see if it passes the resistance area.
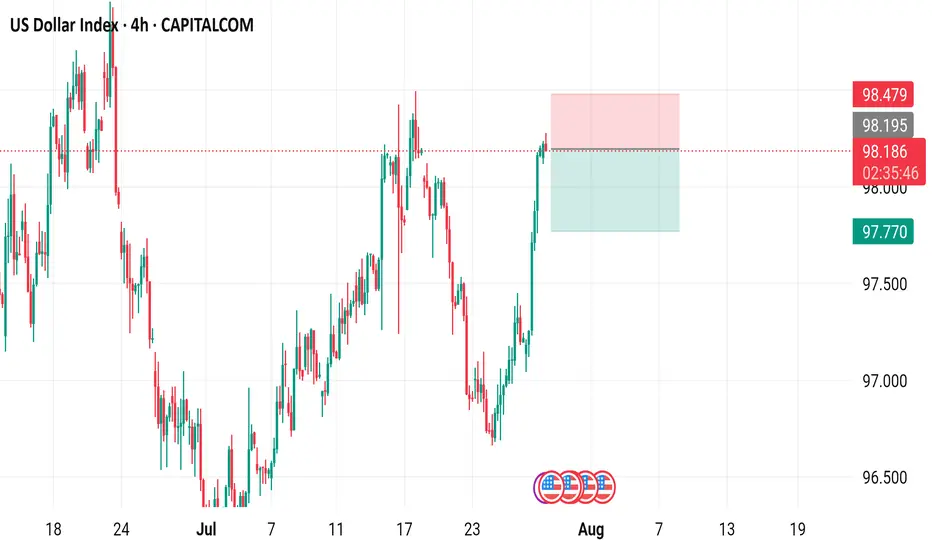
US Dollar Index (DXY) - 4 Hour Chart4-hour chart from CAPITALCOM displays the recent performance of the US Dollar Index (DXY), showing a current value of 98.190 with a slight decline of 0.009 (-0.01%). The chart highlights key price levels, including a recent sell signal at 98.189 and a buy signal at 98.243, with a resistance zone marked between 98.195 and 98.479. The index has experienced fluctuations, with notable drops and recoveries, and is currently trending near the 98.190 level as of July 29, 2025.
Analysis on the DXY – EURUSD RelationshipHello traders,
Here’s an analysis that can be useful for both short-term and swing trades on EURUSD and DXY. Our trading team’s calculations are as follows:
Analysis on the DXY – EURUSD Relationship
Currently, DXY is at 98.200. Historical statistical data indicate that if DXY declines toward 96.300, there is approximately a **1.55% probability of an upward move** in EURUSD.
Based on this scenario:
Current EURUSD level: 1.16500
Projected target level:1.1830
While the correlation data show a strong inverse relationship, it’s important to note that periodic deviations can occur in the market. Therefore, this analysis should be considered a statistical projection only, not a guaranteed outcome.

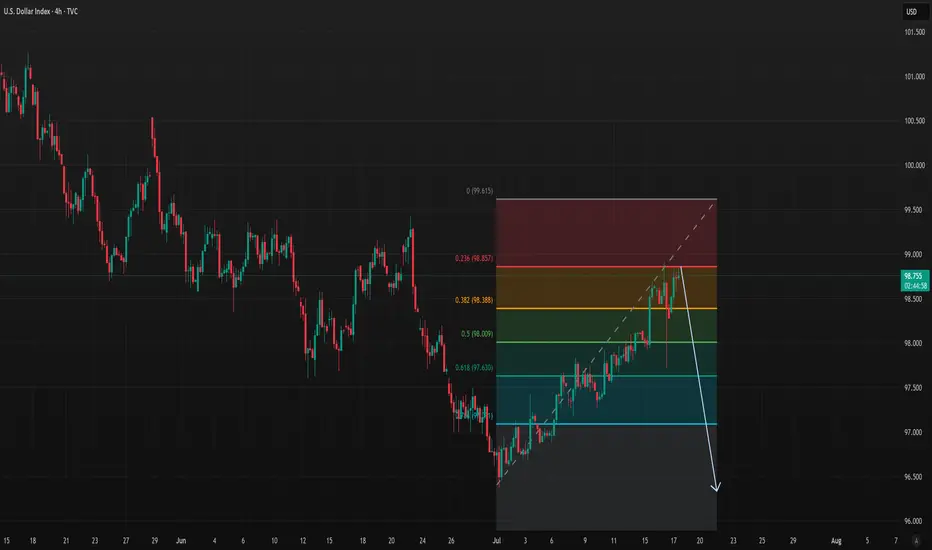
US Dollar Index - 4h Chart (CAPITALCOM)4-hour chart of the US Dollar Index (DXY) from CAPITALCOM shows the index's recent price movements. The current value is 96.955, with a slight increase of 0.054 (+0.06%). Key levels include a support at 96.413 and resistance at 97.554. The chart highlights buy signals at 97.012 and sell signals at 96.958 and 96.955, with a notable downward trend breaking below a support zone around 97.150.

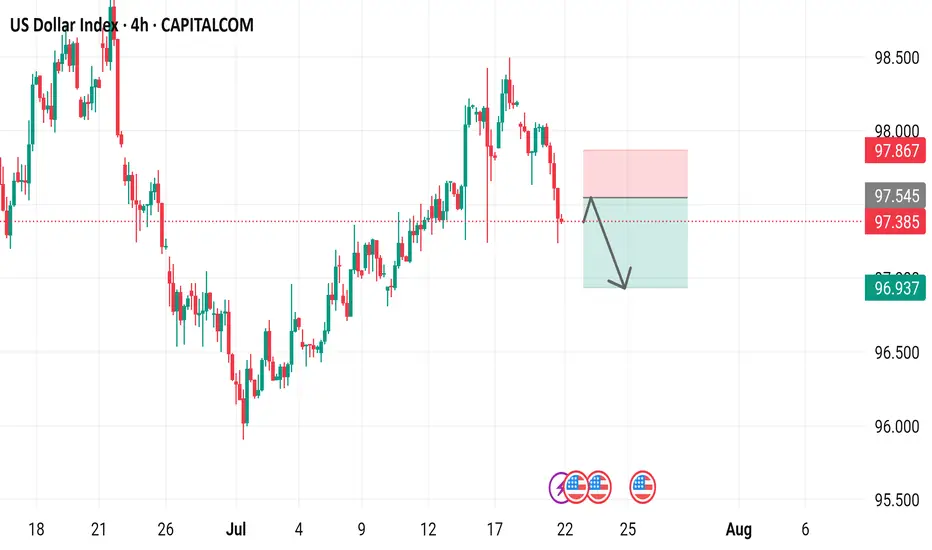
US Dollar Index 4-hour time frame, showcasing the US Dollar Index's performance over this period.
- The index is currently at 97.385, with a decrease of 0.636 (-0.65%) from its previous value.
- A red box indicates a "SELL" signal at 97.385, while a blue box suggests a "BUY" signal at 97.439.
- The chart includes various technical indicators, such as moving averages and relative strength index (RSI), to help traders analyze market trends.
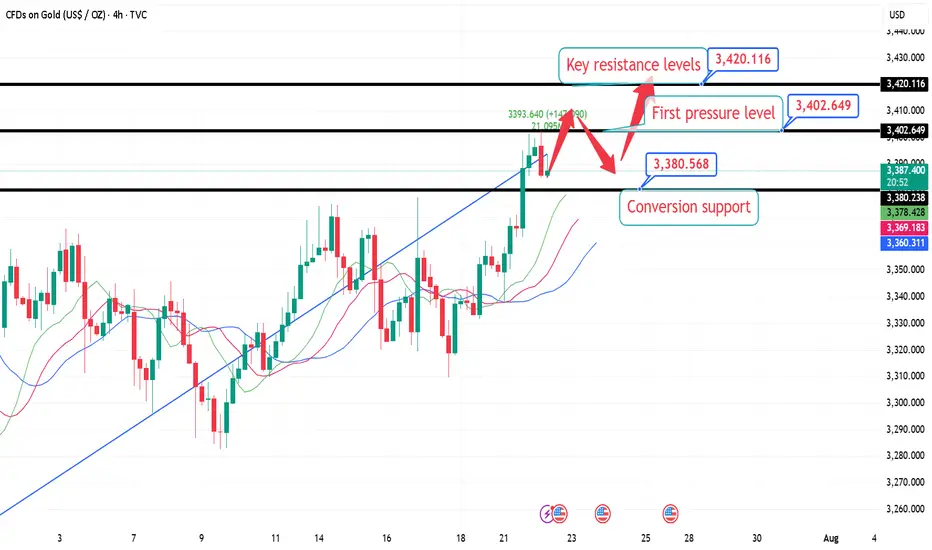
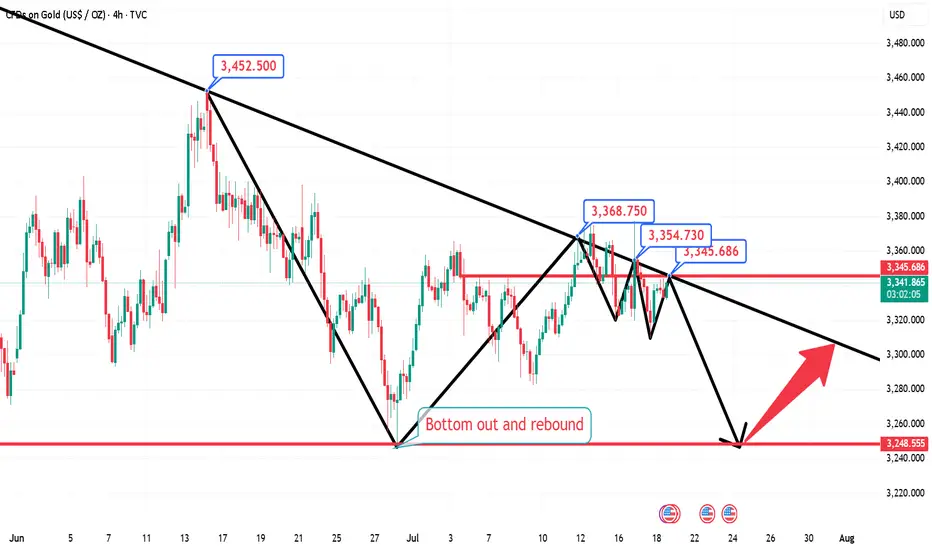
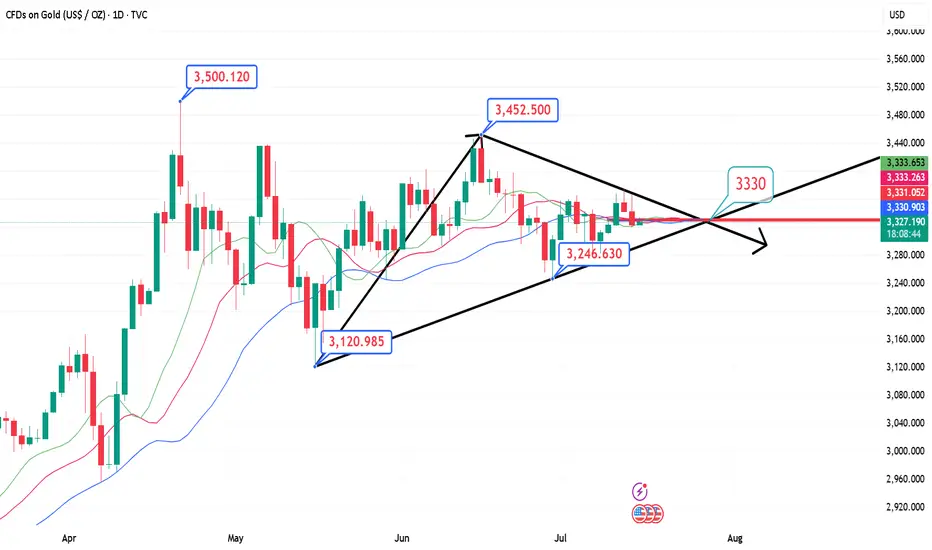
7.22 London Gold Market Analysis and Operation SuggestionsFrom the market perspective, the trend suppression line from the historical high of 3500 to the secondary high of 3452 has moved over time and is now around 3420, which can be used as an important resistance level reference for this week; the previous resistance level of 3376 can be converted into support after breaking through. For intraday short-term operations, focus on this range of callbacks and go long, wait for the key resistance level to be touched before going short, or see if there is an opportunity to arrange a mid-term short order based on the real-time trend.
Specific intraday operation ideas:
①. When the gold price falls back to around 3380, participate in long orders and call, protect the position of 3374, and first look at the position of 3402, the high point on Monday;
②. After yesterday's high point breaks, wait for a correction to around 3395 to continue to participate in long orders and call, protect the position of 3388, and look at the key suppression level of 3420;
③. (Aggressive orders, for those who are afraid of missing out) If you are short or have enough positions, you can first participate in long orders with a light position at the current price of 3388, and wait for 3380 to increase your position, and the target is the same as above.
Analysis of short-term gold trading on July 22Technical aspects:
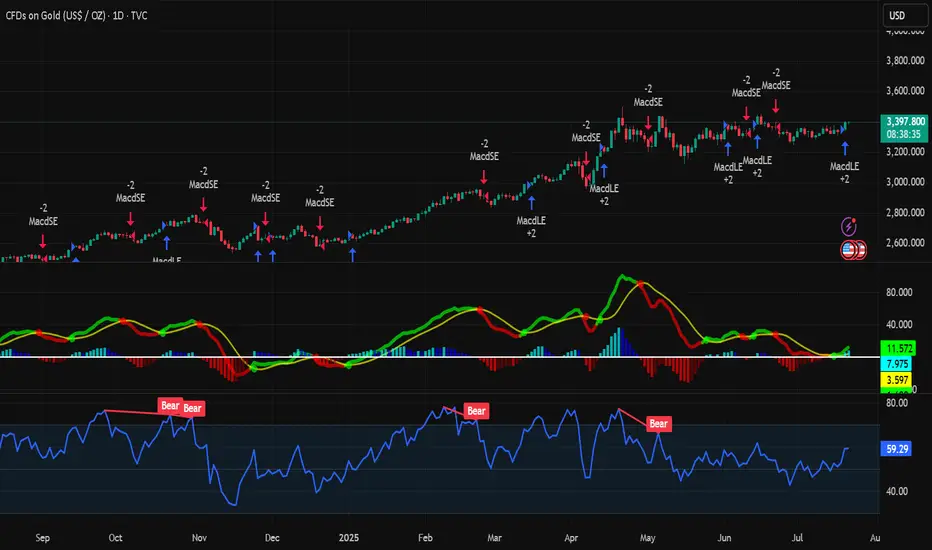
From the daily candlestick chart, gold has recently shown signs of breaking upward after five weeks of sideways fluctuations. In terms of MACD indicators, the MACD bar chart has turned from green to red, and the fast and slow lines have formed a "golden cross", strengthening the expectation of a short-term technical rebound.
At the same time, the 14-day RSI index rebounded to 57.67, still in the neutral and strong area, and has not yet entered the overbought area, indicating that the price still has room to rise. Analysis shows that the middle track of the Bollinger Band 3342 constitutes initial support, while the strong support below is at the two previous lows of 3247.87 and 3120.64.
If the bulls maintain their advantage above the integer position of 3400, they are expected to hit the high point of 3451.14 in the short term, and even further test the historical high of 3499.83; on the contrary, if they fall back below 3342, the short-term upward momentum will be tested.
Bull analysis:
If gold successfully stands above 3400, the market will turn its attention to the two key resistance areas of 3451 and 3499, the high point of the year. Breaking through the former will open up the space to test the historical high upward; combined with the current MACD golden cross pattern, if the capital side and the fundamentals continue to cooperate, it is not ruled out that there will be a short-term accelerated rise.
Bear analysis:
If the breakthrough fails, especially if gold falls back below the middle track of Bollinger, the adjustment pressure will be restarted, and the lower edge of the previous consolidation range of 3300 will constitute an important support. If it falls below again, it is necessary to pay attention to the important technical support near 3247 and the 100-day moving average of 3180.
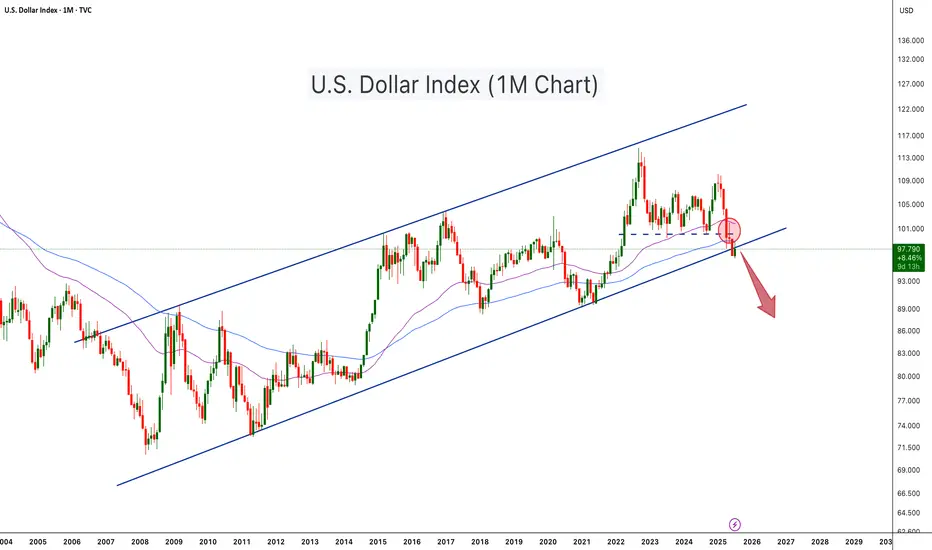
U.S. Dollar Index Loses Key Support – Crypto Bull Run Loading?The U.S. Dollar Index (DXY) has just broken below a long-term ascending channel, which has held since 2008. After losing the key horizontal support (~100 level), DXY retested and rejected from it (red circle), confirming a potential trend reversal. The move is technically significant and hints at further downside, possibly toward the 88–90 zone or lower.
This breakdown aligns with classic macro cycles, where a weaker dollar often fuels bullish momentum in risk assets, especially crypto. Historically:
-DXY downtrends in 2017 and 2020–2021 coincided with major Bitcoin and altcoin bull runs.
-DXY strength during 2018 and 2022 contributed to crypto bear markets.
With DXY now below both horizontal and diagonal support, Bitcoin and the broader crypto market may be entering the next expansion phase, especially if the dollar continues its downward trajectory
-DXY has broken below a 17 year rising channel – a macro bearish signal.
-Rejection from former support turned resistance confirms breakdown.
-A falling DXY historically corresponds with Bitcoin rallies and altseason expansions.
-Declining dollar strength could be the fuel that propels Bitcoin past $140K and Ethereum above $6K.
-A dollar bear trend may fuel total crypto market cap breakout beyond $4T+.
As DXY weakens, liquidity tends to rotate into risk-on assets like crypto. This setup mirrors pre-bull run environments seen in 2017 and 2020. A structural breakdown in the dollar could act as a catalyst for Bitcoin’s next major leg up.
Cheers
Hexa
7.22 Gold falls back and continues to be bullish, 3400 is not thFrom the 4-hour analysis, the short-term support below is 3370, the important support is 3350-55, and the upper resistance is 3400-05. The overall support during the day is to maintain the main tone of high-altitude and low-multiple cycles in this range. For the middle position, watch more and do less, be cautious in chasing orders, and wait patiently for key points to enter the market.

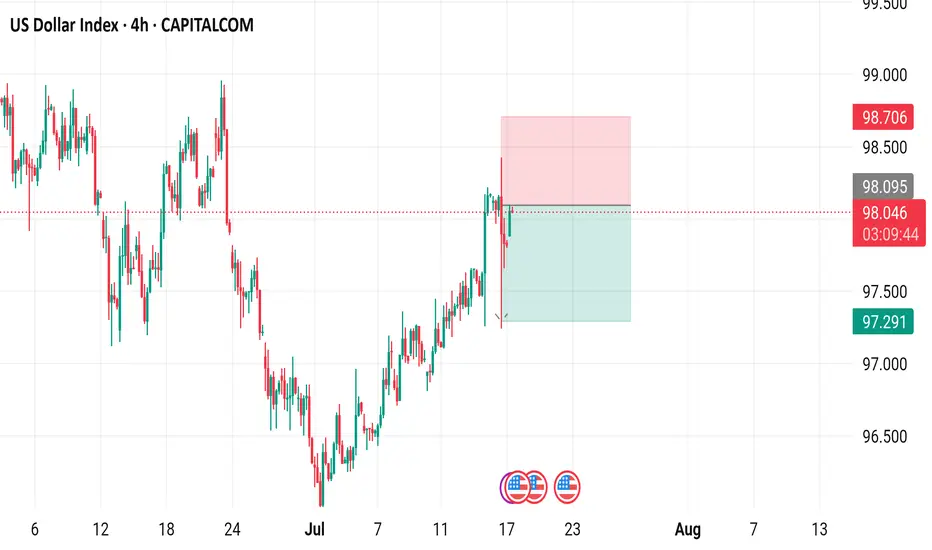
US Dollar Index (DXY) - 4 Hour Chart4-hour performance of the US Dollar Index (DXY) from CAPITALCOM, showing a current value of 98.040 with a 0.23% increase (+0.222). The chart includes recent buy and sell signals at 98.094 and 98.040, respectively, with a highlighted resistance zone around 98.706-99.000 and a support zone around 97.291-98.040. The timeframe covers data from early July to mid-August 2025.
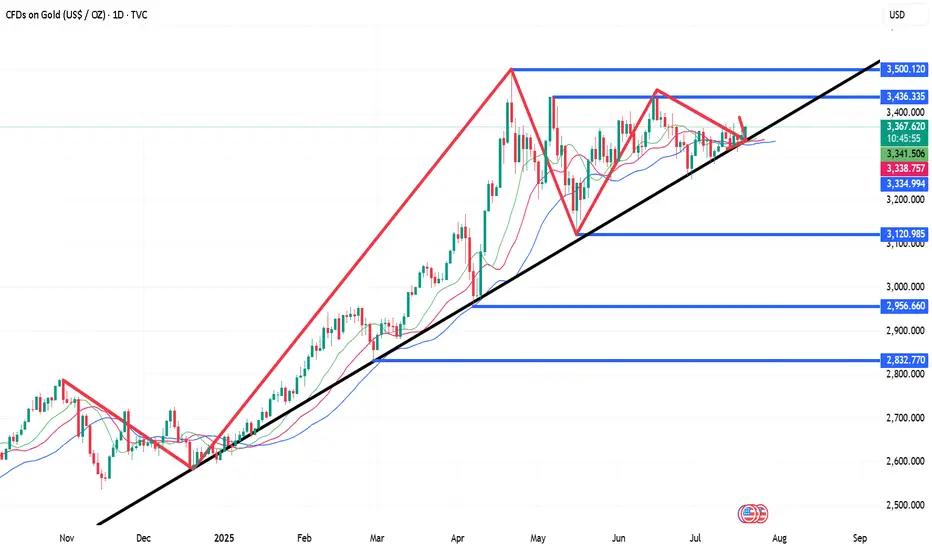
Analysis of short-term operations of gold on July 21Daily Analysis:
On the daily chart, it can be seen that gold has rebounded from the main rising trendline again, and bargain hunters have set clear risks below the trendline, betting on a price rebound to the 3438 resistance level. Bears need the price to break below the trendline to open up space for a deeper correction, with the next target looking at the 3120 level.
4-hour analysis
On the 4-hour chart, it can be seen that there is a secondary resistance area near 3377. If the price rebounds to this level, it is expected that bears will intervene here and set risks above the resistance, with the goal of pushing the price below the main trendline. Bulls will look for the price to break through this resistance to increase their bullish bets on the 3438 level.
Buy first when gold falls back, and pay attention to the strengtGold went on a roller coaster ride last week. It rose to around 3377 at the beginning of the week and then fell back under pressure. After stabilizing near 3309 on Thursday, it strengthened again on Friday and came under pressure near 3361. It fell back slightly to around 3344 at the opening in the morning and is currently rising again. In the morning, pay attention to the opportunity to buy first after the pullback, pay attention to the strength of the European session, and pay attention to the pressure near 3378/80 on the upside.

7.18 Gold intraday operation strategy, short-term short first stFrom the 4-hour analysis, the short-term support below continues to focus on around 3316-25, the short-term suppression above focuses on the 3340-45 line, and the key pressure above focuses on the 3380 line. The overall support of 3316-3345 range still maintains the main tone of high-altitude and low-multiple cycles. In the middle position, watch more and do less, be cautious in chasing orders, and wait patiently for key points to enter the market.
DXY Short Very Soon going to $96 or lowerCorruption has broken out all over America. Nothing good can come of this.
Wait for a solid Red weekly bar on DXY and short until 96 or lower.
- Earthquakes
- Wildfires over 600
- Floods
- Riots
- Epstein Files
- Housing (Only for the rich)
- Rental Increases
- Home Insurance Price increases
- Fraud for the Elite (Multiple Coins Created with withdrawals outside of US involving other Presidents)
- Crypto Investigations on Politicians
- Children Migrants being deported (Age 6 with Cancer)
TVC:DXY
FX_IDC:CADUSD
ECONOMICS:USTR
FRED:TREASURY
Analysis of 7.17 Gold Operation: Buy High and Sell LowYesterday, the trend of gold in the first half was quite regular. The rebound in the Japanese session was under pressure, and the European session continued to fall back to test the 3320 mark. The key here has been repeatedly emphasized yesterday. The gold market in the second half was more exciting. First, the news was released that Trump was ready to draft the dismissal of the Federal Reserve Chairman. Gold directly rose by 50 US dollars and broke through the recent high of 3375. Then he said that he had no intention of dismissing the Federal Reserve Chairman. Gold rushed up and fell back by 40 US dollars. The daily line finally closed with an inverted hammer pattern with a very long upper shadow line.
After the end of this pattern, today's market is still bearish. If the market is extremely weak, it will continue to fall below 3358. Pay attention to the attack and defense of the 3320 mark below. If it falls below, it will open the downward space to test the 3300 mark. During the day, we will temporarily set the small range of 3320-3358 to run, sell high and buy low, and retreat to 3325. One low long, defend yesterday's low, look up to 3335, 3342, 3358, and then reverse high.

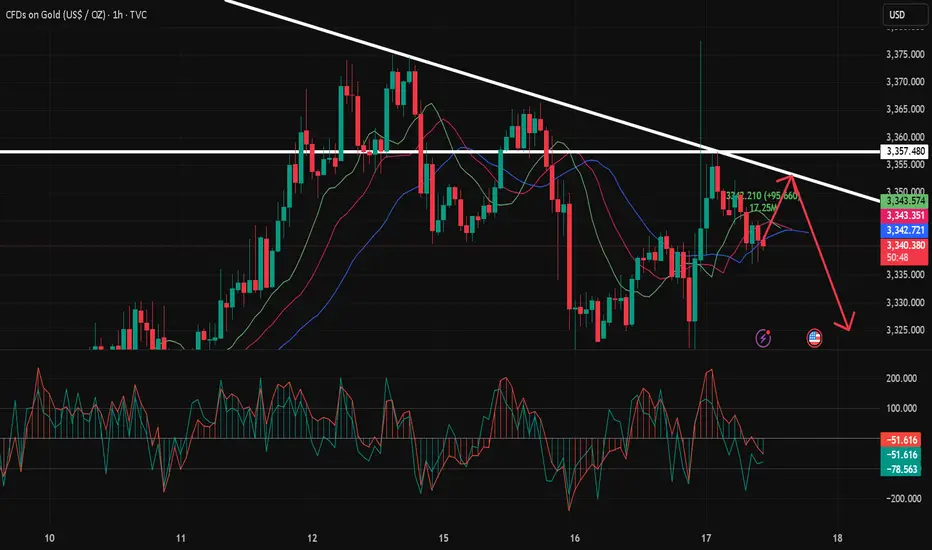
7.17 Gold Short-Term Operation Technical Analysis!!!After a strong rise in the 1-hour gold price, it quickly fell back and closed with a long upper shadow line. The gold bulls did not successfully stabilize the market. This market is actually a venting of the news. The gold bulls are not very confident about rising again. The 1-hour gold moving average is still in a dead cross short pattern. So the gold rebound will continue to be short. The 1-hour gold pattern excludes the influence of the upper shadow line stimulated by yesterday's news. In fact, the whole rhythm is still fluctuating and falling. The upper shadow line is not long, and it is probably just a lure to buy more. After the ups and downs of gold last night, it rebounded again to the 3357 line or continued to fall under pressure. So gold will continue to rebound in the early trading and continue to be short at highs under the pressure of 3357.
Gold is accelerating downward, pay attention to important supporThe U.S. inflation data for June was released overnight. The actual data showed that U.S. inflation rebounded slightly in June, but it did not exceed expectations. After the data was released, Trump made a speech at Truth A post on Social said that given the low consumer prices, the Fed should lower interest rates. He has been calling for a rate cut for some time, so the market still has some uncertainty about the timing of the Fed's subsequent rate cuts, but the probability is in September. The probability of keeping interest rates unchanged this month is high. The US dollar index is also supported and continues to rebound. Gold fluctuated higher from around 3344 in the morning of the previous trading day. During the European session, it refreshed the intraday high and touched the 3366 line under pressure and maintained repeated narrow consolidation. After the data was released, it first rebounded quickly to the 3360 line and then quickly fell back. After two repetitions, it finally moved downward. In the evening, it fell below the intraday low and once touched around 3320 and then stabilized and rebounded. The daily line closed with a middle shadow. Technically, the continuation of the previous convergence triangle after the break is currently returning to the downward channel again.
Pay attention to the pressure of 3342/44 during the day, and pay attention to the support near 3308 below. If it falls below 3308 again, it will return to the downward channel.
7.11 Gold bulls rise again, beware of the black swan coming on FYesterday, Thursday, the US dollar index rose first and then fell. It once approached the 98 mark before the US market, but then gave up most of the gains.
Yesterday, spot gold fluctuated around the 3320-30 US dollar mark. After the US market, it once touched 3310, but finally rebounded to above 3320 for consolidation.
Today, Friday, gold broke through the high point of 3330 yesterday in one fell swoop in the early trading.
So this is relatively good news for bulls.
If the high point of yesterday breaks through and stabilizes, it means that the bullish upward trend may continue today.
From the current 4-hour chart:
It can be found that the current 4-hour chart of gold has stabilized in the breakthrough range.
So if gold continues to go up, simply look at the previous high point.
The two recent high points are around 3345 and 3360.

Gold 4-hour resistance point fluctuates, shorts comeOn Thursday (July 10), the 4-hour resistance point of gold price was formed before the US market. The logic of shorting at the resistance point can be considered. Spot gold maintained a strong trend in the European session, trading around $3,330. Although US President Trump's remarks on imposing a new round of tariffs on many countries triggered safe-haven demand, the FOMC meeting minutes showed differences in the path of interest rate cuts within the year, making gold bulls still cautious.
Spot gold continued to retreat after the previous high of $3,499.83, and has been blocked below $3,451.14 recently, forming a relatively obvious box consolidation structure. The current price is running below the middle track of the Bollinger Band at $3,343.69, indicating that the upward momentum of the bulls is weak. Analysts believe that the short-term key support level is at $3,250, which forms a resonance support with the previous low of $3,247.87. If it falls below, it may increase the downside risk.

Gbpusd long scalp I like current consolidations near equal high depicted with green line.
I want to see a draw towards the equal highs.
This would be simulation trade #7 out of 100

Gold's short-term decline is limited and will continue to riseWith the rise of gold in the US market yesterday, the trend line of the downward trend channel has been supported many times in the short cycle. After the rebound, we still need to pay attention to the suppression of 3328-30. This position is the suppression position of the 4-hour downward trend channel. If it breaks, the overall trend will be a rising flag, which may continue the upward trend. Of course, if it continues to not break through the suppression of 3328-30, it may fluctuate within the range. This requires further observation.
Intraday short-term suggestions: short-term long mainly, pay attention to the support of short-term long near 3307, stop loss 3297, take profit at 3328-30 suppression, break at 3348-50, pay attention to risks.

Technical analysis guide for gold in the US market!Technical aspects:
The gold daily chart shows an obvious shock consolidation structure, and is currently running between the middle and lower tracks of the Bollinger Bands, with an overall weak trend. Since hitting a high of $3499.83, the market has fallen into a sideways consolidation range, with top resistance concentrated in the $3400-3450 range and bottom support at $3250. The recent price retracement to around 3250 failed to effectively break below, forming an important support level.
The MACD indicator crossover continues, the green column is enlarged, the double lines are downward, and the momentum is weak. The RSI indicator runs around 44, and does not show oversold or rebound signals. The price is still in a weak consolidation stage. Analysts believe that if it falls below the 3250 line, it may open up further correction space, and pay attention to the 3170 area support; on the upside, if it can effectively stand above 3400, it is expected to retest the 3450 line high.
