"DXY Dollar Index" Market Bullish Heist Plan (Day/Swing Trade)🌟Hi! Hola! Ola! Bonjour! Hallo! Marhaba!🌟
Dear Money Makers & Robbers, 🤑 💰💸✈️
Based on 🔥Thief Trading style technical and fundamental analysis🔥, here is our master plan to heist the "DXY Dollar Index" Bank Heist. Please adhere to the strategy I've outlined in the chart, which emphasizes long entry. Our aim is to escape near the high-risk ATR Line Zone. It's a Risky level, overbought market, consolidation, trend reversal, trap at the level where traders and bearish robbers are stronger. 🏆💸"Take profit and treat yourself, traders. You deserve it!💪🏆🎉
Entry 📈 : "The heist is on! Wait for the Crossing previous high (100.400) then make your move - Bullish profits await!"
however I advise to Place Buy stop orders above the Moving average (or) Place buy limit orders within a 15 or 30 minute timeframe most recent or swing, low or high level for Pullback entries.
📌I strongly advise you to set an "alert (Alarm)" on your chart so you can see when the breakout entry occurs.
Stop Loss 🛑: "🔊 Yo, listen up! 🗣️ If you're lookin' to get in on a buy stop order, don't even think about settin' that stop loss till after the breakout 🚀. You feel me? Now, if you're smart, you'll place that stop loss where I told you to 📍, but if you're a rebel, you can put it wherever you like 🤪 - just don't say I didn't warn you ⚠️. You're playin' with fire 🔥, and it's your risk, not mine 👊."
📍 Thief SL placed at the nearest/swing low level Using the 2H timeframe (99.000) Day/swing trade basis.
📍 SL is based on your risk of the trade, lot size and how many multiple orders you have to take.
🏴☠️Target 🎯: 102.300
🧲Scalpers, take note 👀 : only scalp on the Long side. If you have a lot of money, you can go straight away; if not, you can join swing traders and carry out the robbery plan. Use trailing SL to safeguard your money 💰.
💰💵💸"DXY Dollar Index" Bank Money Heist Plan is currently experiencing a bullishness,., driven by several key factors. .☝☝☝
📰🗞️Get & Read the Fundamental, Macro Economics, COT Report, Geopolitical and News Analysis, Sentimental Outlook, Intermarket Analysis, Index-Specific Analysis, Future trend targets with Overall outlook score... go ahead to check 👉👉👉🔗🔗🌎🌏🗺
⚠️Trading Alert : News Releases and Position Management 📰🗞️🚫🚏
As a reminder, news releases can have a significant impact on market prices and volatility. To minimize potential losses and protect your running positions,
we recommend the following:
Avoid taking new trades during news releases
Use trailing stop-loss orders to protect your running positions and lock in profits
💖Supporting our robbery plan 💥Hit the Boost Button💥 will enable us to effortlessly make and steal money 💰💵. Boost the strength of our robbery team. Every day in this market make money with ease by using the Thief Trading Style.🏆💪🤝❤️🎉🚀
I'll see you soon with another heist plan, so stay tuned 🤑🐱👤🤗🤩
Dxysignal

DeGRAM | DXY has broken the downward structureThe DXY is under a descending channel above the trend lines.
The price has broken the upper trend line.
The chart maintains a harmonic pattern and has already broken the descending structure.
We expect a rise after consolidation above the resistance level.
-------------------
Share your opinion in the comments and support the idea with like. Thanks for your support!

DeGRAM | DXY dropped below 100 pointsDXY is in a descending channel between trend lines.
On the downside, the price has formed a gap and dropped below 100 pips and has already reached the lower trend line.
The chart maintains a descending structure but has already formed a harmonic pattern and a descending wedge.
On the major timeframes, the index relative strength is in the oversold zone and on the 30m Timeframe it is forming a bullish convergence.
We expect a reversal after a support retest.
-------------------
Share your opinion in the comments and support the idea with like. Thanks for your support!

DeGRAM | DXY broke the triangle downwardDXY is in a descending channel under a triangle.
The price is moving from the upper boundary of the channel, resistance level and upper trendline, which previously acted as a pullback point.
The chart failed to form an ascending structure, but it formed a harmonic pattern and broke down the mirror support level, which now acts as resistance.
On the main timeframes, the relative strength index is below 50 points.
We expect the decline to continue.
-------------------
Share your opinion in the comments and support the idea with like. Thanks for your support!

Gold continues to strengthen and fluctuates widely in the short Gold stabilized near the 200-period moving average at the beginning of this week, and the current upward trend is supported by the daily chart oscillator indicators. Both the daily RSI and MACD remain in the bullish range, with obvious momentum;
The upper target is concentrated in the 3167-3168 US dollar line, which is the historical high set at the beginning of this month; if it successfully breaks through this area, the gold price may enter a new upward channel.
In the short term, the support level below $3100 is concentrated in the 3065-3060 US dollar range, and a break below it will open a downward channel to $3000. The $3000 mark coincides with the 200-period moving average of the 4-hour chart, which is the key long-short dividing point;
If it falls below this point, it means that gold has entered the correction stage, and bulls need to remain vigilant; but the current fundamentals and market sentiment still strongly support the gold price to maintain high volatility.

DeGRAM | DXY seeks to close the gapDXY is in a descending channel between trend lines.
The price is moving from the support level, which has already acted as a reversal point twice.
During the decline, the chart formed a gap and afterwards formed an inverted hammer and a harmonic pattern.
On the 1H Timeframe, the Relative Strength Index is in the oversold zone and indicates bullish convergence.
We expect the index to head towards the gap after breaking the 38.2% retracement level.
-------------------
Share your opinion in the comments and support the idea with like. Thanks for your support!

4.8 Gold continues to run at a low point!Gold stabilized and rebounded on Tuesday (April 8), with an intraday increase of nearly 1%, successfully recovering the losses of the previous trading day. The rebound ended the three-day correction trend, and the gold price rebounded significantly from the key support level of $2,955. The current market focus is on the evolution of the Fed's policy path and the geopolitical trade situation. Under the interweaving of long and short factors, the short-term volatility of gold has risen significantly.
Fundamentals: The struggle between risk aversion and interest rate expectations
The rebound of gold at the beginning of this week was mainly driven by two factors:
1. The escalation of geopolitical trade risks
US President Trump's recent remarks on tariffs have triggered market concerns about the renewed tension in the global trade system.
2. The Fed's interest rate expectations fluctuated sharply
The interest rate futures market has undergone dramatic changes this week: On Monday, the market once bet that the Fed would cut interest rates five times in 2025, a significant shift from the expectation of "one or no interest rate cut" a week ago.
3. The coordination of the US dollar and capital flows
The US dollar index weakened slightly on Tuesday, reducing the cost of holding gold for non-US investors.
Technical aspect: Attack and defense of key support level
From the perspective of the market structure, the trend of gold this week showed typical "sharp drop and slow rise" characteristics:
Support confirmation: On Monday, the gold price accurately tested the support of $2955 and then rebounded. This position corresponds to the neckline of the platform that broke through in mid-March, and formed a double defense line with the 55-day moving average (US$2930). The intraday lows were densely bought, indicating that medium- and long-term investors viewed the correction as an opportunity to build positions.
Resistance distribution: The first resistance above is at US$3040 (daily line R1), and after breaking through, it may test US$3057 (March 20 pivot point) and US$3097 (R2). The historical high of US$3167 is still a psychological barrier, but it is difficult to challenge it directly in the short term.
In the short term, the trend of gold will depend on two major catalysts: 1. The minutes of the Fed's March meeting on Wednesday: If the minutes suggest an open attitude towards rate cuts, it may push gold prices to test the $3,050-3,070 range; conversely, if the emphasis is on inflation stickiness, it may trigger long profit-taking. 2. Progress in trade negotiations: Any substantive implementation or easing of tariff policies may trigger fluctuations of more than 5% in gold prices. In the medium term, the upward trend of gold has not been broken. Institutional research reports show that the current global central bank's demand for gold purchases is still at a historical high, and in the downward cycle of interest rates, the relative attractiveness of interest-free assets will continue to stand out. If the technical side breaks through $3,057, it will open up space for the impact of the previous high; the defense strength of the $2,950-2,930 area needs to be closely monitored below.

4.8 Gold Bollinger Bands bearish signal appearsRecently, the spot gold price once fell below the psychological barrier of $3,000, triggering technical concerns in the market about whether the gold bull market has reached its peak. On Monday (April 7) in the North American session, spot gold is currently trying to recover to around $3,030, but the technical indicators have shown obvious divergence.
Fundamental analysis
The market's concerns about US inflation continue to ferment, and the intensification of global trade frictions is driving the market's concerns about economic stagflation. The Fed's policy stance has also undergone subtle changes. The market has begun to price in five possible interest rate cuts this year. The CME FedWatch tool shows that the probability of the Fed's interest rate cut in May has soared from 33.3% last Friday to 49.3%.
At present, traders are turning their attention to the US inflation data to be released this week, which will provide important clues for assessing the US economic situation.
Technical analysts' interpretation:
Bollinger band breakthrough signal indicates a short-term correction
On the daily chart, gold prices have formed a clear upward channel since mid-March, but recently touched the upper track of the Bollinger band and began to fall. It is worth noting that the middle track of the Bollinger Band 3006.13 has become a key support level. After breaking through the historical high of 3167.60, the price has shown a typical upward exhaustion pattern. The MACD indicator shows DIFF: 43.46, DEA: 48.65, MACD: -10.39, and the green kinetic energy column has begun to expand, indicating that the short-term downward momentum is accumulating.
RSI indicator shows overbought correction
The 120-minute chart shows that the RSI indicator has fallen from the overbought area to a neutral level of 40.37. At the same time, the CCI indicator has dropped to -45.05, further confirming the trend of short-term overbought correction.
Key support and resistance level analysis
The current gold price faces multiple technical resistances, among which 3055.00 and 3085.00 constitute the main resistance range for short-term rebound. The lower support levels are mainly concentrated at $3005.00 and $2971.31, and these two levels will determine whether the gold price can remain above the psychological level of $3,000. In particular, the $2971.31 level, as a recent low, may trigger a deeper adjustment if it is lost.
From the long-term daily chart, gold prices formed an accelerated upward channel after breaking through $2950.00. The recent high of $3167.60 is just at the upper track of the channel. This trend of peaking and falling is in line with the classic channel trading theory.
Outlook
Bull Outlook: If the US inflation data exceeds expectations, the market's expectations for a more aggressive rate cut by the Federal Reserve will be further strengthened, and gold prices are expected to re-challenge the high of $3167.60 after a correction. Technically, gold prices need to return to above $3055.00 to reactivate upward momentum. The widening of the Bollinger Band width indicates that volatility is increasing, which provides potential trading opportunities for bulls.
Bear Outlook: In the short term, the downward divergence of the upper track of the Bollinger Band indicates that gold prices may face further corrections. The MACD histogram turned green and continued to expand, suggesting that downward momentum is accumulating. If the gold price falls below the key support of $2,971.31, it may trigger a deeper adjustment, and the next target will be $2,950.00 or even $2,920.00.

DeGRAM | DXY continues to growDXY is in a descending channel between trend lines.
The price is moving from the lower boundary of the channel.
During the momentum corrections, the chart successfully maintained the structure and held the 50% retracement level.
We expect the upward movement in the channel to continue.
-------------------
Share your opinion in the comments and support the idea with like. Thanks for your support!

DeGRAM | DXY dollar in the turbulence zoneDXY is in a descending channel under the trend lines.
The price is moving from the upper boundary of the channel.
After breaking the trend line, the chart went sharply lower amid the announcement of trade duties, after which it formed a gap.
On the main timeframes indicators have gone into the oversold zone.
We expect that the index will seek to close the gap after testing the lower boundary of the channel.
-------------------
Share your opinion in the comments and support the idea with like. Thanks for your support!

4.7 Gold opened lower and continued to fall!!!Gold fell sharply again at the opening of the morning session. The root cause is that the United States imposed tariffs on many countries and the countermeasures of various countries have triggered panic in the global financial market. The U.S. stock market fell sharply and the U.S. dollar index fluctuated. This macroeconomic uncertainty has increased the safe-haven demand for gold, but the liquidity problems caused by market panic may cause investors to sell gold in exchange for cash, so it will suppress the price of gold. The overall market sentiment is relatively complex, and the long-short game is fierce. From the disk, gold has gradually turned short!
In the current situation, don’t expect gold to rise sharply in a short period of time to form a rebound. The gold content of following the trend is still rising. We will go short in the morning when we wait for a rebound! The upper pressure level focuses on the closing price of 3036 last week, and the further pressure level is the top and bottom conversion level of 3054! You can ambush and short near 3050 in the morning! The falling market is all the way down, don’t blindly guess the bottom!
Specific strategy
Gold 3050 short, stop loss 3056, target 3000

DeGRAM | DXY continued growthThe DXY is in an ascending channel between the trend lines.
The price is moving from the support level, the lower boundary of the channel and the lower trend line, which has already acted as a rebound point.
The chart has formed a harmonic pattern and successfully held the 50% retracement level.
We expect the growth to continue.
-------------------
Share your opinion in the comments and support the idea with like. Thanks for your support!

4.1 Technical analysis of short-term gold trading BUYGold is currently temporarily maintaining a high range oscillation in the 4-hour level trend, but the short-term moving average continues to maintain a strong trend, and a wave of bottoming rebound in the 4-hour level trend has basically completed the repair of the technical pattern. Pay attention to the secondary pull-up trend after the high-level oscillation repair is completed. The hourly level trend is currently temporarily maintained in a high-level oscillation, but the strength and continuity of the US market's retracement are not particularly large. The technical pattern of the small-level cycle trend has also been gradually adjusted and completed, and it tends to be able to continue to rise in the late trading.
Intraday short-term operation:
BUY: 3110 Stop loss: 3005-3100 Target 3125-3130

3.31 Gold US market operation analysis suggestions!Gold intraday analysis and operation: How to judge the next step after gold breaks through 3130!
Gold's strong rise in the Asian session has brought the price of gold close to 3130 and finally stagnated at 3127. The impact of the US market has not yet appeared, but with the current trend, the volatility of gold tonight will not be too small. The overall idea is to maintain the low north. The intraday volatility range is maintained within the range of 40 points between 3090 and 3130. The current increase has exceeded market expectations. Although there is selling pressure, it is all suppressed by the bulls!
US market pressure focus: 3130-3150 above and 3110-3095 below
The above analysis is a personal analysis suggestion, I hope it can bring some gains to everyone!
We will update regularly every day and introduce to you how we manage active ideas and settings. Thank you for your likes, comments and attention, we are very grateful

Gold breaks new high again, the market waits for a pullback to gFundamentals: Gold hits a new record high today, and the market continues to hold a bullish view after the decline.
Gold is currently maintaining a relatively strong oscillating trend in the large-scale cycle trend, and the upward space in the large-scale cycle trend is likely to have not yet been completed. The daily level trend continues to maintain a relatively strong oscillating trend along the short-term moving average. The wave of decline before and after the European session has completed the repair of the technical form to a certain extent. The oscillating repair temporarily maintained at a high level in the hourly level trend currently has no particularly obvious trend. The range in the short-term trend may be compressed to the oscillating repair trend between 3060-85. Although there are some rebounds in the small-scale cycle trend, the strength and continuity are not too large. Pay attention to the short-term adjustment and repair.
Operation suggestions:
Short near 3080-7, stop loss 3085.2,
Long near 3059-60, stop loss 3053.1.
Real-time market intraday guidance.

3.25 Gold short-term operation technical analysis suggestionsOn Tuesday (March 25), the spot gold market showed a trend of consolidation under the interweaving of multiple factors.
Fundamental analysis: the game between policy expectations and risk sentiment
1. The expectation of the Fed's interest rate cut dominates the market sentiment
2. The suppression of risk aversion demand by risk events
3. Short-term disturbance of macroeconomic data
Technical analysis:
The current price fluctuates narrowly in the range of 3000-3033 US dollars. As the upper edge of the transaction concentration area in the past three months, 3000 US dollars has become a battleground for long and short positions. If the daily closing price effectively falls below this position, technical selling may push the price down to the support area of 2982-2978 US dollars, or even test 2956 US dollars (the support of the previous breakthrough position conversion). On the contrary, if the price stands at 3033 US dollars (overnight high), it is expected to challenge the historical high of 3057-3058 US dollars set last week, and a new round of upward space will be opened after the breakthrough.
Resistance: 25 30 40
Support: 18 08 3000

3.25 Gold short-term shock callbackGold's current strong trend in the large-scale cycle trend has changed. Pay attention to the support band around 2950 during the week. In the 4-hour level trend, the price rebounded and touched the previous pressure band and then began to fall back. The short-term moving average continued to diverge downward and continued to be weak in the short-term trend. The price began to slowly fall below the short-term terraced support band, tending to have a downward space in the short-term trend. The short-term trend began to show signs of stabilizing slightly after a wave of rapid declines. Pay attention to whether there will be a second downward trend after a small rebound and repair in the late trading. If it falls below 3000, look at 2990 85 below. Otherwise, look up 20-30

3.20 Focus on the long and short battle of the Federal Reserve!!On Wednesday (March 19), the spot gold price continued to fluctuate at a high level during the Asian and European sessions, hitting a record high of $3,045/ounce during the session, and then fell slightly to around $3,029. The market focus is highly concentrated on the upcoming Fed's March interest rate decision.
Fundamentals: 1. The struggle between risk aversion demand and policy expectations
2. Rising geopolitical risk premiums
3. Trump's tariff remarks sparked concerns about economic recession
4. Fed policy expectations dominate short-term fluctuations
Technical aspects: Long and short game in high-level fluctuations
4-hour structure chart:
Bollinger Band pattern: upper track 3044.86, middle track 3031.24, lower track 3017.63, the current quote 3030.49 is close to the middle track, indicating a short-term balance of long and short forces. If the price stands firm on the middle track, it is expected to test the upper track (3044) again; if it falls below the middle track, it may seek support from the lower track (3017)
Moving average support: The 100-day moving average (2928.75) and the 200-day moving average (2903.27) form a long-term support band, and the price difference with the current quotation exceeds US$100, further verifying that gold is in a strong cycle.
Resistance level: 3050 3080 3100
Support level: 3018 3000 2980

3.19 Gold continues to peak, waiting for the Fed's interest rateThe gold market continued to rise strongly after opening yesterday, reaching the highest point of 3038 and then consolidating at a high level, with no obvious adjustment in the middle. Although we determined that the market would surge, it was still stronger than expected. The daily line finally closed with a big positive line with a slight shadow line. After this pattern ended, the bulls in today's market are still there.
Resistance level: 3045 3050

3.17 Gold short-term may extend low and longLast week, the gold market opened at 2912.9 at the beginning of the week, and then fell back at the beginning of the week. After the weekly low reached 2880, the market rose strongly due to risk aversion. After breaking the previous historical high of 2957, the market accelerated upward. On Friday, the weekly high reached 3005.2, and then the market consolidated. The weekly line finally closed at 2986.1, and the market closed with a big positive line with a lower shadow slightly longer than the upper shadow. After this pattern ended, the market continued to look at the bullish demand point after the adjustment at the beginning of the week. After the breakout of 2940 and 2958 last week, the stop loss was followed up at 2956.
Short-term operation suggestions:
SELL: 2995 target 2980 70 stop loss 10

3.14 Gold peaks againGold is forming higher highs while forming an ascending triangle, which will be confirmed if the price of gold closes above the record high of $2,982/oz on a daily basis. If the price of gold breaks the record high, then the price of gold will target the round mark of $2,990/oz. If the buyers conquer the latter, a test of the psychological barrier of $3,000/oz will be inevitable.
The 14-day relative strength index (RSI) is moving higher above 50, supporting the case for further upside in gold prices.
On the other hand, the price of gold has strong support at the 21-day simple moving average (SMA) of $2,914/oz. If the selling pressure intensifies, the price of gold will challenge the ascending trendline support of $2,893/oz. Failure to defend this level will accelerate the decline towards the psychological level of $2,850/oz.
Resistance 2980 2990 3000
Support 2950 2930 2900
As always, we will be updating regularly throughout the day and letting you know how we are managing active ideas and settings. Thank you all for your likes, comments, and attention, we really appreciate it!

3.10 Gold short-term operation analysis and suggestionsIn early Asian trading on Monday (March 10), spot gold fluctuated in a narrow range and is currently trading around $2,912.60 per ounce. Gold prices have fluctuated at high levels for three consecutive trading days, but they still rose 1.65% on a weekly basis, helped by safe-haven inflows and the U.S. employment report showing that job growth in February was lower than expected, suggesting that the Federal Reserve is expected to cut interest rates this year. In addition, the volatile tariff policy of U.S. President Trump has also increased uncertainty.
Gold continues to fluctuate in a range, and the overall trend is in an upward trend. After the adjustment, the price of gold will continue to rise. The idea is to continue to step back on low-multiple operations. Pay attention to the 2898 support during the day. Relying on this position, short-term long, stop loss 2889, stop profit at 2922/2932. Breaking the 2932 suppression is expected to further rush to a new high.
In addition, if it falls below the support near 2889, coupled with the recent strength of the U.S. dollar, gold may fall further, so if it falls below the support, don't consider continuing to go long, pay attention to the risk.
March 10th gold short-term trading: long near 2898, stop loss 2889, take profit 2922/2932
Backup ideas: (fall below 2889, rebound to 2896 and continue to short, stop loss 2904, take profit 2880-2876)

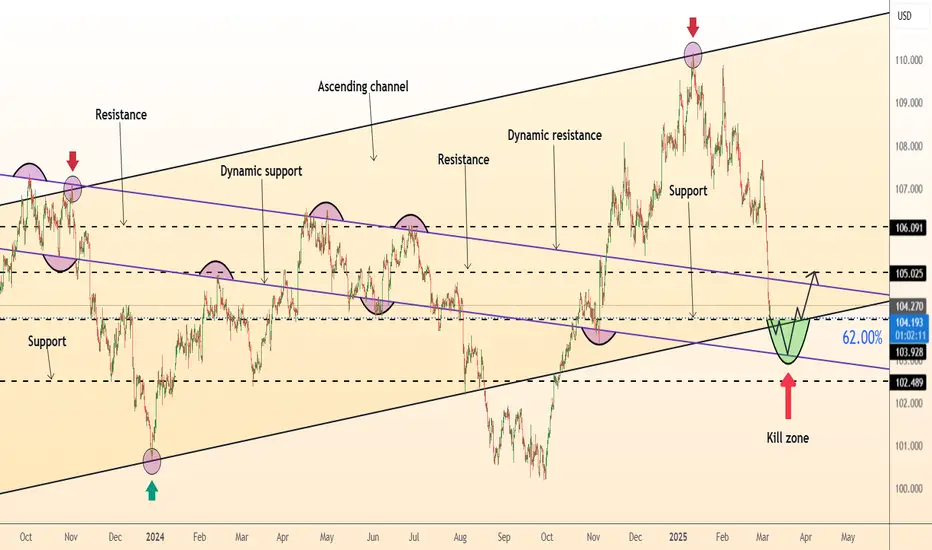
DeGRAM | DXY retest of channel boundaryThe DXY is in an ascending channel between trend lines.
The price has approached the lower boundary of the channel and the support level coinciding with the 62% retracement level, but has not yet reached the lower trend line.
On the 4H Timeframe, the indicators are in the oversold zone and on the 1H they have formed a bullish convergence.
We expect a rebound.
-------------------
Share your opinion in the comments and support the idea with like. Thanks for your support!