DXY - The US dollar index is showing signs of slowing downEconomists said the Fed had completed its monetary tightening cycle, reducing the chances of the U.S. going into recession.
In the Wall Street Journal's latest quarterly survey, economists and business leaders lowered the odds of the U.S. going into recession next year from an average of 54% in July to a more optimistic 48%. This is the first time since the middle of last year that the probability has fallen below 50%.
He mainly attributes his optimism to three factors. Inflation continues to decline, the Federal Reserve has finished raising interest rates, the job market is strong, and economic growth is well above expectations. The survey was conducted October 6-11 among 65 economists. Doug Porter and Scott Anderson, economists at BMO, say the odds of the U.S. going into recession continue to decline as the banking sector crisis eases and the labor market and incomes recover strongly. Rising real income supported consumption.
Dxysignals

DXY : Short Trade , 1hHello traders, we want to check the DXY chart. The price has broken the ascending channel to the bottom and pulled back to the key level indicated. We expect this level to play the role of a resistance level and the price will fall to around 105,600. Good luck.

DXY Index New Week MovePair : XAUUSD ( Gold / U.S Dollar )
Description :
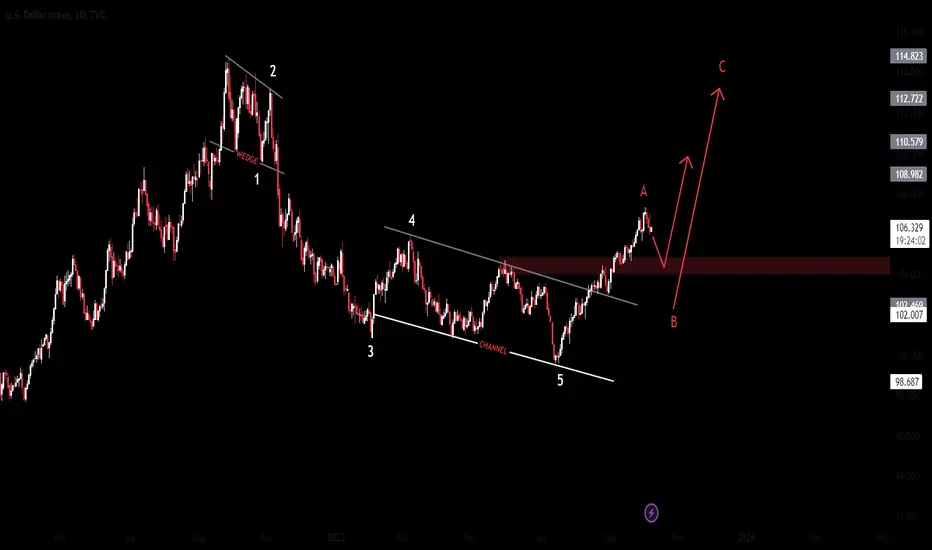
Impulsive Waves " 12345 " and Corrective Wave " A " Completed. We have Break of Structure with the Retracement , It can Reject from Fibonacci Level - 50.00 / 61.80%. Bearish Channel in Short Time Frame it will Complete its Retracement and will Complete its " B " Corrective Wave
Entry Precautions :
Because of Israel / Palestine War Market can make false move so be careful

⚠️DXY will Go Down again⏰(15-Min)⏰⚠️DXY Index is running near the Uptrend line and 🟡 Price Reversal Zone(PRZ) 🟡.
According to the theory of Elliott waves , the DXY index has succeeded in completing its 5 ascending waves near the 🟡 Price Reversal Zone(PRZ) 🟡.
💡Also, we can see Regular Divergence(RD-) between two consecutive peaks.
🔔I expect the DXY Index to trend lower in the coming hours and at least go down to the 🟢 Support zone($106.330_$106.160) 🟢.
U.S.Dollar Currency Index ( DXYUSD ) Analyze, 15-minute time frame⏰.
Do not forget to put Stop loss for your positions (For every position you want to open).
Please follow your strategy; this is just my Idea, and I will be glad to see your ideas in this post.
Please do not forget the ✅' like '✅ button 🙏😊 & Share it with your friends; thanks, and Trade safe.

💸DXY Index💸 will Go Up by Falling Wedge Pattern⏰(1-Hour)⏰✅The DXY Index has completed a Falling Wedge Pattern in the 🟢Heavy Support zone($105.80_$104.530)🟢 and 🟡 Price Reversal Zone(PRZ) 🟡.
💡Also, we can see Regular Divergence(RD+) between two consecutive valleys .
🔔I expect the DXY Index will go UP after breaking the upper line of the Falling Wedge Pattern to the 🔴 Resistance zone 🔴.
U.S.Dollar Currency Index ( DXYUSD ) Analyze, 1-hour time frame⏰.
Do not forget to put Stop loss for your positions (For every position you want to open).
Please follow your strategy; this is just my Idea, and I will be glad to see your ideas in this post.
Please do not forget the ✅' like '✅ button 🙏😊 & Share it with your friends; thanks, and Trade safe.

DXY NEW MACRO ANALYSISClosing of the day or week below or above this level will determine the DXY movement.
Before this jump in the last analysis, I wrote that divergences were formed and that dxy should now jump.
News along with divergences pushed the price.
If the price keeps this level, the expectation is 108, as was the plan all this time, but we will see what the price shows

DXY Index will Go Down to 🟢Heavy Support zone🟢(1-Hour)⏰✅The DXY index managed to break the Uptrend line and 🟢 Support zone 🟢.
💫Currently, DXY reacted well to the Resistance line and formed a 💫Shooting Star Candlestick Pattern💫 near this line in the 1-hour time frame ⏰.
🔔I expect the DXY to trend lower in the coming hours , enter the 🟢 Heavy Support zone 🟢, and fall to at least the 🟡 Price Reversal Zone(PRZ) 🟡.
U.S.Dollar Currency Index ( DXYUSD ) Analyze, 1-hour time frame⏰.
Do not forget to put Stop loss for your positions (For every position you want to open).
Please follow your strategy; this is just my Idea, and I will be glad to see your ideas in this post.
Please do not forget the ✅' like '✅ button 🙏😊 & Share it with your friends; thanks, and Trade safe.

USD is showing positive signals amid tensions in the Middle EastEarlier this week, the safe-haven dollar strengthened against the euro as military clashes between Israel and the Palestinian Islamic militant group Hamas raised concerns that the conflict could spread beyond Gaza. However, the dollar weakened against other major currencies.
Yesterday, Israeli Prime Minister Benjamin Netanyahu said Israel's response to the multi-pronged attack by Palestinian armed groups from Gaza would "transform the Middle East." Risk sentiment is fragile as Israel announces it is mobilizing 300,000 reservists and imposing a complete blockade of Gaza amid potential attacks in response to weekend attacks by Hamas.
Fed member Bostic told the American Bankers Association that even if the Fed raises interest rates to slow the economy while keeping inflation in check, there is no prospect of a recession. Joseph Trevisani, a senior analyst at FX Street in New York, said Bostic's response comes amid the eruption of conflict in the Gaza Strip.
Analysts also said the decline in U.S. yields initially reflected comments from Fed officials that there may not be a need for further rate hikes given the rise in long-term yields, and the port sector becoming a safe-haven asset following a monetary policy clash. He said this was due to comments from traders who were looking for. Hamas and Israel.
Traders are currently waiting for key US inflation figures to be released today, October 11th. Investors are also keeping an eye on developments surrounding the conflict between Israel and the Palestinian Islamic group Hamas.

DXY Index New Week MovePair : DXY Index
Description :
Falling Wedge as an Corrective Pattern in Short Time Frame and Breakout of the Upper Trend Line and Retracement. Completed " 12345 " Impulsive Waves and " A " Corrective Wave. We have Strong Divergence and Break of Structure
Entry Precautions :
Don't Enter until its Rejects from Previous Support or Complete its Retracement
DeGRAM | Dollar index. Long to resistanceDXY broke the ascending channel and moved lower. However, the trend is bullish.
Price action is slowing as it approaches support.
We expect the price to go lower from the previous low because we don't have a proper higher high, and in order to make new highs, the price has to go lower.
-------------------
Share your opinion in the comments and support the idea with like. Thanks for your support!

DXY will Fall by Head and Shoulders Pattern⏰(1-Hour)⏰✅The DXY Index has managed to form a Head and Shoulders Pattern in the 🔴Resistance zone🔴.
🔨DXY broke the 🟢 Support zone 🟢 and Neckline hours ago.
🔔I expect DXY to start falling again to 🟡 Price Reversal Zone(PRZ) 🟡and Uptrend line after completing the pullback to Neckline .
U.S.Dollar Currency Index ( DXYUSD ) Analyze, 1-hour time frame⏰.
Do not forget to put Stop loss for your positions (For every position you want to open).
Please follow your strategy; this is just my Idea, and I will be glad to see your ideas in this post.
Please do not forget the ✅' like '✅ button 🙏😊 & Share it with your friends; thanks, and Trade safe.

DXY King Dollar has still fuel on this rally.The DXY (U.S. Dollar Index) is on a strong 3 month rally that has taken the market by surprise. However if we look on the (much) larger time-frames such as today's 1M (monthly), we see that this move wasn't so unexpected.
First of all, the price rebounded just before it hit the 1M MA50 (blue trend-line). On a large scale, DXY is simply extending the Channel Up pattern that emerged after the market broken above the Lower Highs of 1985 on the January 2015 candle. Fed wanted to believe it but this break-out extended the Channel Up that has already started on the 2008 bottom, the peak of the Housing Crisis. The central bank policies certainly achieved at keeping the greenback the most desired currency in the world.
Now back to the analysis, we can see that the 1M RSI symmetry suggests that the price might be on the final bullish wave before a new correction to or even below the 1M MA50. Still though, the current bullish wave has much room to grow before it exhausts.
Do you think it will keep rising and maybe reverse by Q2 2024?
-------------------------------------------------------------------------------
** Please LIKE 👍, FOLLOW ✅, SHARE 🙌 and COMMENT ✍ if you enjoy this idea! Also share your ideas and charts in the comments section below! This is best way to keep it relevant, support us, keep the content here free and allow the idea to reach as many people as possible. **
-------------------------------------------------------------------------------
💸💸💸💸💸💸
👇 👇 👇 👇 👇 👇

DXY Index New Week MovePair : DXY Index
Description :
Breakout the Upper Trend Line of the Consolidation Phase and Completed the Retracement. Completed Impulse and Corrective Waves " ABC ". It has Breakout the Upper Trendline of the Corrective Pattern Falling Wedge in Short Time Frame
DeGRAM | Dollar Index longDXY is in a bullish trend and broke and closed above the 106.000 level.
Price action is trading in the ascending channel. If price pullbacks to support level,we can look for buying opportunities.
We expect the resistance zone to be tested because the price broke a significant level of resistance.
-------------------
Share your opinion in the comments and support the idea with like. Thanks for your support!

DXY Analysis 1 Okt 2023Based on Dxy's recent movements over the past 2 weeks, there hasn't been a noticeable correction. Despite the fact that the price has reached Fibo Extensions 1, it's likely that there will still be an upward trend towards a price of 109,000.

DXY Index New Week MovePair : DXY Index
Description :
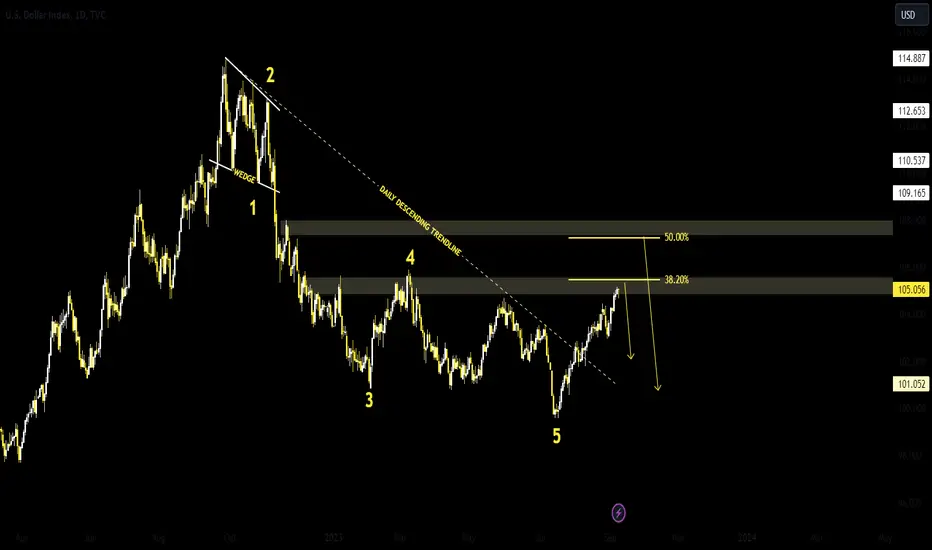
Completed Impulsive Waves " 12345 " and " a " can Possibly Reject from Fibonacci Level - 38.20% / 50.00%. We have Bearish Channel as an Corrective Pattern in Short Time Frame with the Breakout of the Upper Trend Line and Retracement

DXY Index Next Week MovePair : DXY Index
Description :
Completed " 12345 " Impulsive Wave and it will Complete its " A " Corrective Wave at Fibonacci Level - 38.20% / 50.00%. It has Breakout the Upper Trendline it can Reject from the Current Resistance to complete its Retracement

🚨DXY Index is Ready to Fall🚨(1-hour)🏃♂️The DXY Index is moving in a 🔴Heavy Resistance Zone🔴.
🌊According to the theory of Elliott waves , the DXY index is near the end of five impulsive waves .
🔔I expect wave 5 to end near the Resistance line and 🟡 Price Reversal Zone(PRZ) 🟡 and start to fall.
DXY Index Analyze ( DXYUSD ), 1-hour time frame ⏰.
Do not forget to put Stop loss for your positions (For every position you want to open).
Please follow your strategy; this is just my Idea, and I will be glad to see your ideas in this post.
Please do not forget the ✅' like '✅ button 🙏😊 & Share it with your friends; thanks, and Trade safe.

DXY New Week MovePair : DXY Index
Description :
It has completed the Impulsive Waves " 12345 " and Making its " A " Corrective Wave. We have Break of Structure with Retracement it can Reject from Fibonacci Level - 38.20% / 50.00%
💵DXY💵 will have an upward trend in the Coming Months🚀Hi everyone👋.
💡The DXY index managed to break the 🔴 Resistance zone($103.80-$103.38) 🔴 last week.
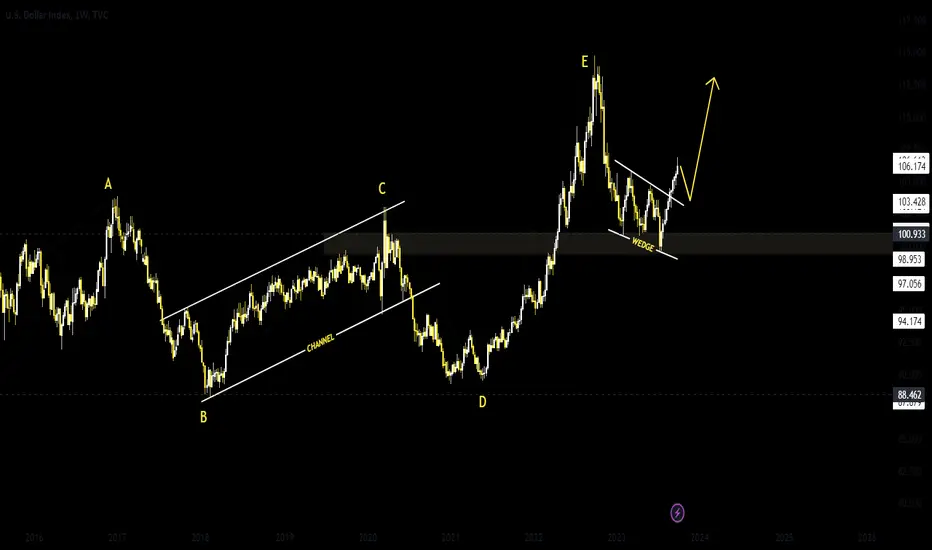
🌊According to the Elliott wave theory , DXY completed the Zigzag correction(ABC/5-3-5) with the Expanding Ending Diagonal .
🔔I expect the DXY index to go up in the 🌙Coming Months🌙 and break the upcoming 🔴 Resistance zones 🔴 one by one.
U.S.Dollar Currency Index ( DXYUSD ) Analyze, Daily time frame⏰.
Do not forget to put Stop loss for your positions (For every position you want to open).
Please follow your strategy, this is just my Idea, and I will be glad to see your ideas in this post.
Please do not forget the ✅' like '✅ button 🙏😊 & Share it with your friends; thanks, and Trade safe.

DXY is eyeing 105.50In my 24th of August DXY analysis, I explained why I'm bullish USD Index and suggested buy dips around 103 support.
It worked like a charm and after a short dive to support, bulls returned with vengeance and drove the price back up to resistance.
At this moment I expect also a break above this resistance in which instance traders could expect continuation towards the next one at 104.50.
I'm looking to sell rallies for EurUsd, AudUsd, GbpUsd, and NzdUsd.
My 24th August analysis:

DXY First 1W MA50 test since March. Bullish or bearish?The U.S. Dollar Index (DXY) has come the closest it's been to the 1W MA50 (red trend-line) in 6 months (since March 09 2023). So far the price action has shown a bearish reversal sentiment as the Higher Lows trend-line of the rally since the July 14 bottom, broke last week, but the 1D MA200 (orange trend-line) supported. This bearish sentiment will be confirmed however if the price gets rejected on the 1W MA50, i.e. test it and close the 1W candle below it.
In that case we will open a sell on the spot and target the 1D MA200 again and Support 1 at 103.000. If after that the price closes a 1D candle below, we will sell again towards Support 2 (102.000).
-------------------------------------------------------------------------------
** Please LIKE 👍, FOLLOW ✅, SHARE 🙌 and COMMENT ✍ if you enjoy this idea! Also share your ideas and charts in the comments section below! **
-------------------------------------------------------------------------------
💸💸💸💸💸💸
👇 👇 👇 👇 👇 👇

DXY, ready to challenge the year's (2023) High.Ever since the greenback (DXY) hit the year's (2023) low at 99.595 on 14th July 2023 the price has steadily rise from the base of the descending channel and attempted to breakout on 17th August and finally broke out last Friday, 1st September on the back of the NFP fundamentals.
Last Thursday daily candle closed above the EMA-200 and also broke out of the descending channel with the Friday's candle.
The DXY is ready for an upside swing to a yearly (2023) high of 105.834 and potentially furthering up to 107.342 in the days to come. What an exciting time for the DXY.
DXY is adequately supported by the EMA-200, 100 and 20 on the Daily Time Frame.
