DXY New Week Pair : DXY Index
Description :
Bearish Channel as an Corrective Pattern in Short Time Frame with the Breakout of Upper Trend Line
Fibonacci Level - 61.80%
Demand Zone
Completed " 1234 " Impulsive Waves
Break of Structure
Dxysignals

DXY IndexPair : DXY Index
Description :
Elliot Waves 12345 Impulsive Waves and A Corrective Waves
Fibonacci Level 50.00 / 61.80
CHOCH
Breakout and Retracement of Bearish Channel
Demand Zone

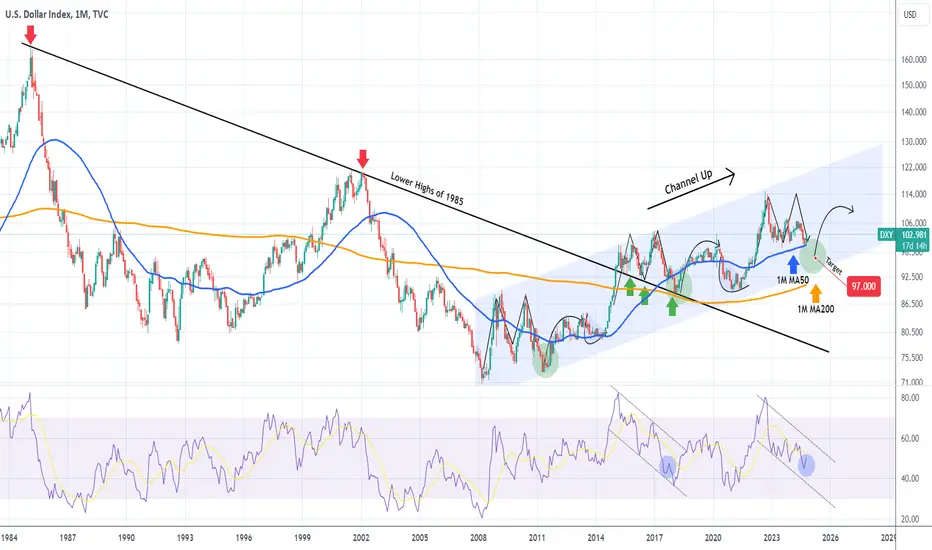
DXY Rebounding on the 1M MA50. But for how long?The U.S. Dollar index (DXY) is on a strong green 1M candle, already halfway through the month of October, as it is rebounding after making an exact test of the 1M MA50 (blue trend-line), the long-term Support.
On this chart we can see the DXY's multi-year price action. Even though it was on a heavy downtrend since the February 1985 High, it managed to break above it in January 2015 and sustain a strong Channel Up, coming off the March 2008 bottom of the disastrous Housing Crisis.
Within this strong Channel Up, we see a repeated pattern as long as Bullish and Bearish Legs are concerned. As you can see, the bottoms have been formed significantly below the 1M MA50, so this indicates that it is not time to buy yet.
If anything, a controlled short is justified and as we get closer to the bottom of the Channel Up, start buying on a multi-year basis (as long as the 1M MA200 (orang trend-line) holds). Based on the 1M RSI, where the similarities with the previous Leg are more obvious, we should be around levels similar to October 2017, so starting next month or December, we should start resuming the downtrend and a 'modest' level to target is 97.000.
-------------------------------------------------------------------------------
** Please LIKE 👍, FOLLOW ✅, SHARE 🙌 and COMMENT ✍ if you enjoy this idea! Also share your ideas and charts in the comments section below! This is best way to keep it relevant, support us, keep the content here free and allow the idea to reach as many people as possible. **
-------------------------------------------------------------------------------
💸💸💸💸💸💸
👇 👇 👇 👇 👇 👇
DXY Sell this Oct-Nov dead-cat-bounce and target 97.000.Last time we looked into a such a long-term (multi-year) time-frame on the U.S. Dollar Index (DXY) was 10 months ago (December 15 2023, see chart below) where we gave the most optimal buy entry at the time:
We now take it to the 1M time-frame where the long-term trend gets more clear and the pattern as you can see is a Channel Up since the March 2008 bottom (U.S. Housing Crisis). The most recent Higher High was back in September 2022 and since then the index has been on a decline in an attempt to form the bottom on the Higher Lows trend-line of the Channel Up.
As you can see, we are in the later stages of this (multi-year) Bearish Leg but last month (September) it hit its 1M MA50 (blue trend-line) for the first time since January 2022 and held it. This is expected to delay the Lower Low for a while but most likely won't invalidate it as if it closes a 1M candle below it, we expect to test the bottom by Q2 2025.
Both the Bearish and Bullish Phases seem to be consistent within this 16-year Channel Up, having a fair degree of symmetry. The Bearish Phases have previously come in the form of successive Channel Down patterns (dashed), so if this analogy continues to hold this time also, we should be half-way through the second currently.
All those Channel Down patterns dropped to at least the 1.236 Fibonacci extension from the first pull-back they had. This consistency is remarkable. Such pattern suggests that after the current rebound is completed (technically it shouldn't exceed the 1W MA50 (red trend-line), the price could decline to 96.000.
Our Target is a bit higher at 97.000, which would make an ideal Higher Low on this 16-year old Channel Up.
After that, the confirmation to buy (which naturally will tell us that the bottom is already in) would be a 1M MACD Bullish Cross below the 0.0 mark. As you see, this took place 5 times these 16 years, all of which have been excellent buy entries with the lowest risk possible.
-------------------------------------------------------------------------------
** Please LIKE 👍, FOLLOW ✅, SHARE 🙌 and COMMENT ✍ if you enjoy this idea! Also share your ideas and charts in the comments section below! This is best way to keep it relevant, support us, keep the content here free and allow the idea to reach as many people as possible. **
-------------------------------------------------------------------------------
💸💸💸💸💸💸
👇 👇 👇 👇 👇 👇

DXY (Dollar Index) Technical Analysis and Day Trade Idea👀 👉 The DXY (Dollar Index) recently shifted into a bullish structure on the 4H timeframe, with price now approaching a key resistance level. This could present a potential short day trade opportunity. In this video, we analyse the DXY in detail, reviewing the trend, market structure, and price action, while exploring a possible trade setup. Disclaimer: Forex trading carries significant risk, and market conditions can change rapidly. The information provided is for educational purposes only and does not constitute financial advice. 📉✅

DXY Pair : DXY Index
Description :
Completed " 12345 " Impulsive Waves
Break of Structure
Resistance Level
Bearish Channel as an Corrective Pattern in Short Time Frame
Fibonacci Level - 38.20 / 50.00

Dollar Index (DXY): Bearish Trend Continues
Dollar Index violated a support line of a wide horizontal range on a daily.
Taking into consideration that the market is trading in a long term bearish trend,
chances are high that a bearish rally will continue.
Next support - 100.00
❤️Please, support my work with like, thank you!❤️

DXY Pair : DXY Index
Description :
Resistance Level
Completed " 12345 " Impulsive Waves
Break of Structure
RSI - Divergence
Double Bottom Pattern as an Corrective Pattern in Short Time Frame

DXY hit the 1W MA200 for the 1st time in 8 months! Will it hold?The U.S. Dollar index (DXY) following the Fed's -0.50% Rate Cut, hit on Wednesday its 1W MA200 (orange trend-line) for the first time in 8 months (since the week of January 10 2024). This is obviously the strongest Support on a long-term basis and technically should attract the first wave of buying pressure.
However, the multi-year pattern, being a Channel Up, suggests that given some more weeks it should break and go for a Higher Low (blue Arc). As you can see on this pattern, every time the 1W MA200 was tested during a Bearish Leg, it broke.
The last two Bearish Legs initially made a dead-cat-bounce and then priced the Low just above the 1.236 Fibonacci extension. The 1W RSI in particular provides very useful insight on this, as on the first oversold (below 30.00) Low it makes the bounce and then on the second RSI low, which is a Higher Low i.e. a Bullish Divergence, the price bottoms and rebounds long-term.
As a result, with the 1W RSI bouncing on the 30.00 oversold barrier, we expect the price to rebound for a few weeks and then resume the downtrend towards the 1.236 and the bottom of the multi-year Channel Up. Our Target is 97.000.
-------------------------------------------------------------------------------
** Please LIKE 👍, FOLLOW ✅, SHARE 🙌 and COMMENT ✍ if you enjoy this idea! Also share your ideas and charts in the comments section below! This is best way to keep it relevant, support us, keep the content here free and allow the idea to reach as many people as possible. **
-------------------------------------------------------------------------------
💸💸💸💸💸💸
👇 👇 👇 👇 👇 👇

DXY "DOLLAR INDEX" Bank Money Heist Plan On Bullish SideBonjour My Dear Robbers / Money Makers & Losers, 🤑 💰
This is our master plan to Heist DXY "DOLLAR INDEX" Bank based on Thief Trading style Technical Analysis.. kindly please follow the plan I have mentioned in the chart focus on Long entry. Our target is Red Zone that is High risk Dangerous level, market is overbought / Consolidation / Trend Reversal / Trap at the level Bearish Robbers / Traders gain the strength. Be safe and be careful and Be rich.
Attention for Scalpers : If you've got a lot of money you can get out right away otherwise you can join with a swing trade robbers and continue the heist plan, Use Trailing SL to protect our money 💰.
Note: If you've got a lot of money you can get out right away otherwise you can join with a swing trade robbers and continue the heist plan, Use Trailing SL to protect our money.
Entry : Can be taken Anywhere, What I suggest you to Place Buy Limit Orders in 15mins Timeframe Recent / Nearest Swing Low
Stop Loss 🛑 : Recent Swing Low using 1H timeframe
Warning : Fundamental Analysis news 📰 🗞️ comes against our robbery plan. our plan will be ruined smash the Stop Loss. Don't Enter the market at the news update.
Loot and escape on the target 🎯 Swing Traders Plz Book the partial sum of money and wait for next breakout of dynamic level / Order block, Once it is cleared we can continue our heist plan to next new target.
Support our Robbery plan we can easily make money & take money 💰💵 Follow, Like & Share with your friends and Lovers. Make our Robbery Team Very Strong Join Ur hands with US. Loot Everything in this market everyday make money easily with Thief Trading Style.
Stay tuned with me and see you again with another Heist Plan..... 🫂

DXY IndexPair : DXY Index
Description :
Completed " 12345 " Impulsive Waves
Consolidation Phase
RSI - Divergence
Bearish Channel as an Corrective Pattern in Short Time Frame
Triple Bottom

DXY "Dollar Index" Bank Money Heist Plan on Bullish SideHola ola My Dear,
Robbers / Money Makers & Losers,
This is our master plan to Heist DXY "Dollar Index" Bank based on Thief Trading style Technical Analysis.. kindly please follow the plan I have mentioned in the chart focus on Long entry. Our target is Red Zone that is High risk Dangerous level, market is overbought / Consolidation / Trend Reversal at the level Bearish Robbers / Traders gain the strength. Be safe and be careful and Be rich.
Note: If you've got a lot of money you can get out right away otherwise you can join with a swing trade robbers and continue the heist plan, Use Trailing SL to protect our money.
Entry : Can be taken Anywhere, What I suggest you to Place Buy Limit Orders in 15mins Timeframe Recent / Nearest Swing Low
Stop Loss : Recent Swing Low using 1h timeframe
Warning : Fundamental Analysis comes against our robbery plan. our plan will be ruined smash the Stop Loss. Don't Enter the market at the news update.
Loot and escape on the target 🎯 Swing Traders Plz Book the partial sum of money and wait for next breakout of dynamic level / Order block, Once it is cleared we can continue our heist plan to next new target.
Support our Robbery plan we can easily make money & take money 💰💵 Follow, Like & Share with your friends and Lovers. Make our Robbery Team Very Strong Join Ur hands with US. Loot Everything in this market everyday make money easily with Thief Trading Style.

DXY INDEXPair : DXY INDEX
Description :
Completed " 12345 " Impulsive Waves
Break of Structure
CHoCH
RSI - Divergence
Consolidation Phase

DXY USD 1WDXY ~ NSE:DOLLAR ~ 1W
#DXY Movement is always in the opposite direction of #Bitcoin.
Looking at this Chart, #DXY Loss of Momentum and breakdown of this support line.
Send Bitcoin price $100,000+ in 2025 Q1

DXY "Dollar Index" Bank Money Heist Plan on Bullish SideHola ola My Dear,
Robbers / Money Makers & Losers,
This is our master plan to Heist DXY "Dollar Index" Bank based on Thief Trading style Technical Analysis.. kindly please follow the plan I have mentioned in the chart focus on Long entry. Our target is Red Zone that is High risk Dangerous level, market is overbought / Consolidation / Trend Reversal at the level Bearish Robbers / Traders gain the strength. Be safe and be careful and Be rich.
Note: If you've got a lot of money you can get out right away otherwise you can join with a swing trade robbers and continue the heist plan, Use Trailing SL to protect our money.
Entry : Can be taken Anywhere, What I suggest you to Place Buy Limit Orders in 15mins Timeframe Recent / Nearest Swing Low
Stop Loss : Recent Swing Low using 1h timeframe
Warning : Fundamental Analysis comes against our robbery plan. our plan will be ruined smash the Stop Loss. Don't Enter the market at the news update.
Loot and escape on the target 🎯 Swing Traders Plz Book the partial sum of money and wait for next breakout of dynamic level / Order block, Once it is cleared we can continue our heist plan to next new target.
Support our Robbery plan we can easily make money & take money 💰💵 Follow, Like & Share with your friends and Lovers. Make our Robbery Team Very Strong Join Ur hands with US. Loot Everything in this market everyday make money easily with Thief Trading Style.

DXY INDEXPair : DXY Index
Description :
Completed " 1234 " Impulsive Waves
CHoCH
Bearish Channel as an Corrective Pattern in Short Time Frame
Fibonacci Level - 50.00%
Impulse Correction

S&P500 v USD since 2008. Cheap dollar guarantees stock expansionThis is a cross chart analysis between the S&P500 index (SPX) and the U.S. Dollar Index (DXY) since the 2008 Housing Crisis. Ahead of widely anticipated Fed rate cut next month, it is useful to see how the Dollar has impacted from its perspective the stock market on a multi-year basis.
As you can see, the DXY has been trading within a Channel Up since the 2009 Housing Crisis bottom. At the moment it is under the Resistance of the Lower Highs trend-line (dashed) and a rate cut should apply even stronger selling pressure and keep it under. There is still some wayt to go until it hits the bottom of the Channel Up again.
We believe that the stock market is at the point where it finishes the recovery phase (blue Arc) and will enter the expansion phase (green Channel Up), at the beginning of next year. As a result, a rate cut and as a matter of fact a series of rate cuts by the Fed, will do wonders on S&P500, giving investors steady long-term opportunities to buy low and sell high within a strictured Channel.
-------------------------------------------------------------------------------
** Please LIKE 👍, FOLLOW ✅, SHARE 🙌 and COMMENT ✍ if you enjoy this idea! Also share your ideas and charts in the comments section below! This is best way to keep it relevant, support us, keep the content here free and allow the idea to reach as many people as possible. **
-------------------------------------------------------------------------------
💸💸💸💸💸💸
👇 👇 👇 👇 👇 👇

DXY "Dollar Index" Bank Money Heist Plan on Bullish SideMy Dear Robbers / Money Makers & Newbies,
This is our master plan to Heist DXY "Dollar Index" Bank based on Thief Trading style Technical Analysis.. kindly please follow the plan I have mentioned in the chart focus on Long entry. Our target is Red Zone that is High risk Dangerous level, market is overbought / Consolidation / Trend Reversal at the level Bearish Robbers / Traders gain the strength. Be safe and be careful and Be rich.
Note: If you've got a lot of money you can get out right away otherwise you can join with a swing trade robbers and continue the heist plan, Use Trailing SL to protect our money.
Entry : Can be taken Anywhere, What I suggest you to Place Buy Limit Orders in 15mins Timeframe Recent / Nearest Swing Low
Stop Loss : Recent Swing Low using 30 mins timeframe
Warning : Fundamental Analysis comes against our robbery plan. our plan will be ruined smash the Stop Loss. Don't Enter the market at the news update.
Loot and escape on the target 🎯 Swing Traders Plz Book the partial sum of money and wait for next breakout of dynamic level / Order block, Once it is cleared we can continue our heist plan to next new target.
Support our Robbery plan we can easily make money & take money 💰💵 Follow, Like & Share with your friends and Lovers. Make our Robbery Team Very Strong Join Ur hands with US. Loot Everything in this market everyday make money easily with Thief Trading Style.

DXY IndexPair : DXY Index
Description :
Completed " 12345 " Impulsive Waves and " AB " Corrective Waves
Break of Structure
RSI - Divergence
Bullish Channel as an Corrective Pattern in Short Time Frame
Resistance Level

DXY4-hour time frame DXY analysis
The price is near the zoned swap area.
We have to wait to see if he gives approvals for the climb or not.

DXY IndexPair : DXY Index
Description :
Falling Wedge in Short Time Frame
Completed " 12345 " Impulsive Waves and " ABC " Corrective Waves
Demand Zone
RSI - Divergence
Symmetrical Triangle as an Corrective Pattern in Long Time Frame

DXY is starting a rebound to at least 106.000The U.S. Dollar Index (DXY) has been trading within a 19-month Channel Up pattern and this week (as well as on August 05), it almost reached its bottom (Higher Lows trend-line). This is a Double Bottom formation so far, which is a bullish pattern, that was also formed on the 1D RSI.
The last time the RSI completed this formation, we've had a bottom that gave way to a strong Bullish Leg. Most rallies/ declines within this pattern have been between a 4.00% to 5.00% range.
As a result, we turn bullish on DXY now, targeting 106.00, which is just below a potential +4.00% rise and almost on the 0.5 Fibonacci level of the Channel Up.
-------------------------------------------------------------------------------
** Please LIKE 👍, FOLLOW ✅, SHARE 🙌 and COMMENT ✍ if you enjoy this idea! Also share your ideas and charts in the comments section below! This is best way to keep it relevant, support us, keep the content here free and allow the idea to reach as many people as possible. **
-------------------------------------------------------------------------------
💸💸💸💸💸💸
👇 👇 👇 👇 👇 👇

US dollar market trendYesterday, the deputy governor of the Bank of Japan said that "the market is unstable and there will be no interest rate hikes". This is a relatively "dovish" statement. In addition, the upcoming September interest rate cut conveys a good opportunity to enter the market.
That is, the US dollar will still fall. Although the market is narrow today, the US dollar continued to rise at the end of the trading day, but it should not last long.
Personal analysis: looking for high points and shorting
