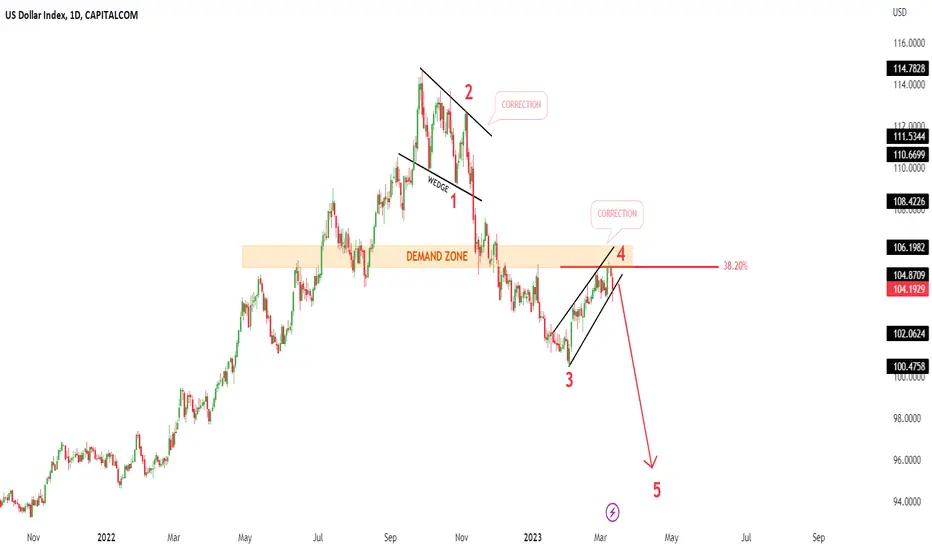
DXY Index Next Possible MovePair : DXY Index
Description :
Rising Wedge as an Corrective Pattern in Long Time Frame as an Correction with the Breakout of the Lower Trend Line and Retracement
Divergence
Break of Structure
Completed " 1234 " Impulsive Wave at Fibonacci level - 38.20%
Exp FIAT as an Correction in Short Time Frame and Rejection from the Lower Trend Line and Fibonacci Level - 78.60%
Impulse Correction Impulse
Dxytradingsetup

DXY New Week Possible MovePair : DXY Index
Description :
Symmetrical Triangle as an Correction in Long Time Frame with the Breakout and Retracement
Impulse Correction
Breakout the S / R Level or Break of Structure
Divergence
Completed " ABC " Corrective Wave
Bullish Channel

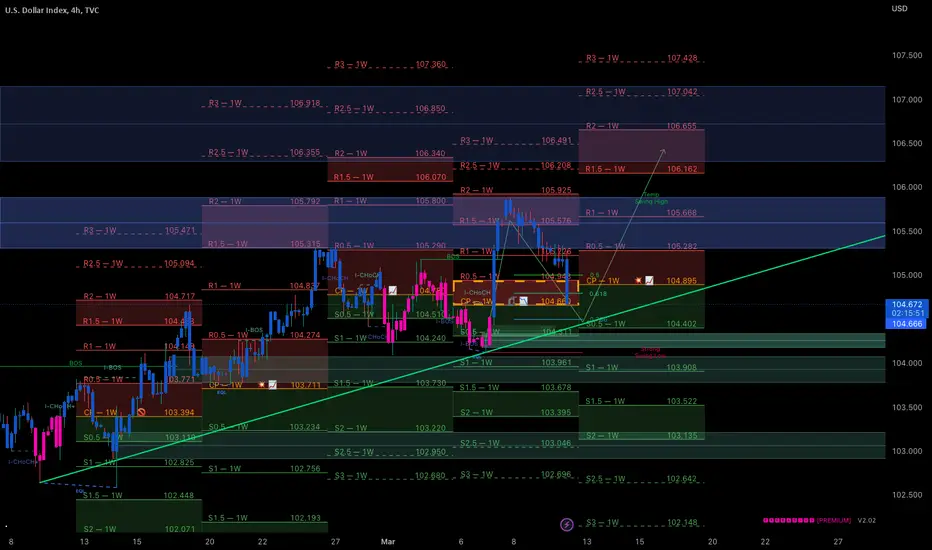
Intraday Sell DXY (22 MAR 2023)DXY intraday trading alert
3 simple steps to find a quality setup!
Risk Reward Ratio 1:2
Anyone same idea with me?
SELL DXY
Good luck traders...

DXY Chart Analysis....
AronnoFX will not accept any liability for loss or damage as a result of
reliance on the information contained within this channel including
data, quotes, charts and buy/sell signals.
If you like this idea, do not forget to support with a like and follow.
Traders, if you like this idea or have your own opinion about it,
write in the comments. I will be glad.

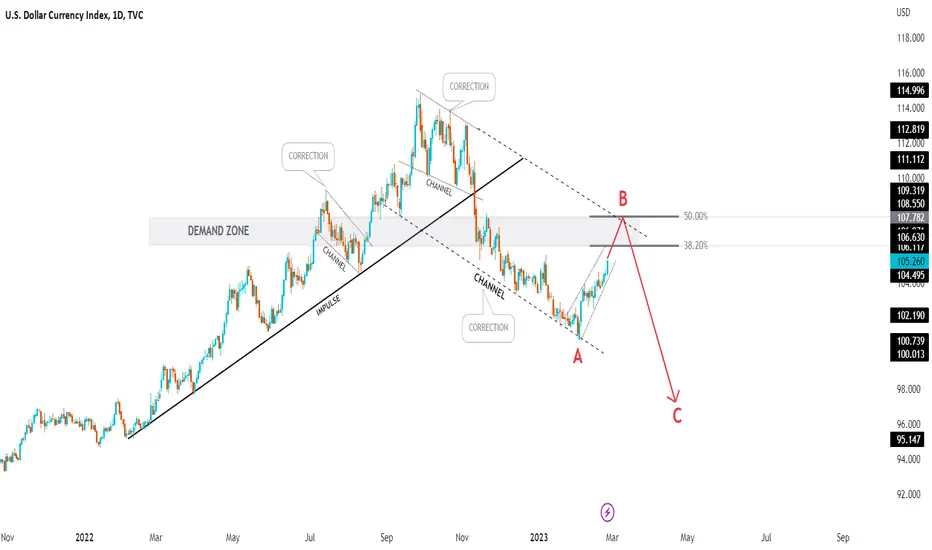
DXY Index Next MovePair : DXY Index
Description :
Rising Wedge as an Corrective Pattern in Long Time Frame and Breakout the Lower Trend Line and Retracement
Break of Structure
Completed " ABC " Corrective Wave
Falling Wedge in Short Time
Divergence
Impulse Correction

Intraday BUY DXY (16 MAR 2023)DXY intraday trading alert
3 simple steps to find a quality setup !
Risk Reward Ratio 1: 2
Anyone same idea with me?
BUY DXY
Good luck traders..

Intraday BUY DXY (16 MAR 2023)DXY intraday trading alert
3 simple steps to find a quality setup !
Risk Reward Ratio 1: 2
Anyone same idea with me?
BUY DXY
Good luck traders..

DXY Next Possible MovePair : DXY Index
Description :
Bearish Channel as an Corrective Pattern in Short Time Frame
Divergence
Break of Structure
Completed " 12345 " Impulsive Wave and " AB " Corrective Wave
Impulse Correction
Rising Wedge as an Corrective Pattern and Breakout the Lower Trend Line and Completed the Retracement

DXY Index New Week Move Pair : DXY Index
Description :
Rising Wedge as an Corrective Pattern in Short Time Frame and Breakout the Lower Trend Line
Divergence
Rejecting from the Daily Demand Zone
Break of Structure
Completed " 1234 " Impulsive Wave at Fibonacci Level - 38.20%
dxy nfp setupseems like this news is setting dxy for a nice pull back after that last explosive move if 104.200 holds we can see another leg up for a move up since dxy made a higher high im still bullish biased over all this pull back most def was needed
now if the next push up doesnt break that last dxy high we could see seelers start to step in
DXY top-down analysisHello traders, this is a complete multiple timeframe analysis of this pair. We see could find significant trading opportunities as per analysis upon price action confirmation we may take this trade. Smash the like button if you find value in this analysis and drop a comment if you have any questions or let me know which pair to cover in my next analysis.

#DXY LTF update...#DXY LTF update...
Deviating January high didn't convince me. I expect #DXY to wipe out the monthly FVG...
If it wipe out the monthly FVG first before liquidating the previous low, I expect a good correction of USD. Parallel with that #BTC will make hh's again…

DXY Dollar Index Next Move ?Pair : DXY Index
Description :
Divergence
Break of Structure
Rising Wedge as an Correction Pattern it will Reject from the Upper Trend Line
Completed " 12345 " Impulsive Wave
Bearish Channel with the Breakout of the UTL and Retracement

dxy pull back much needed pull back here from the dollar and a retest of 104.6-104.9 would be nice for a continuation to the downside
now if thats broke we could see bulls back in play but as of now its still bearish

DXY Index Next Possible MovePair : DXY Index
Description :
Divergence
Rising Wedge as an Corrective Pattern with the Breakout of the Lower Trend Line
Break of Structure will Fall to Complete the Retest at the Previous Highs
Completed " 123 " Impulsive Waves

dxy !!dxy is here at a key level once again a break here we could see another push down to that 104.4 level first then 104.200 area and if it fails to break back up we could see continued downside
on the flip side if it holds here we could see the dollar get strong
but at the moment its still a bit bearish so there will be some nice usd trade setups

DXY New Week SetupPair : DXY Index
Description :
Impulse Correction
Bearish Channel in Long Term as an Corrective Pattern
Break of Structure and Retracement at Daily Demand Zone
Fibonacci Level
Divergence
Bullish Channel as an Corrective Pattern in Short Time Frame
Completed " A - WXYXZ " Corrective Wave
DXY ( High Probability SELL Setup SOON )* Here we can see clearly the next moves for USD index ( DXY ),
* We can see clearly the Bearish Divergence on the RSI indicator,
* This shows us more confirmation for our U.S. indices Strop Bullish Move,
* We're using H2 time frame for a clearer view of our analysis, hence we can't predict the duration of our analysis to occur,
* Keep a close eye on U.S. indices coming days & weeks,
* Happy pip hunting traders,
* FX KILLA.

DXY updateDXY LTF update 🐨
Soon I expect a downward movement of US dollar index to sweep out FVG 4h... In parallel, BTC will move to its final destination towards 27k - 30k...

DXY Chart Analysis....
DOLLAR INDEX MY VIEW-
N.B- In this situation DXY chart create Bullish Flag Pattern's breakout @104.360.
resistance level, then market Buy UP to 105:000; @ 105.500 and 106:000 resistance level.
Then market need seems sell correction to nearest Support 105.500 level.
AronnoFX will not accept any liability for loss or damage as a result of
reliance on the information contained within this channel including
data, quotes, charts and buy/sell signals.
If you like this idea, do not forget to support with a like and follow.
Traders, if you like this idea or have your own opinion about it,
write in the comments. I will be glad.

DXY- BULLISH LONG TERM!Hey Everyone, DXY has rejected at our identified area when we shared an update last time, since then we have been monitoring DXY closely and it seems like price have been holding up smoothly. If it fails we will update you all!!

DXY Index Next MovePair : DXY Index
Description :
Break of Structure
Short Sell Long Buy Divergence
Bearish Channel in Long Term and Breakout of the Upper Trend Line
Completed " 1234 " Impulsive and Making it " 5th " Wave
Rising Wedge in Short Time Frame as a Corrective Pattern

DXYWe see the breaking of the trend line with a higher slope, due to the breaking of the 102.2491 range
It can be expected to be touched around the second trend line with a lower slope.
1-102.7198
2-102.2491
3-101.3775
Objectives based on pivot points:
1-104.7767
2-105.3868
3-106.1712
It is not necessary to touch all the targets.
If you have the confirmation for the negative divergence and the above candle, you can get the confirmation of entering the upward trend from the bottom time.
