Dxytradingsetup

DXY Chart H1Here is my view for DXY on H1. The price could go down, you can put a pending order on the Order block or find an entry on LTF within OB Zone. Trade Safe!

DXY Idea H1Here is my view for DXY on H1. The price could go down, you can put a pending order on the Order block or find an entry on LTF within OB Zone. Trade Safe!

dxyThinking we finally have a 5th wave top in here, I was expecting $106.60 to be the final blow off top and that is still on the table. But as for now the ABC correction seems to have started. If this move proves to be yet another extension I would expect $106.60 plus to get tested b4 the predicted correction ensues.

DXY Chart H1Here is my view for DXY on H1. The price could go down, you can put a pending order on the Order block or find an entry on LTF within OB Zone. Trade Safe!

ICT ATM METHOD DXY!!!!!!!ICT ATM METHOD!!! short term high ran and rejection giving you the confirmation of the short, well look for this to reject inside the ob 104.900 and take out the local lows liquidity 103.400.
Price reaches the low ob+fvg 102.650 prior to running the sell side liquidity well monitor this for a potential area where we see a rejection (pray this doesn't happen) and if so well look to take profit and cut our positions.
HOLY GRAIL if price seeks the sell side liquidity 101.300 then we can really set our selves up for some relief.
WE STAY CALM AND COLLECTED, LET THE MARKET COME TO YOU AND EXECUTE LIKE A BOSS!!

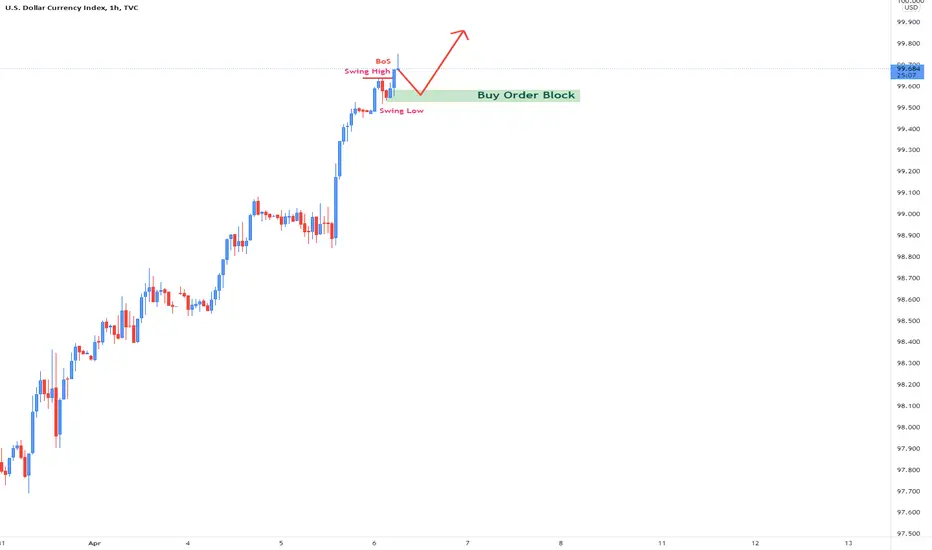
DXY Chart H1Here is my view for DXY on H1. The price could go up, you can put a pending order on the Order block or find an entry on LTF within OB Zone. Trade Safe!

DXY Chart H4Here is my view for DXY on H4. The price could go up, you can put a pending order on the Order block or find an entry on LTF within OB Zone. Trade Safe!

DXY Chart H1Here is my view for DXY on H1. The price could go up, you can put a pending order on the Order block or find an entry on LTF within OB Zone. Trade Safe!

DXY Chart H1Here is my view for DXY on H1. The price could go down, you can put a pending order on the Order block or find an entry on LTF within OB Zone. Trade Safe!

DXY Chart H4Here is my view for DXY on H4. The price could go up, you can put a pending order on the Order block or find an entry on LTF within OB Zone. Trade Safe!

Will DXY break above very important resistance?(long term view)Since 2015, USD Index is trading in two ranges: one between 92 and 100, and the large range boundaries, between 90 and 104.
After a strong and clear break in mid-April of 100 resistance, DXY has accelerated its gains and now is trading exactly under 104 resistance.
If you also look at the daily chart you can see that a small triangle is forming under this resistance, giving us the idea that a break up is imminent.
I expect another 10% rise for DXY to around 115 and only if the index falls back under 100 I will change my very strong bullish outlook for the Dollar

DXY skyrocket soon 120!!!This is not financial advice. This is for only my private trade plan. If you have follow at your own risk.

DXY(USD INDEX) SHORTS SHORT TERM 📉📉📉Expecting bearish price action on DXY on a short-term basis as pprice rejected a bearish orderblock on the H1, and shifted the market strucutre on the H1 from bullish into bearish.
From a medium-long term perspective i am still bullish on the DXY.
What do you think ? Comment below.

DXY- Correction round the corner?I'm bullish USD for quite some time and my 103-104 zone target was just hit.
Although I will remain bullish in the long term, at this moment I believe a correction will follow.
Looking at the monthly posted chart we can see that DXY is trading in a very strong resistance zone, market by 2017 and 2020 highs.
That being said, a drop to 100 is very probable for the index.

DXY Idea H1Here is my view for DXY on H1. The price could go up, you can put a pending order on the Order block or find an entry on LTF within OB Zone. Trade Safe!

DXY Idea H1Here is my view for DXY on H1. The price could go up, you can put a pending order on the Order block or find an entry on LTF within OB Zone. Trade Safe!

DXY SHORTS ACTIVE 📉📉📉Expecting bearish price action on DXY on a short-term perspective as price should fill the huge bullish imbalance that was formed on friday due fundamental reasons, there is also a possibility that price will take out weekly highs liquidity and then quickly reverse to the downside.
This perspective is only on a LTF basis, from a HTF perspective DXY is very bullish.
What do you think ? Comment below..

DXY SHORTS SHORT TERM📉📉📉📉 Expecting short-term shorts on the DXY from this area as price takes out liquidity above the 100$ institutional figure + weekly highs area. VIX should go down STOCKS should go up from a technial perspective meaning DXY has a high probabilty to go down, be mindfull that this in only SHORT-TERM ANALYSIS on the DXY as i am bullish on a mid-long term perspective
What do you think ? Comment below..

DXY Idea H1Here is my view for DXY on H1. The price should go up, you can put a pending order on the Order block or find an entry on LTF within OB Zone. Trade Safe!

DXY LONGS 100 📉📉📉Dxy touched 100$ as i told in the previous posts, we broke the monthly range area and i think new highs are expected on DXY. Strong USD after the FOMC meeting.
What do you think ? Comment below..

DXY Prediction D1Here is my view for DXY on D1. The price should go up, you can put a pending order on the Order block or find an entry on LTF within OB Zone. Trade Safe!

DXY Bullish H1Here is my view for DXY on H1. The price should go up, you can put a pending order on the Order block or find an entry on LTF within OB Zone. Trade Safe!