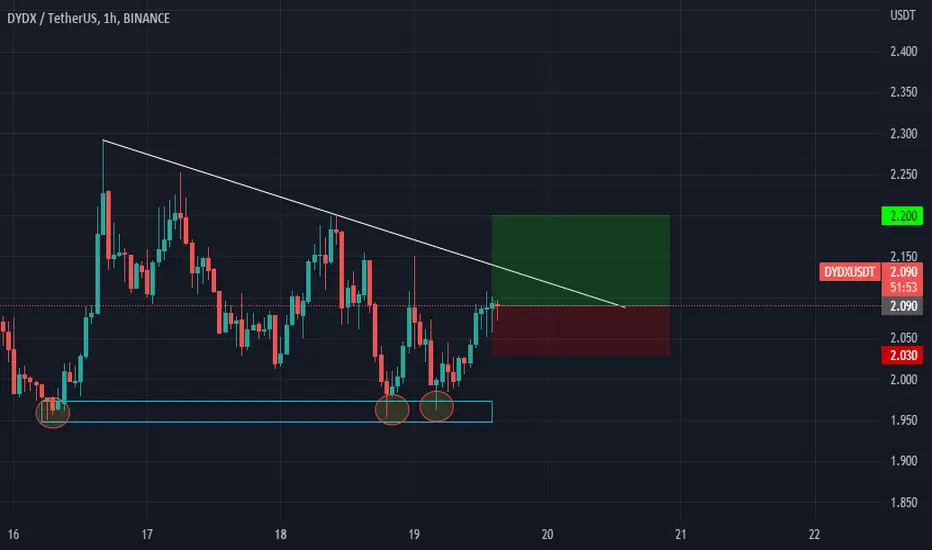
$DYDX #DYDX | LTF LONGIf you see some bullish breaker on 1H or below, you may think to open a long position.
Have a nice week!
Dydxlong

DYDX Price is Almost retracing to the Major Demand Zone Can be a Good Zone to buy from 1.2$ to 1$ With Target of Above 2.5$
Only Possible if BTC don’t dump hard We can see this Trade setup play out very Soon
Good luck

DYDX weekly double bottom. TargetsBINANCE:DYDXUSDT
Before massive unlock coins at the beginning of February and by this pattern we can see huge rally and FOMO on this coin
✅Before we start to discuss, I would be glad if you share your opinion on this post's comment section and hit the like button if you enjoyed it.
Thank you.
Possible Targets and explanation idea
➡️Weekly timeframe perfect double bottom. With 0.01$ beat previews high so it shows the future direction
➡️Beginning of February massive unlock coins from early investors and funds. We can see fake hype around before unlock
➡️Fib since drop in April still relevant
➡️Targets 0.5-0.618 lvl by Fib and 1.618 to bring FOMO
➡️After this targets Im expect drop one more time down to 3-2.70$ around March
Hope you enjoyed the content I created, You can support with your likes and comments this idea so more people can watch!
✅Disclaimer: Please be aware of the risks involved in trading. This idea was made for educational purposes only not for financial Investment Purposes.
• Look at my ideas about interesting altcoins in the related section down below ↓
• For more ideas please hit "Like" and "Follow"!


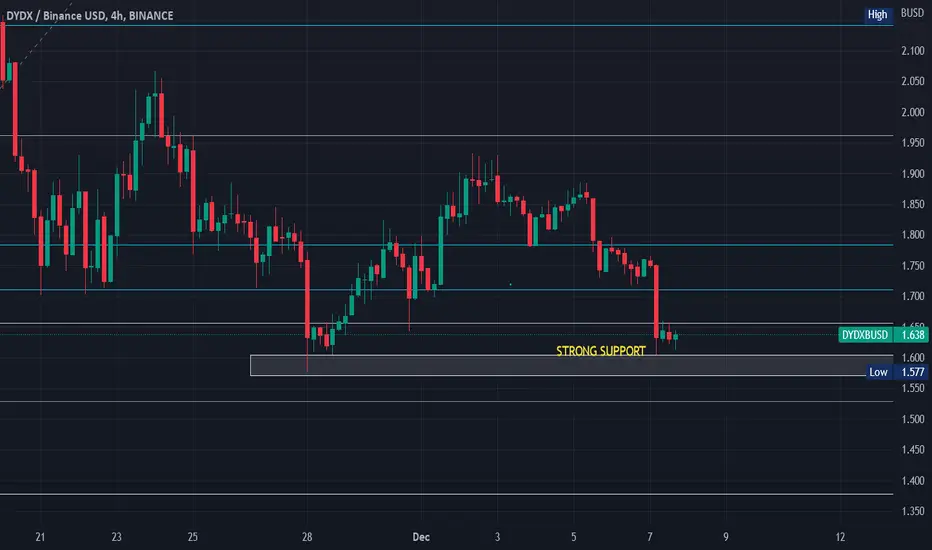
DYDX expected to bounce ! First Chart PublishedDYDX is being held by this strong support in grey area on the chart.
Currently in the range of 1.610 and 1.660.
With proper risk management taking this trade :
BUY : 1.577-1.622
TP:
1.700
1.800
1.960
SL:
1.520
NOTE:
DO YOUR OWN RESEARCH (DYOR)
NOT A FINANCIAL ADVICE
Good time to buy DYDX. Why?You know how all the assets are out from centralized exchanges to decentralized exchanges like Uniswap, DYDX, and etc.
On the daily chart of DYDX, it broke the longterm downward trendline, faked & rebounded.
It faced a short-term downward trendline, and seems to be breaking. (There was a minor retest in smaller timeframe afterwards)
MACD is gonna light up green
Wavetrend is green
RSI is gonna cross the signal line at 50 (which is the strong signal line)
So, I think this is a good time to buy DYDX, and I did.
This is not a financial advise, and you should do your own research & study.
P.S.
UNIUSDT, DYDXUSDT, GMXUSDT should be on your watchlist.

Long DYDXretracement towards the daily 200MA gives DYDX more power to pump. the uptrend line is still intact, possible pump will target the profit box.


DYDXUSDTPERP - Tool review.A trading range is formed on the chart with the boundaries 1.007 - 2.72.
When the price repeatedly approached the upper boundary, the breakout of the local maximum did not take place. For the given period of time accumulation is in the final phase. In this phase for the transition to the impulsive upward movement it is necessary that the price would break the local maximum and consolidate above it. In the presence of the SOS signal and BU/LPS will be a confirmation of a successful accumulation. In the absence of these signals we expect a further decline in price, to the middle of the range the second target is the lower boundary of support.
If you liked the idea, please like it. That's the best "Thank you!" for the author 😊
P.S. Always do your own analysis before a trade. Put a stop loss. Fix profits in installments. Withdraw profits in fiat and please yourself and your
your friends.


dydxusdtanalysis was shared few days ago
78% profit so far from our entry area
hold this token for sometime next year would be year of decentrilized tokens

DYDXUSDT - Flag Pattern DYDXUSDT (4h Chart) Technical analysis
DYDXUSDT (4h Chart) Currently trading at $1.465
Buy level: Above $1.47
Stop loss: Below $1.4
TP1:$1.495
TP2: $1.57
TP3: $1.64
TP4: $1.75
Max Leverage 3x
Always keep Stop loss
Follow Our Tradingview Account for More Technical Analysis Updates, | Like, Share and Comment Your thoughts

DYDX LONGPrice has completed AB=CD pattern
If it doesn't miss the current price floor, it looks like the beginning of an uptrend has started .
Stay tuned for more updates.

DYDX longDYDX is experiencing a pullback after a strong move that happened yesterday. It is bouncing off the support zone and the Fibonacci 0.5 level. Bullish movement to resistance level at 1.5 is possible.

400% growth DYDX price is real, but there are several conditionsThe DYDXUSDT price is starting to show "signs" that buyers are trying to push it off the bottom.
The downtrend has been going on for exactly a year, at the beginning of last October the price high was set around $28 for DYDX, and the low was $1 on June 22.
At the moment, the medium-term target for the growth of the DYDX price is in the range of 6-7 dollars.
- But before that, DYDX buyers need to break through the red downtrend line and fix the price above $1.70
- The next important stage that buyers and enthusiasts of DYDX will need to overcome is to break through and consolidate the price above $3. It will be difficult and at the same time very important, because $3 was the starting point of DYDX trading and this is a kind of psychological breakthrough and belief that the price can grow again.
- Only after these two conditions are met, it will be easier and more encouraging to think and believe in growth to $6-7 for DYDXUSD.
_____________________
Did you like our analysis? Leave a comment, like, and follow to get more

DYDX - DYDXUSDT #DYDX $DYDX #BTC $BTC
- BAT Pattern 🦇
- Daily Frame
# 🎧
#This is my technical opinion and not a recommendation to buy or sell

dYdX (DYDX) formed bullish Shark | A good long opportunityHi dear friends, hope you are well and welcome to the new trade setup of dYdX (DYDX) token with Bitcoin pair.
On a 4-hr time frame, DYDX has formed a bullish Shark pattern. Right now the priceline is slightly moved up, therefore, we can wait for some price correction to catch it from the buying zone.

#DYDX is moving upward in the range zone Hello #SorooshSchool guys
As you can see in the chart of #DYDXUSDT , It is in the rang zone between 1.59 - 1.70 and after retest the static supporting area ( the green area ) , Is consolidating to the important static resistance at the area of 1.70 ( The Red Area )
Thank you guys , Do not forget Like and Boost the Idea if you enjoy ...

dYdX (DYDX) formed bullish BAT for another upto 13% pumpHi dear friends, hope you are well and welcome to the new trade setup of dYdX (DYDX) token with the US Dollar pair.
In the previous trade DYDX slightly move below than potential reversal zone, however, it then pumped well:
Now on a 4-hr time frame, DYDX has formed bullish BAT pattern.
Note: Above idea is for educational purpose only. It is advised to diversify and strictly follow the stop loss, and don't get stuck with trade

DYDXDYDX/USDT we are looking on this coin make Triple Bottom and we have a Resistance Zone now we are PUSHING LONG this coin ENJOY
Disclamer:
We are not financial advisors. The content that we share on this website are for educational purposes and are our own personal opinions
dYdX (DYDX) formed bullish Gartley for upto 13% moveHi dear friends, hope you are well and welcome to the new trade setup of dYdX (DYDX) token with Bitcoin pair.
On a 4-hr time frame, DYDX has formed a bullish Gartley pattern:
Note: Above idea is for educational purpose only. It is advised to diversify and strictly follow the stop loss, and don't get stuck with trade

DYDX Long 20220711DYDX is in Demand Zone
Risk Reward: 4
DYDX, DYDXUSD, DYDXUSDT, CRYPTO,CRYPTOCURRENCY
DISCLAIMER
This is only a personal opinion and does NOT serve as investing NOR trading advice.
Please make your own decisions and be responsible for your own investing and trading Activities.

DYDX 6H BUYDYDX 6H support is at ~$1.39
Enter 50% at the current price
and try to set some buy orders near the support zone
If DYDX holds above the trendline,
the Take-Profit target would be 5%, 10%, and 15% from your entry
Cheers
