dYdX Bottom Consolidation Continues, Bullish NextHere you are looking at the formation of a bottom. The formation is a process not a single day event. It can take months for a bottom to fully form.
The way you know this to be true is because there is no downtrend. There are no new lows.
DYDX has been sideways now for 179 days, 6 months. Since early February 2025. In just three months, between December 2024 and March 2025, there is a very strong decline; lower highs and lower lows. A bearish move, a down-wave, a downtrend.
Ever since February the downtrend is no more. Rather than new major lows we have shy lower lows and finally not even that, no new lows. You can see the pattern how the market turned from bearish to sideways. This is the transition period. From sideways it will turn bullish, bullish goes next.
This is the point in time when most people will lose patiently and fold at a loss. Sell at the bottom, near support. This is the most important time to be patient, to accumulate, to even buy more and hold because we are looking at bottom prices. When prices are trading at the bottom and you are a bull, you can't go wrong.
Buy and hold. Continue holding because the market will soon turn.
Namaste.
DYDXUSDT

#DYDX/USDT#DYDX
The price is moving within a descending channel on the 1-hour frame, adhering well to it, and is on its way to breaking strongly upwards and retesting it.
We have support from the lower boundary of the descending channel, at 0.640.
We have a downtrend on the RSI indicator that is about to be broken and retested, supporting the upside.
There is a major support area in green at 0.638, which represents a strong basis for the upside.
Don't forget a simple thing: ease and capital.
When you reach the first target, save some money and then change your stop-loss order to an entry order.
For inquiries, please leave a comment.
We have a trend to hold above the 100 Moving Average.
Entry price: 0.650
First target: 0.669
Second target: 0.690
Third target: 0.717
Don't forget a simple thing: ease and capital.
When you reach your first target, save some money and then change your stop-loss order to an entry order.
For inquiries, please leave a comment.
Thank you.

DYDX/USDT Poised for a Massive Breakout – Is a Rally Toward $2+?✨ Comprehensive and Engaging Technical Analysis:
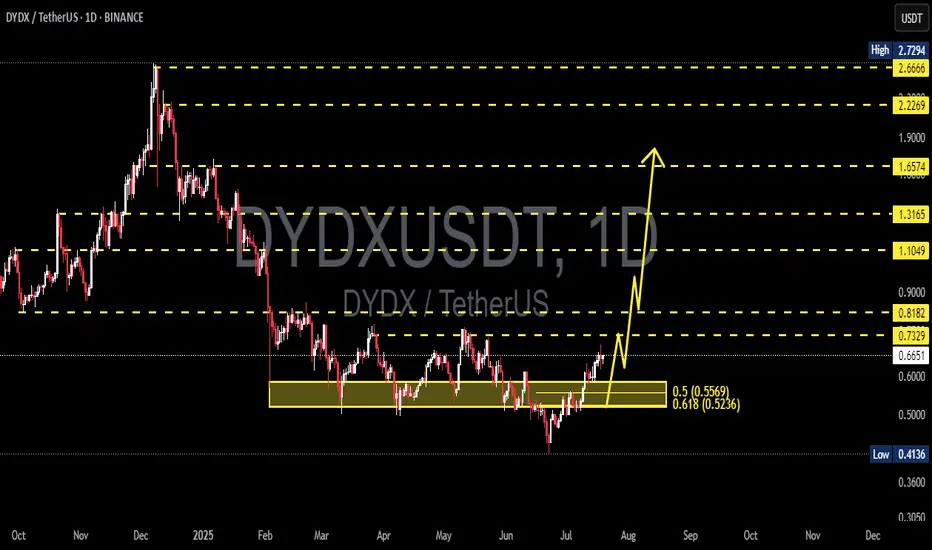
DYDX/USDT is entering a highly compelling technical phase, showing signs of a potential trend reversal after breaking out from a prolonged accumulation zone that lasted nearly 5 months. This breakout on the daily timeframe (1D) is a classic early signal for a major upward move — often favored by swing traders and mid-term investors.
🔍 Accumulation Zone & Fibonacci Golden Pocket
The range between $0.52 and $0.56 represents the Fibonacci retracement levels of 0.5 and 0.618 — commonly referred to as the "golden pocket".
This area historically acts as a strong accumulation zone, where institutional players often enter the market.
Multiple rejections and support confirmations within this zone reinforce its significance.
📈 Structure Breakout:
DYDX has officially broken above the horizontal structure near $0.6566 and further confirmed momentum beyond $0.7329.
The price action is forming a Double Bottom Pattern and potentially an Inverted Head & Shoulders, both of which are high-conviction bullish reversal patterns.
✅ Bullish Scenario (Primary Bias):
As long as DYDX holds above the $0.66–$0.73 breakout range, it remains on track for a significant bullish impulse. Key upside targets include:
Target (Resistance) Significance
$0.8182 Minor horizontal resistance
$1.1049 Key level from prior supply zone
$1.3165 Previous major reaction area
$1.6574 Multi-timeframe major resistance
$2.2269 – $2.6666 Fibonacci extension & historical distribution zone
$2.7294 Previous all-time high
💡 This structure offers a potential upside of over +200% if fully played out.
❗ Bearish Scenario (Alternative):
A failed retest and drop below $0.6566 would suggest a false breakout.
A breakdown below $0.52 would invalidate the bullish setup and could send DYDX back to $0.41, its previous macro support.
In this case, the market may re-enter a range-bound or sideways phase.
⚙️ Conclusion & Trading Strategy:
DYDX/USDT is at a technically critical moment. The recent breakout could mark the beginning of a major reversal trend after months of consolidation. A healthy pullback to the $0.66–$0.73 zone could offer an ideal entry opportunity with tight stop-losses.
For swing traders and trend followers, this may be one of the best risk/reward setups on DYDX in recent months.
#DYDXUSDT #DYDXBreakout #CryptoBullish #AltcoinSeason #CryptoAnalysis #FibonacciLevels #SmartMoney #DYDXRally #TechnicalBreakout
dYdX Hyper Bullish Market Conditions, $11.1 Next Target (1,671%)"Once we hit bottom, there is no other place left to go but up." dYdX hit bottom, a new all-time low last month and is turning ultra-hyper bullish this week. The action is already moving above EMA8 and EMA13 while breaking a local downtrend coming off the December 2024 peak price.
We have a full green candle and this candle signals a recovery and the start of the 2025 bull market cycle. This cycle can last 6-12 months for this specific pair or longer. Remember that each project, each trading pair, each altcoin can produce different price patterns and dynamics. This is easy to see because here we have a new all-time low, other pairs hit their all-time low in April this same year while others did so in August 2024, others in 2023, some others in 2022, etc. Each pair/project should be considered individually.
Good strong projects trading at bottom prices have higher potential for growth. For example, you can certainly make more money buying and holding dYdX tokens vs Solana or Ethereum. Because the latter two are trading much higher compared to their all-time high and because these projects are much bigger. Smaller projects have higher potential for growth.
So all is good in Crypto-world the market is going up. dYdX is turning bullish just now but the bias is confirmed based on marketwide action. Seeing how the other projects are performing predicts what comes next. When the week closes above EMA8 and EMA13, you have a full blown bullish confirmation. The action already recovered from the ATL range and is happening above the 10-March and 7-April lows. This is enough to secure/confirm growth.
We buy low to sell high. We buy when the market is red and hold.
We sell when prices are high. We sell when the market is green and there is lots of hype all around. Lots of profits to be made. At this point in time, all that is needed is to choose wisely and practice patience, patience will be the biggest earner; patience pays.
Thank you for reading.
Namaste.

#DyDx Superb opportunity#DYDX
The price is moving within a descending channel on the 1-hour frame, adhering well to it, and is on its way to breaking it strongly upwards and retesting it.
We have a bounce from the lower boundary of the descending channel. This support is at 0.470.
We have a downtrend on the RSI indicator that is about to be broken and retested, supporting the upside.
There is a major support area in green at 0.445, which represents a strong basis for the upside.
Don't forget a simple thing: ease and capital.
When you reach the first target, save some money and then change your stop-loss order to an entry order.
For inquiries, please leave a comment.
We have a trend to hold above the 100 Moving Average.
Entry price: 0.500.
First target: 0.522.
Second target: 0.537.
Third target: 0.559.
Don't forget a simple thing: ease and capital.
When you reach your first target, save some money and then change your stop-loss order to an entry order.
For inquiries, please leave a comment.
Thank you.


DYDXUSDT DYDXIf everything plays out as it did before, based on indicators and historical patterns, there's a chance we could see a breakout from the triangle by the end of June and potentially the start of an altseason.
However, it's more likely that consolidation will continue throughout July before we see any significant move.


What if...What if instead of a 6-12 months long bull market instead we see a 2-3 years long bull market? What if...
Instead of one big extended bullish wave we see slow and steady growth long-term, with no more huge crashes as the market evolves. This already happened in the past leading to the 2017 cycle top. The market grew in 2015, 2016, 2017...
Here we have DYDX producing lower lows. Maybe supply is expanding, maybe something with the way the token works, I don't know, the chart is showing lower lows, but this is still a transition period, other charts are producing higher highs and higher lows.
The recent drop below the lower trendline is called an "excess," a market excess and this type of move tends to be corrected almost right away. The action will move back above the trendline and then produce strong growth.
What if instead of a super fast and strong bull market we get a long-term drawn out one. The latter scenario would be the best. What if... I am open to seeing it happen, what about you?
Thank you for reading.
Namaste.

dydx sell midterm "🌟 Welcome to Golden Candle! 🌟
We're a team of 📈 passionate traders 📉 who love sharing our 🔍 technical analysis insights 🔎 with the TradingView community. 🌎
Our goal is to provide 💡 valuable perspectives 💡 on market trends and patterns, but 🚫 please note that our analyses are not intended as buy or sell recommendations. 🚫
Instead, they reflect our own 💭 personal attitudes and thoughts. 💭
Follow along and 📚 learn 📚 from our analyses! 📊💡"

#DYDX/USDT#DYDX
The price is moving within a descending channel on the 1-hour frame, adhering well to it, and is heading towards a strong breakout and retest.
We are experiencing a rebound from the lower boundary of the descending channel. This support is at 0.566
We are experiencing a downtrend on the RSI indicator, which is about to break and retest, supporting the upward trend.
We are heading towards stability above the 100 moving average.
Entry price: 0.575
First target: 0.584
Second target: 0.592
Third target: 0.602

DYDXUSDT 1D AnalysisDYDX ~ 1D Analysis
#DYDX Buy gradually from here with a short term target of at least 15%+.

Free signal todayHello friends
Given the good growth, now the price is correcting and we can buy within the support ranges with capital and risk management and move with it to the specified targets.
*Trade safely with us*

DYDX ANALYSIS📊 #DYDX Analysis
✅There is a formation of Falling Wedge Pattern on daily chart and currently trading around its support zone🧐
Pattern signals potential bullish movement incoming after the confirmation of retest
👀Current Price: $0.6344
🚀 Target Price: $0.7580
⚡️What to do ?
👀Keep an eye on #DYDX price action and volume. We can trade according to the chart and make some profits⚡️⚡️
#DYDX #Cryptocurrency #TechnicalAnalysis #DYOR

#DYDX#DYDX
The price is moving within a descending channel on the 1-hour frame, adhering well to it, and is heading for a strong breakout and retest.
We are seeing a bounce from the lower boundary of the descending channel, which is support at 0.
We have a downtrend on the RSI indicator that is about to break and retest, supporting the upside.
We are looking for stability above the 100 moving average.
Entry price: 0.706
First target: 0.741
Second target: 0.766
Third target: 0.800

dydx sell midterm"🌟 Welcome to Golden Candle! 🌟
We're a team of 📈 passionate traders 📉 who love sharing our 🔍 technical analysis insights 🔎 with the TradingView community. 🌎
Our goal is to provide 💡 valuable perspectives 💡 on market trends and patterns, but 🚫 please note that our analyses are not intended as buy or sell recommendations. 🚫
Instead, they reflect our own 💭 personal attitudes and thoughts. 💭
Follow along and 📚 learn 📚 from our analyses! 📊💡"

#DYDX/USDT#DYDX
The price is moving within a descending channel on the 1-hour frame, adhering well to it, and is on its way to breaking it strongly upwards and retesting it.
We are seeing a bounce from the lower boundary of the descending channel, which is support at 0.5000.
We have a downtrend on the RSI indicator that is about to break and retest, supporting the upward trend.
We are looking for stability above the 100 moving average.
Entry price: 0.543
First target: 0.563
Second target: 0.590
Third target: 0.623

DYDXUSDT 1DDYDX ~ 1D Analysis
#DYDX If this is valid. This will be a double bottom. Buy gradually from here with a short -term target of at least 15%+.

dYdX: Your Altcoin ChoiceIs it just me, or does anybody else think that charts look great when they trade at bottom prices?
I highly doubt that I am alone on this one; Once we hit bottom... The market is ready for growth; huge growth, massive growth.
Welcome my dear friend and thank you for reminding me to visit dYdX, a pair/project/exchange (DEX) that we love and will continue to love long-term.
What does the chart say?
The chart says, "Buy when others are fearful." "There is no moment like this now." "Opportunities are endless."
The chart is saying, "I've been going down but the last down has no force. I can go down for a while but never forever done. Once the correction is over, I am going up."
The chart is saying, "The last low is nothing more than a break of support. It is a market move, the whales are looking for liquidity before massive growth."
The chart says, "The best time to buy is now. Focus on the long-term; buy and hold."
Well, it is me saying all these things based on the data coming from the chart.
dYdX looks great.
A great buy.
Thanks a lot for your continued support.
Namaste.

DYDXUSDT - a real oppurtunity!the coin is currently in a deep bottom compared to its December peak, having dropped over 80%.
Buying now is a rare opportunity that may not come again in the future.
On the 3-day chart there is a nicly breakout of a 4 months downtrend ...
the most important resistance is at the key level—once it breaks, the price will pump insanely.
best regards Ceciliones🎯

DYDXUSDT – Key Resistance Zones Marked!I’ve identified blue boxes as critical resistance areas—these are the levels where price could face heavy selling pressure. But remember, we don’t short blindly—we wait for confirmations.
📊 How I’m Trading This:
✅ Step 1: Watch for CDV confirmation is volume decreasing while price climbs?
✅ Step 2: Look for LTF breakouts downward a clean market structure shift signals entry.
✅ Step 3: If resistance holds + volume supports = I take the trade. If not, I step aside.
💡 Why This Matters:
Most traders short too early and get wrecked. I wait for clear signs of rejection before entering. That’s the difference between guessing and executing.
🔥 Final Thought:
If price suddenly breaks upwards and holds, I will not insist on a short. But if we see rejection + a retest? Then it’s go time. 🚀
📈 Follow for precision trades—because smart traders wait for the perfect moment. 🔥
A tiny part of my runners:
🎯 ZENUSDT.P: Patience & Profitability | %230 Reaction from the Sniper Entry
🐶 DOGEUSDT.P: Next Move
🎨 RENDERUSDT.P: Opportunity of the Month
💎 ETHUSDT.P: Where to Retrace
🟢 BNBUSDT.P: Potential Surge
📊 BTC Dominance: Reaction Zone
🌊 WAVESUSDT.P: Demand Zone Potential
🟣 UNIUSDT.P: Long-Term Trade
🔵 XRPUSDT.P: Entry Zones
🔗 LINKUSDT.P: Follow The River
📈 BTCUSDT.P: Two Key Demand Zones
🟩 POLUSDT: Bullish Momentum
🌟 PENDLEUSDT.P: Where Opportunity Meets Precision
🔥 BTCUSDT.P: Liquidation of Highly Leveraged Longs
🌊 SOLUSDT.P: SOL's Dip - Your Opportunity
🐸 1000PEPEUSDT.P: Prime Bounce Zone Unlocked
🚀 ETHUSDT.P: Set to Explode - Don't Miss This Game Changer
🤖 IQUSDT: Smart Plan
⚡️ PONDUSDT: A Trade Not Taken Is Better Than a Losing One
💼 STMXUSDT: 2 Buying Areas
🐢 TURBOUSDT: Buy Zones and Buyer Presence
🌍 ICPUSDT.P: Massive Upside Potential | Check the Trade Update For Seeing Results
🟠 IDEXUSDT: Spot Buy Area | %26 Profit if You Trade with MSB
📌 USUALUSDT: Buyers Are Active + %70 Profit in Total
🌟 FORTHUSDT: Sniper Entry +%26 Reaction
🐳 QKCUSDT: Sniper Entry +%57 Reaction
📊 BTC.D: Retest of Key Area Highly Likely
📊 XNOUSDT %80 Reaction with a Simple Blue Box!
📊 ORCAUSDT %29 Reaction with a Simple Blue Box!
I stopped adding to the list because it's kinda tiring to add 5-10 charts in every move but you can check my profile and see that it goes on..

#DYDX/USDT#DYDX
The price is moving in a descending channel on the 1-hour frame and is adhering to it well and is heading to break it strongly upwards and retest it
We have a bounce from the lower limit of the descending channel, this support is at a price of 0.760
We have a downtrend on the RSI indicator that is about to be broken and retested, which supports the rise
We have a trend to stabilize above the moving average 100
Entry price 0.770
First target 0.800
Second target 0.820
Third target .842
