Long Entry at Channel Bottom for dYdXGreetings, Snipers!
DYDX has dropped >95% since its peak in 2021
DYDX is currently at the bottom of its channel range at $1.00-$1.20, with previous strong retracements
This may draw a potential sideway channel or a triple bottom pattern
The $1.00 level is expected to be a strong psychological support
$2.30 - $2.70 have posed to be a strong resistance level
In the shorter time frame, we can trade this channel:
We can take a long-entry now, at $1.00 - $1.10, and sell at $2.30 for a Risk-Reward ratio >5 (SL at $0.84).
Please be mindful that Bitcoin is on the verge of breakout of its continuation pattern to the downside, so manage your risks well!
Happy Sniping!
DYDXUSDT

Dydx reaching Its supply zoneIt started its movement abit sooner than expected. after a compression around MA200.
Now I expect to see a reach a supply zone. then , the next move by forming a divergence in MACD.

$DYDX will leave you behind scratching your head.FIFTH EXAMPLE!
I wasn't going to give more examples of what Altcoins to look for, but this one is a good one and I couldn't help but share it.
$DYDX
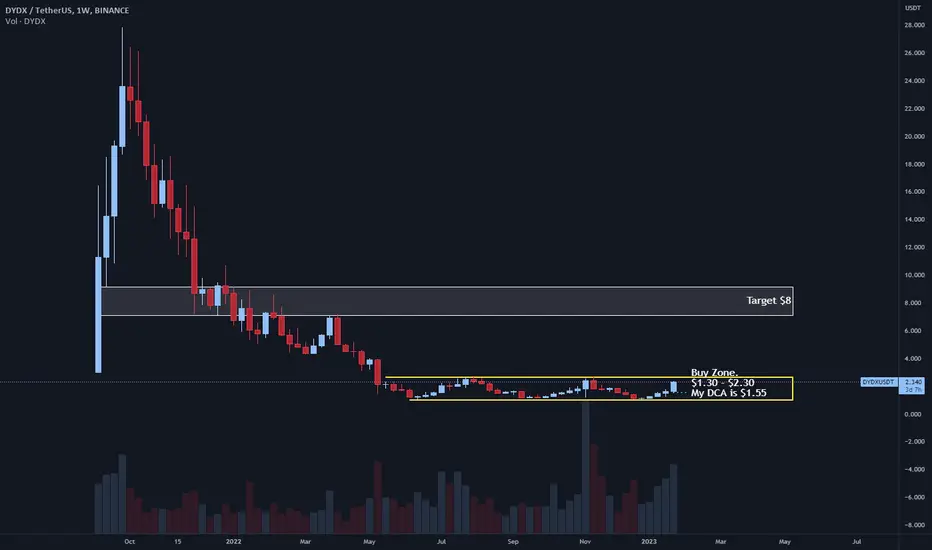
Looking for Targets of $8 within a few weeks/months.
KEEP AN EYE ON THIS ONE!
My DCA is $1.55
I have no SL, This is SPOT!
Try and buy before the Darvas Box accumulation breaks outs.
All this depends on $BTC and the continuation of the market. but select coins (Such as this) might not even care about the Bitcoin Market once they move big.
DYDX/ USDT Ida and forecastDYDXUSDT
✅ ✅ Risk warning, disclaimer: the above is a personal market judgment and analysis based on published information and historical chart data on The trading view,
And only some of these analyzes are my actual real trades.
I hope Traders consider I am Not responsible for your trades and investment decision.

DYDX price at a critical point, then "make it or break it"The DYDX price is now at a critical point
On the one hand, the DYDXUSDT price is at the bottom of the trade that lasts for the last 6 months
This price gives a good entry point for a medium-term trade +130% to $2.72 or a long-term trade +480% to $6.84
Stop for both positions below $1. The profit/loss ratio is more than adequate.
What part of the deposit to buy DYDX, for the medium or long term and whether it is worth buying at all depends only on you and a little more on the market)
This was the positive side of our analysis .
On the other hand , the trend of DYDXUSDT will change only after the price consolidates above $2.72. And this may not happen, because on 17.01.23, 5.7 million coins are to be sold, which will be 0.57% of the maximum possible supply of DYDX and +4% to the current number of coins in circulation.
And from February 2023, investors, consultants, and other early participants of the project will acquire ownership of DYDX, and we are talking about 100+ million coins
The increased supply of coins on the market, according to the law of supply and demand , can significantly push the price down.
The closer the DYDXUSDT price will approach $1, the higher will be the chance that the fall to $0.58 will not be avoided, and with it the development of the red scenario.
For some, this will sound like a total negative, and for others as a chance to buy at a more favorable price.
Earlier, in early November 2022, the price of DYDXUSDT showed a sharp increase from $1.20 to $2.72 in a week. During this period, there was a lot of negativity around the FTX exchange and its subsequent bankruptcy. It is very likely that then crypto users transferred assets from centralized crypto exchanges to decentralized DYDX.
It is difficult to predict what will happen this time, but the only thing we can control in the crypto market is the risks we are willing to take on a personal deposit.
_____________________
Did you like our analysis? Leave a comment, like, and follow to get more

DYDXUSDT(dYdX) Daily tf Range Updated till 26-01-23DYDXUSDT(dYdX) Daily timeframe range. price action isnt stable consider how big its range levels are. there are volume and mid retail interest that do had its effect. if the interest keeps us there are some optimal scalp positions here and there.


DYDXUSDT SHORT OPPORTUNITYHere we can see that "DYDXUSDT" in 1 day time frame has a trendline resistance at "1.981" and you can see a good short opportunity.
ENTRY - "1.981"
TARGET - "1.576"
STOPLOSS - "2.073"
ENJOY!!!!!

DYDXUSDTHello Crypto Lovers,
Mars Signals team wishes you high profits.
This is a one-day-time frame analysis for DYDXUSDT
Based on our previous analysis on January 8, we expected a rise will happen in the coming days and presently we see the precise prediction of our team. Here we have R1 as the resistance area that expresses the price was not able to rise at different points. S1 used to be another resistance area. And at the bottom of the chart, S2 and S3 are our support areas which include the well support of price at several points. Hence, we have the price fluctuating below R1 and we expect it to have some rising signs and increase would be there for the price up to R1 or above that. Also, if the price loses the support at R1 or at its current point, a decline will be there for it to reach lower amounts such as S2. The point is to wait for some confirmation candles in order to make sure what will happen next and act precisely.
Warning: This is just a suggestion and we do not guarantee profits. We advise you to analyze the chart before opening any positions.
Wish you luck

long DYDX$DYDX broke through the resistance level. Bullish trend is expected to continue and reach teh resistance at 2.07$

$DYDX #DYDX | LTF LONGGreen box and EQ might be worked as a support level .
The bottom of the red box, liquidity zone and around 1.93 will be the points I will observe as resistance.
With the loss of 1.53 (1H) , the first bounce of the price will be around 1.38 .
I wish everyone a good week.

DYDX/ USDT Idea✅ ✅ Risk warning, disclaimer: the above is a personal market judgment and analysis based on published information and historical chart data on The trading view,
And only some of these analyzes are my actual real trades.
I hope Traders consider I am Not responsible for your trades and investment decision.

DYDXUSDT getting compressed below MA200I believe there is another pomp potential for DYDX after being compressed around MA200 for a few days. What do you think?

0.037 DYDXUSDT!Well
ummmmm
nothing!
everything is obvious
please be ready for taking short position to 0.037.

DYDX : BREAKDOWN VIEWDYDX : BREAKDOWN VIEW
we will follow to see if this coin is able to break down more to check the below levels.

DYDX longDYDX bounced off the ascending trendline and bounced off the support level. Bullish movement to resistance level at 1.585 is expected to happen.

DYDXUSDTHello Crypto Lovers,
Mars Signals team wishes you high profits.
This is a one-day-time frame analysis for DYDXUSDT
In this chart, R1 is our resistance area in which the unsuccessful triumphs of price is obvious. R2 used to be a support area. And S1 and S2 are the support areas that contain the well support of price at various points. Presently, we observe the fluctuation of price below R1 after a recovery trend and our expectation would include a rise to move over this area toward R2; as it used to behave in its past trend which is seen by the white lines in a rising trend. Then there would be more rise via some rising signs and surely the price would face a rise up to higher amounts above R2. Or it happens that the price would not be supported and starts a decline downward. Please bear in mind that you need multiple pieces of information which you would obtain from our updates and analyses.
Warning: This is just a suggestion and we do not guarantee profits. We advise you to analyze the chart before opening any positions.
Wish you luck


$DYDX COMING DOWNContinuing downward for the abc move in htf 5 wave.
PRICE SHOULD CONTINUE MOVING DOWNWARD DUE TO BTC ON THE VERGE OF DUMPING TO 15K

Dydx price targets before unlock BINANCE:DYDXUSDTPERP
✅Before we start to discuss, I would be glad if you share your opinion on this post's comment section and hit the like button if you enjoyed it.
Thank you.
Watch this potential plan before unlock coins at the beginning of February
Possible Targets and explanation idea
➡️We trade over 230 days in an accumulation range.
➡️Before massive unlock coins at the beginning of February whales can pump #DYDX because they need liquidity to sell
➡️On weekly chart we formed 2 bottom and targets is 0.5 lvl and 0.78 lvl
➡️ After this level and unlock we can see pull back down again to main support level 2.70 - 2 $ per DYDX
➡️ Most hyped price when we can see FOMO on DYDX is 10-11$
➡️ Its just local picture for middle term targets
Hope you enjoyed the content I created, You can support with your likes and comments this idea so more people can watch!
✅Disclaimer: Please be aware of the risks involved in trading. This idea was made for educational purposes only not for financial Investment Purposes.
* Look at my ideas about interesting altcoins in the related section down below ↓
* For more ideas please hit "Like" and "Follow"!

Dydx short scalp setup before spot long.
Hi @everyone,
I just opened a short scalp trade on DYDX.
If the short hits it targets we are going to hedge DYDX. (we are buying spot long ) As we showed in our previous post on DYDX that we expect a bullish rally if the downtrend is ending after the SPRING phase. The long position would be a ''SWING'' setup and could take weeks/months to achieve targets. While we are waiting for the spot long entries we are taking this short scalp trade.
Entries (zone) and take profits for the short setup are in the menu on the chart.
We will update this, and the previous DYDX ideas with the tradeplan for buying spot long,
Regards,
Team Quantistic
